
Perhaps the most important feature of any debugger is the ability to closely control—and modify, if desired—the behavior of the process being debugged. To that end, most debuggers offer commands that allow one or more instructions to be executed before returning control to the debugger. Such commands are often used in conjunction with breakpoints that allow the user to specify that execution should be interrupted when a designated instruction is reached or when a specific condition is met.
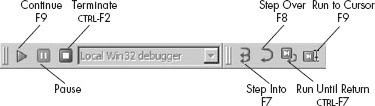
Basic execution of a process under debugger control is accomplished through the use of various Step, Continue, and Run commands. Because they are used so frequently, it is helpful to become familiar with the toolbar buttons and hotkey sequences associated with these commands. Figure 24-8 shows the toolbar buttons associated with execution of a process.
The behavior of each of these commands is described in the following list:
| Continue Resumes execution of a paused process. Execution continues until a breakpoint is hit, the user pauses or terminates execution, or the process terminates on its own. |
| Pause Pauses a running process. |
| Terminate Terminates a running process. |
| Step Into Executes the next instruction only. If the next instruction is a function call, breaks on the first instruction of the target function. Hence the name Step Into, since execution steps into any function being called. |
| Step Over Executes the next instruction only. If the next instruction is a function call, treats the call as a single instruction, breaking once the function returns. Hence the name Step Over, since stepping proceeds over functions rather than through them as with Step Into. Execution may be interrupted prior to completion of the function call if a breakpoint is encountered. Step Over is very useful as a time-saver when the behavior of a function is well known and uninteresting. |
| Run Until Return Resumes execution of the current function and does not stop until that function returns (or a breakpoint is encountered). This operation is useful when you have seen enough of a function and you wish to get out of it or when you inadvertently step into a function that you meant to step over. |
| Run to Cursor Resumes execution of the process and stops when execution reaches the current cursor location (or a breakpoint is hit). This feature is useful for running through large blocks of code without the need to set a permanent breakpoint at each location where you wish to pause. Beware that the program may not pause if the cursor location is bypassed or otherwise never reached. |
In addition to toolbar and hotkey access, all of the execution control commands are accessible via the Debugger menu. Regardless of whether a process pauses after a single step or hitting a breakpoint, each time the process pauses, all debugger-related displays are updated to reflect the state of the process (CPU registers, flags, memory contents) at the time the process was paused.
Breakpoints are a debugger feature that goes hand in hand with process execution and interruption (pausing). Breakpoints are set as a means of interrupting program execution at very specific locations within the program. In a sense a breakpoint is a more permanent extension of the Run to Cursor concept in that once a breakpoint is set at a given address, execution will always be interrupted when execution reaches that location, regardless of whether the cursor remains positioned on that location or not. However, while there is only one cursor to which execution can run, it is possible to set many breakpoints all over a program, the arrival at any one of which will interrupt execution of the program. Breakpoints are set in IDA by navigating to the location at which you want execution to pause and using the F2 hotkey (or right-clicking and selecting Add Breakpoint). Addresses at which breakpoints have been set are highlighted with a red (by default) band across the entire disassembly line. A breakpoint may be removed by pressing F2 a second time to toggle the breakpoint off. A complete list of breakpoints currently set within a program may be viewed via Debugger ▸ Breakpoints ▸ Breakpoint List.
By default, IDA utilizes software breakpoints, which are implemented by replacing the opcode byte at the breakpoint address with a software breakpoint instruction. For x86 binaries, this is the int 3 instruction, which uses opcode value 0xCC. Under normal circumstances, when a software breakpoint instruction is executed, the operating system transfers control to any debugger that may be monitoring the interrupted process. As discussed in Chapter 21, obfuscated code may take advantage of the behavior of software breakpoints in an attempt to hinder normal operation of any attached debugger.
As an alternative to software breakpoints, some CPUs (such as the x86, actually 386, and later) offer support for hardware-assisted breakpoints. Hardware breakpoints are typically configured through the use of dedicated CPU registers. For x86 CPUs, these registers are called DR0–7 (debug registers 0 through 7). A maximum of four hardware breakpoints can be specified using x86 registers DR0–3. The remaining x86 debug registers are used to specify additional constraints on each breakpoint. When a hardware breakpoint is enabled, there is no need to substitute a special instruction into the program being debugged. Instead, the CPU itself decides whether execution should be interrupted or not based on values contained within the debug registers.
Once a breakpoint has been set, it is possible to modify various aspects of its behavior. Beyond simply interrupting the process, debuggers often support the concept of conditional breakpoints, which allow users to specify a condition that must be satisfied before the breakpoint is actually honored. When such a breakpoint is reached and the associated condition is not satisfied, the debugger automatically resumes execution of the program. The general idea is that the condition is expected to be satisfied at some point in the future, resulting in interruption of the program only when the condition you are interested in has been satisfied.
The IDA debugger supports both conditional and hardware breakpoints. In order to modify the default (unconditional, software-based) behavior of a breakpoint, you must edit a breakpoint after it has been set. In order to access the breakpoint-editing dialog, you must right-click an existing breakpoint and select Edit Breakpoint. Figure 24-9 shows the resulting Breakpoint Settings dialog.
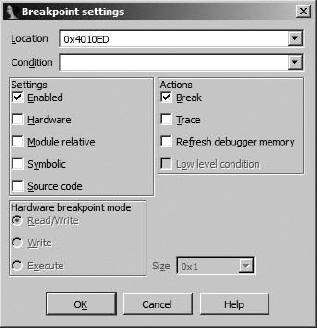
The Location box indicates the address of the breakpoint being edited, while the Enabled checkbox indicates whether the breakpoint is currently active or not. A breakpoint that is disabled is not honored regardless of any condition that may be associated with the breakpoint. The Hardware checkbox is used to request that the breakpoint be implemented in hardware rather than software.
Warning
A word of caution concerning hardware breakpoints: Though the x86 only supports four hardware breakpoints at any given time, as of this writing (IDA version 6.1), IDA will happily allow you to designate more than four hardware breakpoints. However, only four of them will be honored. Any additional hardware breakpoints will be ignored.
When specifying a hardware breakpoint, you must use the Hardware breakpoint mode radio buttons to specify whether the breakpoint behavior is to break on execute, break on write, or break on read/write. The latter two categories (break on write and break on read/write) allow you to create breakpoints that trigger when a specific memory location (usually a data location) is accessed, regardless of what instruction happens to be executing at the time the access takes place. This is very useful if you are more interested in when your program accesses a piece of data than where the data is accessed from.
In addition to specifying a mode for your hardware breakpoint, you must specify a size. For execute breakpoints the size must be 1 byte. For write or read/write breakpoints, the size may be set to 1, 2, or 4 bytes. When the size is set to 2 bytes, the breakpoint’s address must be word aligned (a multiple of 2 bytes). Similarly, for 4-byte breakpoints, the breakpoint address must be double-word aligned (a multiple of 4 bytes). A hardware breakpoint’s size is combined with its address to form a range of bytes over which the breakpoint may be triggered. An example may help to explain. Consider a 4-byte write breakpoint set at address 0804C834h. This breakpoint will be triggered by a 1-byte write to 0804C837h, a 2-byte write to 0804C836h, and a 4-byte write to 0804C832h, among others. In each of these cases, at least 1 byte in the range 0804C834h0804C837h is written. More information on the behavior of x86 hardware breakpoints can be found in the Intel 64 and IA-32 Architectures Software Developer’s Manual, Volume 3B: System Programming Guide, Part 2.[222]
Conditional breakpoints are created by providing an expression in the Breakpoint Settings dialog’s Condition field. Conditional breakpoints are a debugger feature, not an instruction set or CPU feature. When a breakpoint is triggered, it is the debugger’s job to evaluate any associated conditional expression and determine whether the program should be paused (the condition is met) or whether execution should simply continue (the condition is not met). Therefore, conditions may be specified for both software and hardware breakpoints.
IDA breakpoint conditions are specified using IDC (not Python) expressions. Expressions that evaluate to non-zero are considered true, satisfying the breakpoint condition and triggering the breakpoint. Expressions that evaluate to zero are considered false, failing to satisfy the breakpoint condition and failing to trigger the associated breakpoint. In order to assist in the creation of breakpoint expressions, IDA makes special register variables available within IDC (again, not Python) to provide direct access to register contents in breakpoint expressions. These variables are named after the registers themselves and include EAX, EBX, ECX, EDX, ESI, EDI, EBP, ESP, EFL, AX, BX, CX, DX, SI, DI, BP, SP, AL, AH, BL, BH, CL, CH, DL, and DH. These register variables are accessible only when the debugger is active.
Unfortunately, no variables exist that allow direct access to the processor flag bits. In order to access individual CPU flags, you need to call the GetRegValue function to obtain the value of the desired flag bit, such as CF. If you need a reminder regarding valid register and flag names, refer to the labels along the left and right edges of the General Registers window. A few example breakpoint expressions are shown here:
EAX == 100             // break if eax holds the value 100
ESI > EDI              // break if esi is greater than edi
Dword(EBP-20) == 10    // Read current stack frame (var_20) and compare to 10
GetRegValue("ZF")      // break if zero flag is set
EAX = 1                // Set EAX to 1, this also evaluates to true (non-zero)
EIP = 0x0804186C       // Change EIP, perhaps to bypass code
Two things to note about breakpoint expressions are the fact that IDC functions may be called to access process information (as long as the function returns a value) and the fact that assignment can be used as a means of modifying register values at specific locations during process execution. Ilfak himself demonstrated this technique as an example of overriding a function return value.[223]
The last breakpoint options that can be configured in the Breakpoint Settings dialog are grouped into the Actions box on the right side of the dialog. The Break checkbox specifies whether program execution should actually be paused (assuming any associated condition is true) when the break-point is reached. It may seem unusual to create a breakpoint that doesn’t break, but this is actually a useful feature if all you want to do is modify a specific memory or register value each time an instruction is reached without requiring the program to be paused at the same time. Selecting the Trace checkbox causes a trace event to be logged each time the breakpoint is hit.
Tracing offers a means of logging specific events that occur while a process is executing. Trace events are logged to a fixed-size trace buffer and may optionally be logged to a trace file. Two styles of tracing are available: instruction tracing and function tracing. When instruction tracing is enabled (Debugger ▸ Tracing ▸ Instruction Tracing), IDA records the address, the instruction, and the values of any registers (other than EIP) that were changed by the instruction. Instruction tracing can slow down a debugged process considerably, because the debugger must single-step the process in order to monitor and record all register values. Function tracing (Debugger ▸ Tracing ▸ Function Tracing) is a subset of instruction tracing in which only function calls (and optionally returns) are logged. No register values are logged for function trace events.
Three types of individual trace events are also available: write traces, read/write traces, and execution traces. As their names imply, each allows logging of a trace event when a specific action occurs at a designated address. Each of these individual traces is implemented using nonbreaking breakpoints with the trace option set. Write and read/write traces are implemented using hardware breakpoints and thus fall under the same restrictions mentioned previously for hardware breakpoints, the most significant being that no more than four hardware-assisted breakpoints or traces may be active at any given time. By default, execution traces are implemented using software breakpoints, and thus there is no limit on the number of execution traces that can be set within a program.
Figure 24-10 shows the Tracing Options (Debugger ▸ Tracing ▸ Tracing Options) dialog used to configure the debugger’s tracing operations.
Options specified here apply to function and instruction tracing only. These options have no effect on individual trace events. The Trace buffer size option specifies the maximum number of trace events that may be displayed at any given time. For a given buffer size n, only the n most recent trace events are displayed. Naming a log file causes all trace events to be appended to the named file. A file dialog is not offered when specifying a log file, so you must specify the complete path to the log file yourself. An IDC expression may be entered as a stop condition. The condition is evaluated prior to tracing through each instruction. If the condition evaluates to true, execution is immediately paused. The effect of this expression is to act as a conditional breakpoint that is not tied to any specific location.
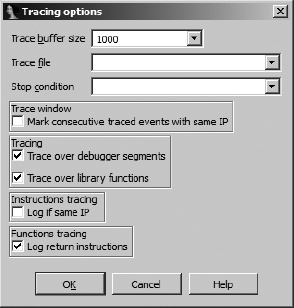
The Mark consecutive traced events with same IP option, when checked, causes consecutive trace events originating from the same instruction (IP here means Instruction Pointer) to be flagged with an equal sign. An example in which consecutive events can originate at the same instruction address occurs when the REP[224] prefix is used in x86 programs. In order for an instruction trace to show each repetition at the same instruction address, the Log if same IP option must also be selected. Without this option selected, an instruction prefixed with REP is listed only once each time it is encountered. The following listing shows a partial instruction trace using the default trace settings:
Thread Address Instruction Result ------ ------- ----------- ------00000150 .text:sub_401320+17 rep movsb ECX=00000000 ESI=0022FE2C EDI=0022FCF4 00000150 .text:sub_401320+19 pop esi ESI=00000000 ESP=0022FCE4
Note that the movsb instruction ![]() is listed only once.
is listed only once.
In the following listing, Log if same IP has been selected, resulting in each iteration of the rep loop being logged:
Thread   Address             Instruction   Result
------   -------             -----------   ------
000012AC .text:sub_401320+17 rep movsb     ECX=0000000B
 ESI=0022FE21 EDI=0022FCE9 EFL=00010206 RF=1
000012AC .text:sub_401320+17 rep movsb     ECX=0000000A ESI=0022FE22 EDI=0022FCEA
000012AC .text:sub_401320+17 rep movsb     ECX=00000009 ESI=0022FE23 EDI=0022FCEB
000012AC .text:sub_401320+17 rep movsb     ECX=00000008 ESI=0022FE24 EDI=0022FCEC
000012AC .text:sub_401320+17 rep movsb     ECX=00000007 ESI=0022FE25 EDI=0022FCED
000012AC .text:sub_401320+17 rep movsb     ECX=00000006 ESI=0022FE26 EDI=0022FCEE
000012AC .text:sub_401320+17 rep movsb     ECX=00000005 ESI=0022FE27 EDI=0022FCEF
000012AC .text:sub_401320+17 rep movsb     ECX=00000004 ESI=0022FE28 EDI=0022FCF0
000012AC .text:sub_401320+17 rep movsb     ECX=00000003 ESI=0022FE29 EDI=0022FCF1
000012AC .text:sub_401320+17 rep movsb     ECX=00000002 ESI=0022FE2A EDI=0022FCF2
000012AC .text:sub_401320+17 rep movsb     ECX=00000001 ESI=0022FE2B EDI=0022FCF3
000012AC .text:sub_401320+17 rep movsb     ECX=00000000
 ESI=0022FE2C EDI=0022FCF4 EFL=00000206 RF=0
000012AC .text:sub_401320+19 pop esi       ESI=00000000 ESP=0022FCE4
Finally, in the following listing, the Mark consecutive traced events with same IP option has been enabled, resulting in special markings that highlight the fact that the instruction pointer has not changed from one instruction to the next:
Thread   Address             Instruction  Result
------   -------             -----------  ------
000017AC .text:sub_401320+17 rep movsb    ECX=0000000B ESI=0022F
E21 EDI=0022FCE9 EFL=00010206 RF=1
=        =                   =            ECX=0000000A ESI=0022FE22 EDI=0022FCEA
=        =                   =            ECX=00000009 ESI=0022FE23 EDI=0022FCEB
=        =                   =            ECX=00000008 ESI=0022FE24 EDI=0022FCEC
=        =                   =            ECX=00000007 ESI=0022FE25 EDI=0022FCED
=        =                   =            ECX=00000006 ESI=0022FE26 EDI=0022FCEE
=        =                   =            ECX=00000005 ESI=0022FE27 EDI=0022FCEF
=        =                   =            ECX=00000004 ESI=0022FE28 EDI=0022FCF0
=        =                   =            ECX=00000003 ESI=0022FE29 EDI=0022FCF1
=        =                   =            ECX=00000002 ESI=0022FE2A EDI=0022FCF2
=        =                   =            ECX=00000001 ESI=0022FE2B EDI=0022FCF3
=        =                   =            ECX=00000000 ESI=0022FE2C
 EDI=0022FCF4 EFL=00000206 RF=0
000017AC .text:sub_401320+19 pop esi      ESI=00000000 ESP=0022FCE4
The last two options we will mention concerning tracing are Trace over debugger segments and Trace over library functions. When Trace over debugger segments is selected, instruction and function call tracing is temporarily disabled anytime execution proceeds to a program segment outside any of the file segments originally loaded into IDA. The most common example of this is a call to a shared library function. Selecting Trace over library functions temporarily disables function and instruction tracing anytime execution enters a function that IDA has identified as a library function (perhaps via FLIRT signature matching). Library functions linked into a binary should not be confused with library functions that a binary accesses via a shared library file such as a DLL. Both of these options are enabled by default, resulting in better performance while tracing (because the debugger does not need to step into library code) as well as a substantial reduction in the number of trace events generated, since instruction traces through library code can rapidly fill the trace buffer.
A stack trace is a display of the current call stack, or sequence of function calls that have been made in order for execution to reach a particular location within a binary. Figure 24-11 shows a sample stack trace generated using the Debugger ▸ Stack Trace command.
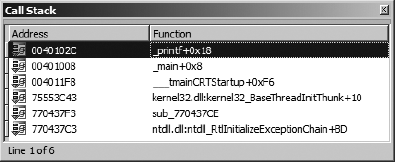
The top line in a stack trace lists the name of the function currently executing. The second line indicates the function that called the current function and the address from which that call was made. Successive lines indicate the point from which each function was called. A debugger is able to create a stack trace display by walking the stack and parsing each stack frame that it encounters, and it typically relies on the contents of the frame pointer register (EBP for x86) to locate the base of each stack frame. When a stack frame is located, the debugger can extract a pointer to the next stack frame (the saved frame pointer) as well as the saved return address, which is used to locate the call instruction used to invoke the current function. IDA’s debugger cannot trace through stack frames that do not utilize EBP as a frame pointer. At the function (rather than individual instruction) level, stack traces are useful for answering the question, “How did I get here?” or, more correctly, “What sequence of function calls led to this particular location?”
While debugging a process, you may wish to constantly monitor the value contained in one or more variables. Rather than requiring you to navigate to the desired memory locations each time the process is paused, many debuggers allow you to specify lists of memory locations whose values should be displayed each time the process is stopped in the debugger. Such lists are called watch lists, because they allow you to watch as the contents of designated memory locations change during program execution. Watch lists are simply a navigational convenience; they do not cause execution to pause like a breakpoint.
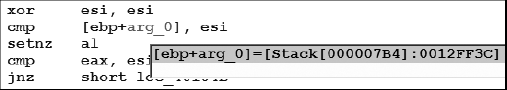
Because they are focused on data, watch points (addresses designated to be watched) are most commonly set in the stack, heap, or data sections of a binary. Watches are set in the IDA debugger by right-clicking a memory item of interest and selecting Add Watch. Determining exactly which address to set a watch on may require some thought. Determining the address of a global variable is somewhat less challenging than determining the address of a local variable because global variables are allocated and assigned fixed addresses at compile time. Local variables, on the other hand, don’t exist until runtime, and even then they exist only once the function in which they are declared has been called. With the debugger active, once you have stepped into a function, IDA is capable of reporting the addresses of local variables within that function. Figure 24-12 shows the result of mousing over a local variable named arg_0 (actually a parameter passed into the function).
Double-clicking a local variable within an active function causes IDA to jump the main IDA View window to the address of that local variable. Having arrived at the variable’s address, you may then add a watch on that address using the Add Watch context-sensitive menu option, though you will need to manually enter the address into the Watch Address dialog. If, instead, you take the time to name the memory location, IDA will automatically add a watch if you apply the same menu option to the name rather than the address.
You can access a list of all watches currently in effect via Debugger ▸ Watches ▸ Watch List. You can delete individual watches by highlighting the desired watch in the watch list and pressing DELETE.
[223] See http://www.hexblog.com/2005/11/simple_trick_to_hide_ida_debug.html and http://www.hexblog.com/2005/11/stealth_plugin_1.html.
[224] The REP prefix is an instruction modifier that causes certain x86 string instructions such as movs and scas to be repeated based on a count contained in the ECX register.