
We have mentioned a number of times that loading an obfuscated program in a debugger, allowing it to run until the de-obfuscation is complete, and then taking a memory snapshot of the program in its de-obfuscated state seems like a good strategy for obtaining a de-obfuscated version of a program. Controlled execution is probably a better way of thinking about this process than debugging, because all we are really doing is observing the code in operation and then taking a memory snapshot at the appropriate moment. A debugger simply happens to be the tool that allows us to accomplish this task. At least that is what we are hoping for. In Chapter 21 we discussed several anti-disassembly and anti-debugging techniques that obfuscators utilize in an attempt to prevent us from obtaining a clear picture of a program. It is time to see how IDA’s debugger can help us bypass some of these techniques.
For this chapter we will assume that the obfuscated programs we are dealing with employ some form of encryption or compression on the interesting portions of the binary. The level of difficulty in obtaining a clear picture of that code depends entirely on the sophistication of any anti-analysis techniques used in the obfuscation process and the measures that can be developed to circumvent these techniques. Before we get started, however, here are a few rules to live by when working with malware in a debugging environment:
Protect your network and host environments. Always work in a sandbox environment.
On initial analysis, use single stepping when possible. It may be tedious, but it is your best defense against a program escaping your control.
Always think twice before executing a debugger command that will allow more than a single instruction to execute. If you have not planned properly, the program you are debugging may run into a malicious portion of the code.
When possible, use hardware breakpoints. It is difficult to set software breakpoints in obfuscated code, because de-obfuscation algorithms may modify the breakpoint instructions that you have inserted or compute checksums over regions of code.[230]
When examining a program for the first time, it is best to allow the debugger to handle all exceptions generated by the program so that you can make informed decisions about which exceptions to pass to the program and which exceptions the debugger should continue to catch.
Be prepared to restart debugging often, because one wrong step can lead you down a road to failure (for example, if you allow the process to detect the debugger). Keep detailed notes regarding addresses that are safe to run to so that you can rapidly recover when you restart the process.
In general, you should always take a very cautious approach the first time you start to work with a particular obfuscated program. In most cases your primary goal should be to obtain a de-obfuscated version of the program. Speeding up the de-obfuscation process by learning exactly how far you can go before you need to set a breakpoint should be a secondary goal, and it is probably best saved for a follow-on exercise once you have managed to successfully de-obfuscate a program for the first time.
Whether you have spent minutes or hours studying a malicious executable with IDA, you will probably want to gain control of it at the earliest opportunity the first time you launch it in the debugger. One of the easiest ways to gain control over a process is to set a breakpoint at the process entry point, the first instruction executed once the operation has finished creating the process’s memory image. In most cases this will be the symbol labeled start; however, in some cases it won’t. The PE file format, for example, allows for the designation TLS[231] callback functions designed to perform initialization and destruction tasks for data that is local to each thread, and these TLS callback functions are invoked before control is ever transferred to start.
Malware authors are well aware of TLS callback functions and have made use of these functions to have code executed before a program’s main entry point code gets a chance to run. The hope is that anyone analyzing the malware will fail to notice the presence of the TLS callback, with a resulting failure to understand the true behavior of the program being analyzed. IDA properly parses PE file headers and recognizes the presence of any TLS callbacks contained within a PE file, adding any such functions to the binary’s list of entry points in the Exports window. Figure 25-3 shows the Exports window for an executable that contains a TLS callback.
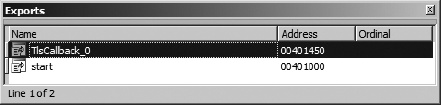
The bottom line when it comes to TLS callbacks is to recognize their presence and then set breakpoints at the beginning of each TLS callback function to ensure that you gain control of the process before it is too late.
Many debuggers offer options to specify when (if at all) the debugger should pause following initial process creation, and IDA is no exception. Figure 25-4 shows a portion of IDA’s Debugger Setup dialog (Debugger ▸ Debugger Options).
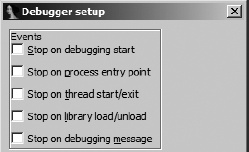
Each of the available options offers the opportunity to automatically pause the process being debugged when specific events occur. Each of these events is summarized in the following list:
Stop on debugging start This option offers the earliest opportunity to pause the debugger following process creation. For example, on Windows 7, this will pause the process at the beginning of the RtlUserThread-Start function within ntdll.dll. This will pause execution before any program code, including TLS callback functions, is executed. |
Stop on process entry point Causes the debugger to pause execution once the program entry point is reached. This typically coincides with the symbol named start (or its equivalent) in your IDA database. Any TLS callback functions will already have executed before this event takes place. |
| Stop on thread start/exit Pauses the debugger each time a new thread starts or an existing thread terminates. On a Windows system, when this event fires, the debugger will pause somewhere within kernel32.dll. |
| Stop on library load/unload Pauses the debugger each time a new library is loaded or an existing library is unloaded. On a Windows system, when this event fires, the debugger will pause somewhere within kernel32.dll. |
Stop on debugging message Pauses execution each time the process outputs a message using the debug print facility. On Windows systems, this corresponds to a call to OutputDebugString, and execution is paused within kernel32.dll. |
Understanding where the process is likely to be paused for each of these debugger events is important in order to keep the process you are debugging from executing further than you intend it to. Once you are certain that you will gain control of the process in a predictable manner, you can move on to getting some work done with the debugger.
When we say simple decryption and decompression loops, we mean loops that employ no nested obfuscation techniques and for which you can identify, with certainty, all possible exit points. When you encounter such loops, the easiest way to get through them is to set a breakpoint at all possible exit points and then allow the loop to execute. Consider single stepping through such loops one or two times in order to get a feel for them; then set breakpoints accordingly. When setting a breakpoint immediately following a loop, you should make sure that the bytes at the address at which you are setting the breakpoint will not be changed during the course of the loop; otherwise, a software breakpoint may fail to trigger. When in doubt, use a hardware breakpoint.
If your goal is to develop a fully automated de-obfuscation process, you will need to develop an algorithm for recognizing when the de-obfuscation process has completed. When this condition is satisfied, your automated solution can pause the process, at which point you can acquire a memory snapshot. For simple de-obfuscation routines, recognizing the end of the de-obfuscation stage may be as simple as noting a large change in the value of the instruction pointer or the execution of a specific instruction. For example, the beginning and end of the UPX decompression routine for an obfuscated Windows executable are shown in the following listing:
UPX1:00410370 start proc nearUPX1:00410370 pusha UPX1:00410371 mov esi, offset off_40A000 UPX1:00410376 lea edi, [esi-9000h] UPX1:0041037C push edi ... UPX1:004104EC pop eax
UPX1:004104ED popa ; opcode 0x53 UPX1:004104EE lea eax, [esp-80h] UPX1:004104F2 UPX1:004104F2 loc_4104F2: ; CODE XREF: start+186↓j UPX1:004104F2 push 0 UPX1:004104F4 cmp esp, eax UPX1:004104F6 jnz short loc_4104F2 UPX1:004104F8 sub esp, 0FFFFFF80h
UPX1:004104FB jmp loc_40134C
Several characteristics of this routine can be used to automatically recognize its completion. First, the routine begins by pushing all registers onto the stack at the program entry point ![]() . The complementary operation of popping all registers occurs near the end of the routine
. The complementary operation of popping all registers occurs near the end of the routine ![]() after the program has been decompressed. Finally, control is transferred
after the program has been decompressed. Finally, control is transferred ![]() to the newly unpacked program. Thus, one strategy for automating decompression would be to step trace the program until the current instruction is a
to the newly unpacked program. Thus, one strategy for automating decompression would be to step trace the program until the current instruction is a popa. Because step tracing is slow, the IDC script shown in Example 25-1 takes the slightly different approach of scanning for the popa instruction and then running the program to the address of the popa:
Example 25-1. Simple UPX unpacker script
#include <idc.idc>
#define POPA 0x53
static main() {
auto addr, seg;
addr = BeginEA(); //Obtain the entry point address
seg = SegName(addr);
while (addr != BADADDR && SegName(addr) == seg) {
if (Byte(addr) == POPA) {
 RunTo(addr);
GetDebuggerEvent(WFNE_SUSP, −1);
Warning("Program is unpacked!");
RunTo(addr);
GetDebuggerEvent(WFNE_SUSP, −1);
Warning("Program is unpacked!");
 TakeMemorySnapshot(1);
return;
}
addr = FindCode(addr, SEARCH_NEXT | SEARCH_DOWN);
}
Warning("Failed to locate popa!");
}
TakeMemorySnapshot(1);
return;
}
addr = FindCode(addr, SEARCH_NEXT | SEARCH_DOWN);
}
Warning("Failed to locate popa!");
}The script in Example 25-1 is designed to be launched within an IDA database, prior to launching the debugger, and assumes that you have previously selected a debugger using Debugger ▸ Select debugger. The script takes care of the details of launching the debugger and gaining control of the newly created process. This script relies on some very specific features of UPX and is therefore not a good candidate for use as a generic de-obfuscation script. It does, however, demonstrate some concepts that might be used in later efforts. The script depends on the fact that the decompression routine resides at the end of one of the program segments (typically named UPX1) and that UPX does not make use of any desynchronization techniques to prevent proper disassembly.
The script relies on these facts in order to scan forward, one instruction at a time ![]() , from the program entry point, as long as the next instruction lies within the same program segment
, from the program entry point, as long as the next instruction lies within the same program segment ![]() and until the current instruction is a
and until the current instruction is a popa ![]() . Once the
. Once the popa instruction is located, the debugger is invoked ![]() to execute the process up to the address of the
to execute the process up to the address of the popa instruction, at which point the program has been decompressed. The last step is to take a memory snapshot ![]() to pull the de-obfuscated program bytes back into our database for further analysis.
to pull the de-obfuscated program bytes back into our database for further analysis.
An even more general-purpose solution for automated unpacking is to exploit the fact that many de-obfuscation routines are appended to the end of a binary and perform a jump to the original entry point, which occurs much earlier in the binary, once de-obfuscation is complete. In some cases, the original entry point may lie in an entirely different program segment, while in other cases, the original entry point simply precedes any address used by the de-obfuscation code. The Python script in Example 25-2 offers a more basic means of running a simple de-obfuscation algorithm until it jumps to the program’s original entry point:
Example 25-2. Generic attempt to run until OEP is hit
start = BeginEA()MakeCode(GetEventEa()) TakeMemorySnapshot(1)
Similar to the script in Example 25-1, this script should be launched from the disassembler rather than the debugger and again assumes that a debugger has been selected. The script handles the details of launching the debugger and gaining the necessary control of the newly created process. This particular script makes two assumptions: that all code prior to the entry point is obfuscated and that nothing malicious takes place prior to transferring control to an address that precedes the entry point. The script begins by launching the debugger and pausing at the program entry point ![]() . Next, the program enables step tracing
. Next, the program enables step tracing ![]() and loops to test the address of each generated event
and loops to test the address of each generated event ![]() . Once the event address precedes the program entry point address, de-obfuscation is assumed to be complete, and the process is paused
. Once the event address precedes the program entry point address, de-obfuscation is assumed to be complete, and the process is paused ![]() and step tracing disabled
and step tracing disabled ![]() . Finally, for good measure, the script ensures that the bytes at the current instruction pointer location are formatted as code
. Finally, for good measure, the script ensures that the bytes at the current instruction pointer location are formatted as code ![]() .
.
When stepping your way through obfuscated code, it is not uncommon to encounter the warning shown in Figure 25-5.
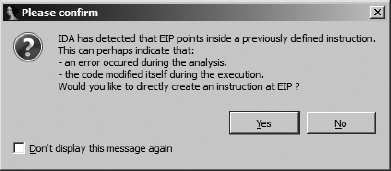
This warning indicates that the instruction pointer is pointing into an item that IDA believed was data or that the instruction pointer is pointing into the middle of a previously disassembled instruction. This warning is frequently encountered when single stepping through code that utilizes disassembly desynchronization techniques. It is also often encountered when a program jumps to a region that was once data and is now code, as happens following the de-obfuscation of a program. Answering yes to the question causes IDA to reformat the bytes in question as code, which should be the proper thing to do since the instruction pointer indicates that this is the next item to be fetched for execution.
Note that because of its use of step tracing, the script in Example 25-2 will be substantially slower than the script in Example 25-1. However, for the price of slower execution, we gain a couple of advantages. First, we are able to specify a termination condition that is not tied to any one address. This is not possible when using breakpoints alone. Second, this script is immune to any attempts to desynchronize the disassembler because instruction boundaries are determined purely based on runtime values of the instruction pointer rather than static disassembly analysis. In its announcement introducing scripted debugging features,[232] Hex-Rays presents a far more robust script for performing the tasks of a universal unpacker.
Once a binary has been de-obfuscated, analysis of that binary can begin. While we may never intend to execute the de-obfuscated program (in fact, we cannot execute that program if a snapshot was pulled directly into an IDA database), a program’s import table is almost always a valuable resource for developing an understanding of the program’s behavior.
Under normal circumstances, IDA is able to parse a program’s import table as part of the file-loading process upon initial database creation. Unfortunately, in obfuscated programs, the only import table that IDA sees at load time belongs to the de-obfuscation component of the program. This import table typically contains a bare minimum of functions required to complete the de-obfuscation process. The most sophisticated obfuscators may generate empty import tables, in which case the de-obfuscation component must contain all of the code necessary to load libraries and resolve necessary functions on its own.
As for the binary that has been obfuscated, in most cases its import table has been obfuscated as well and is reconstructed, in some form, as part of the de-obfuscation process. The reconstruction process typically relies on newly de-obfuscated data in order to perform its own library loading and function address resolution. For Windows programs, this nearly always involves calls to the LoadLibrary function combined with repeated calls to GetProcAddress to resolve required function addresses.
More sophisticated import table reconstruction routines may utilize custom lookup functions in place of GetProcAddress in order to avoid triggering any breakpoints set on GetProcAddress itself. Such routines may also substitute the use of hash values in place of strings for identifying which function’s address is being requested. In rare cases, import table reconstructors may go so far as to bypass LoadLibrary as well, in which case the reconstruction routine must implement its own custom version of that function.
The net result of the import table reconstruction process is usually a table of function addresses, none of which have much meaning in a static analysis context. If we take a memory snapshot of a process, the best we are likely to come up with is something like the following partial listing:
UPX1:0040A000 dword_40A000    dd 7C812F1Dh        ; DATA XREF: start+1↓o
UPX1:0040A004 dword_40A004    dd 7C91043Dh        ; DATA XREF: sub_403BF3+68↑r
UPX1:0040A004                                     ; sub_405F0B+2B4↑r ...
UPX1:0040A008                 dd 7C812ADEh
UPX1:0040A00C dword_40A00C    dd 7C9105D4h        ; DATA XREF: sub_40621F+5D↑r
UPX1:0040A00C                                     ; sub_4070E8+F↑r ...
UPX1:0040A010                 dd 7C80ABC1h
UPX1:0040A014 dword_40A014    dd 7C901005h        ; DATA XREF: sub_401564+34↑r
UPX1:0040A014                                     ; sub_4015A0+27↑r ...
This block of data depicts a number of 4-byte values, all in close proximity to one another and referenced from various locations with the program. The problem is that these values, such as 7C812F1Dh, represent addresses of library functions as they were mapped in the process we were debugging. Within the code section of the program itself, we would see function calls similar to the following:
UPX0:00403C5B
Note that two of the function calls, ![]() and
and ![]() refer to the contents of the reconstructed import table, while a third function call
refer to the contents of the reconstructed import table, while a third function call ![]() refers to a function whose body is present in the database. In an ideal world, each entry in the reconstructed import table would be named after the function whose address it contains.
refers to a function whose body is present in the database. In an ideal world, each entry in the reconstructed import table would be named after the function whose address it contains.
This problem is best addressed before taking a memory snapshot of the de-obfuscated process. As shown in the next listing, if we view the same memory range from within the debugger, we get an entirely different picture. Since the debugger has access to the memory regions in which each referenced function lies, the debugger is able to display addresses (such as 7C812F1Dh) as their corresponding symbolic names (in this case kernel32_GetCommandLineA).
UPX1:0040A000 off_40A000 dd offset kernel32_GetCommand
LineA ; DATA XREF:UPX0:loc_40128F↑r
UPX1:0040A000                                               ; start+1↓o
UPX1:0040A004 off_40A004 dd offset ntdll_RtlFreeHeap        ; DATA XREF:
 UPX0:004011E4↑r
UPX1:0040A004                                               ; UPX0:0040120A↑r ...
UPX1:0040A008 off_40A008 dd offset kernel32_GetVersionExA   ; DATA
 XREF: UPX0:004011D4↑r
UPX1:0040A00C dd offset ntdll_RtlAllocateHeap               ; DATA
 XREF: UPX0:004011B3↑r
UPX1:0040A00C                                               ; sub_405E98+D↑r ...
UPX1:0040A010 off_40A010 dd offset kernel32_GetProcessHeap  ; DATA
 XREF: UPX0:004011AA↑r
UPX1:0040A014 dd offset ntdll_RtlEnterCriticalSection ; DATA XREF: sub_401564+34↑r
UPX1:0040A014                                         ; sub_4015A0+27↑r ...
It is worth noting at this point that the debugger adopts a slightly different naming scheme than we are accustomed to. The debugger prefixes all functions exported from shared libraries with the name of the associated library followed by an underscore. For example, the function GetCommandLineA in kernel32.dll is assigned the name kernel32_GetCommandLineA. This ensures that unique names are generated should two libraries export the same name.
We need to overcome two problems with the import table shown in the preceding listing. First, in order for function calls to become more readable, we need to name each entry in the import table according to the function it references. If the entries are named properly, IDA will automatically display function signatures from its type libraries. Naming each import table entry is a relatively easy task as long as we have a name to assign. This leads to the second problem: obtaining the proper name. One approach is to parse the debugger-generated name, strip off the library name, and assign the remaining text as the name of the import table entry. The only problem with this approach is the fact that library names and function names may both contain underscore characters, making it difficult in some cases to determine the exact length of a function’s name within a longer name string. Recognizing this difficulty, this is nonetheless the approach taken by the renimp.idc import table–renaming script that ships with IDA (found in <IDADIR>/idc).
In order for this script to execute properly, it must be run while the debugger is active (so that it has access to loaded library names), and we must be able to locate the reconstructed import table within the de-obfuscated binary. One strategy for determining where the reconstructed import table will lie is to track calls to GetProcAddress and note where the results are stored into memory. Example 25-3 shows the code used by UPX to call GetProcAddress and store the result.
Example 25-3. UPX code to resolve and store imported function addresses
UPX1:00408897
The call to GetProcAddress takes place at ![]() , with the result being stored into memory at
, with the result being stored into memory at ![]() . Making note of the value held in the
. Making note of the value held in the ebx register at ![]() will tell us where the import table is located. The
will tell us where the import table is located. The ebx register is advanced by four bytes at ![]() to prepare it for the next iteration of the function resolution loop.
to prepare it for the next iteration of the function resolution loop.
Once we have located the reconstructed import table, renimp.idc requires that we highlight the contents of the table using a click-and-drag operation from the beginning to the end of the table. The renimp.idc script iterates across the selection, obtains the name of the referenced function, strips the library name prefix, and names the import table entry accordingly. Following execution of this script, the import table shown previously is transformed into the import table shown here:
UPX1:0040A000 ; LPSTR __stdcall GetCommandLineA()
UPX1:0040A000 GetCommandLineA dd offset kernel32_GetCommandLineA
UPX1:0040A000                                         ; DATA XREF: UPX0:loc_40128F↑r
UPX1:0040A000                                         ; start+1↓o
UPX1:0040A004 RtlFreeHeap dd offset ntdll_RtlFreeHeap ; DATA XREF: UPX0:004011E4↑r
UPX1:0040A004                                         ; UPX0:0040120A↑r ...
UPX1:0040A008 ; BOOL __stdcall GetVersionExA(LPOSVERSIONINFOA lpVersionInformation)
UPX1:0040A008 GetVersionExA dd offset kernel32_GetVersionExA ; DATA
 XREF: UPX0:004011D4↑r
UPX1:0040A00C RtlAllocateHeap dd offset ntdll_RtlAllocateHeap ; DATA
 XREF: UPX0:004011B3↑r
UPX1:0040A00C                                         ; sub_405E98+D↑r ...
UPX1:0040A010 ; HANDLE __stdcall GetProcessHeap()
UPX1:0040A010 GetProcessHeap dd offset kernel
32_GetProcessHeap ; DATA XREF: UPX0:004011AA↑r
UPX1:0040A014 RtlEnterCriticalSection dd offset ntdll_RtlEnterCriticalSection
UPX1:0040A014                                         ; DATA XREF: sub_401564+34↑r
UPX1:0040A014                                         ; sub_4015A0+27↑r ...
We see that the script has done the work of renaming each import table entry, but IDA has added function prototypes for each function whose type information IDA is aware of. Note that no type information would be visible if the library name prefix had not been stripped from each function name. The renimp.idc script can fail to properly extract an imported function name when the name of the module in which the function resides contains an underscore. The ws2_32 networking library is a well-known example of a module whose name happens to contain an underscore. Special handling of ws2_32 takes place within renimp.idc; however, any other module whose name contains an underscore will cause renimp.idc to parse function names incorrectly.
An alternative approach to renaming import table entries may be employed when a single instruction is responsible for storing all resolved function addresses as UPX does in Example 25-3. If such an instruction can be identified, such as the instruction at ![]() in the listing, then we can take advantage of the fact that breakpoint conditions in IDA are specified using IDC statements. In this case we might set a conditional breakpoint at address
in the listing, then we can take advantage of the fact that breakpoint conditions in IDA are specified using IDC statements. In this case we might set a conditional breakpoint at address 004088A1 and make the conditional expression invoke a function that we define. Here we name the function createImportLabel and define it as follows:
static createImportLabel() {
   auto n = Name(EAX);
   auto i = strstr(n, "_");
   while (i != −1) {
      n = n[i+1:];
      i = strstr(n, "_");
   }
   MakeUnkn(EBX,DOUNK_EXPAND);
   MakeDword(EBX);
   if (MakeNameEx(EBX,n,SN_NOWARN) == 0) {
      MakeNameEx(EBX,n + "_",SN_NOWARN);
   }
   return 0;
}
This function begins by querying for the name referenced by EAX. Recall that EAX contains the result of the call to GetProcAddress and thus should refer to a function within some DLL. Next, the function loops to truncate the name to just that portion following the last underscore found in the original name. Finally, a series of function calls is made to properly format the target location (referenced by EBX) as a 4-byte data item, and apply a name to that location. By returning zero, the function informs IDA that the breakpoint should not be honored, with the result that execution continues without pausing.
In Chapter 24, we discussed how to specify breakpoint conditions in IDA’s debugger. Installing a user-defined function as a breakpoint handler is not quite as straightforward as setting and editing a breakpoint and entering createImportLabel() as the breakpoint condition. While this is exactly the condition that we wish to enter in this case, the problem is that, from IDA’s perspective, createImportLabel is an undefined function. The workaround for this is to create a script file (IDC by definition) containing our function along with a simple main function that looks something like the following:
static main() {
   AddBpt(ScreenEA());
   SetBptCnd(ScreenEA(), "createImportLabel()");
}
Placing the cursor on the instruction that you wish to set the breakpoint on and then running this script (File ▸ Script File) results in a conditional breakpoint that calls createImportLabel each time it is hit. The AddBpt function ![]() adds a breakpoint at the specified location (the cursor location in this case), and the
adds a breakpoint at the specified location (the cursor location in this case), and the SetBptCnd function ![]() adds a condition to an existing breakpoint. The condition is specified as a string containing the IDC statement to evaluate each time the breakpoint is hit. With this breakpoint in place, once the de-obfuscation has completed, we will have a labeled import table without having to go through the trouble of locating the table within the process’s memory space.
adds a condition to an existing breakpoint. The condition is specified as a string containing the IDC statement to evaluate each time the breakpoint is hit. With this breakpoint in place, once the de-obfuscation has completed, we will have a labeled import table without having to go through the trouble of locating the table within the process’s memory space.
Yet another approach for deriving name information involves searching memory for the file headers associated with a function address and then parsing the export table described in those headers to locate the name of the function being referenced. This is essentially a reverse lookup of a function name given the function’s address. Scripts (RebuildImports.idc/RebuildImports.py) based on this concept are available on the book’s website. Either of these scripts may be executed in lieu of renimp.idc with nearly identical results. The problems faced by renimp.idc when dealing with modules whose names contain an underscore character are avoided because function names are extracted directly from export tables present in the process address space.
The effect of naming each import table entry properly carries through to the disassembly itself, as shown in the following automatically updated disassembly listing:
UPX0:00403C5B call    ds:RtlFreeHeap
UPX0:00403C61 test    eax, eax
UPX0:00403C63 jnz     short loc_403C7B
UPX0:00403C65 call    sub_40230F
UPX0:00403C6A mov     esi, eax
UPX0:00403C6C call    ds:RtlGetLastWin32Error
The name of each renamed import table entry is propagated to all locations from which imported functions are called, making the disassembly far more readable. It is worth noting that any formatting changes that you make while you’re working within the debugger are automatically applied to the database view as well. In other words, there is no need to take a memory snapshot simply to capture formatting changes that you have made. The purpose of a memory snapshot is to migrate memory content (code and data) from a processes address space back into an IDA database.
A popular method of preventing the use of debuggers as de-obfuscation tools is debugger detection. The authors of obfuscation tools understand just as well as you do that debuggers are useful for undoing their handiwork. In response, they often take measures to prevent their tools from running if the tools detect the presence of a debugger. We discussed a few debugger-detection methods in Chapter 21. As mentioned in Chapter 21, Nicolas Falliere’s article “Windows Anti-Debug Reference”[233] contains an excellent summary of a number of Windows-specific techniques for detecting the presence of a debugger. You can counter several of these detection techniques by using a simple script to start your debugger session and automatically configure some breakpoints. While it is possible to use Python to counter some of these techniques, we will ultimately be using conditional breakpoints, which we can only specify using IDC. For this reason the sample code that follows is all written in IDC.
In order to launch a debugging session from a script, we begin with the following code:
auto n;
   for (n = 0; n < GetEntryPointQty(); n++) {
      auto ord = GetEntryOrdinal(n);
      if (GetEntryName(ord) == "TlsCallback_0") {
         AddBpt(GetEntryPoint(ord));
         break;
      }
   }
   RunTo(BeginEA());
   GetDebuggerEvent(WFNE_SUSP, −1);
These statements check for the presence of a TLS callback function, set a breakpoint if one is found, and then launch the debugger, requesting to break on the entry point address before waiting for the operation to complete (strictly speaking, we should test the return value of GetDebuggerEvent as well). Once our script regains control, we have an active debugger session, and the process we wish to debug is mapped into memory along with all libraries on which it depends.
The first debugger detection we will bypass is the IsDebugged field of the process environment block (PEB). This is a 1-byte field that is set to the value 1 if the process is being debugged and 0 otherwise. The field lies 2 bytes into the PEB, so all we need to do is find the PEB and patch the proper byte to the value 0. This also happens to be the field tested by the Windows API function IsDebuggerPresent, so we manage to kill two birds with one stone in this case. If we know that we have stopped at the program entry point as opposed to a TLS callback, then locating the PEB turns out to be rather simple, because the EBX register contains a pointer to the PEB upon entry to the process. If instead the process has stopped at a TLS callback function, then we need a more general-purpose means of finding the PEB. We will take an approach similar to that often used in shellcode and obfuscators. The basic idea is to locate the current thread information block (TIB)[234] and follow an embedded pointer to find the PEB. The following code locates the PEB and makes the appropriate patch:
auto seg;
   auto peb = 0;
   auto tid = GetCurrentThreadId();
   auto tib = sprintf("TIB[%08X]", tid); //IDA naming convention
   for (seg = FirstSeg(); seg != BADADDR; seg = NextSeg(seg)) {
      if (SegName(seg) == tib) {
         peb = Dword(seg + 0x30); //read PEB pointer from TIB
         break;
      }
   }
   if (peb != 0) {
      PatchDbgByte(peb + 2, 0);  //Set PEB!IsDebugged to zero
   }
Note that the PatchDbgByte function was not introduced until IDA 5.5. When used with versions prior to IDA 5.5, PatchByte will work but will also modify (patch) the database if the address specified is present in the database.
Another anti-debugging technique mentioned in Falliere’s article involves testing several bits in another field of the PEB named NtGlobalFlags. The bits relate to the operation of a process’s heap and are set to 1 when a process is being debugged. Assuming variable peb remains set from the previous example, the following code retrieves the NtGlobalFlags field from the PEB, resets the offending bits, and stores the flags back into the PEB.
globalFlags = Dword(peb + 0x68) & ~0x70; //read and mask PEB.NtGlobalFlags
PatchDword(peb + 0x68, globalFlags);     //patch PEB.NtGlobalFlags
Several techniques in Falliere’s article rely on differences in information returned by system functions when a process is being debugged as opposed to when a process is not being debugged. The first function mentioned in the article is NtQueryInformationProcess, found in ntdll.dll. Using this function, a process may request information regarding its ProcessDebugPort. If the process is being debugged, the result is non-zero; if it is not being debugged, the result should be zero. One way to avoid detection in this manner is to set a breakpoint on NtQueryInformationProcess and then specify a breakpoint condition function to filter out ProcessDebugPort requests. In order to automatically locate this instruction, we take the following steps:
Look up the address of
NtQueryInformationProcess.Set a breakpoint on
NtQueryInformationProcess.Add a breakpoint condition to call a function we will name
bpt_NtQueryInformationProcess, which will be executed each timeNtQuery-InformationProcessgets called.
In order to find the address of NtQueryInformationProcess, we need to remember that the function will be named ntdll_NtQueryInformationProcess in the debugger. The code to configure the necessary breakpoint appears here:
func = LocByName("ntdll_NtQueryInformationProcess");
   AddBpt(func);
   SetBptCnd(func, "bpt_NtQueryInformationProcess()");
What remains is for us to implement the breakpoint function that will keep the debugger hidden from an inquiring process. The prototype for NtQueryInformationProcess is shown here:
NTSTATUS WINAPI NtQueryInformationProcess(
      __in       HANDLE ProcessHandle,
     __in       PROCESSINFOCLASS ProcessInformationClass,
     __out      PVOID ProcessInformation,
      __in       ULONG ProcessInformationLength,
      __out_opt  PULONG ReturnLength
  );
Information about a process is requested by providing an integer query identifier in the ProcessInformationClass parameter ![]() . Information is returned via the user-supplied buffer pointed to by the
. Information is returned via the user-supplied buffer pointed to by the ProcessInformation parameter ![]() . A caller may pass the enumerated constant
. A caller may pass the enumerated constant ProcessDebugPort (value 7) in order to query the debugging status of a given process. If a process is being debugged by a user-space debugger, the return value passed via the supplied pointer will be non-zero. If the process is not being debugged, the return value will be zero. A breakpoint function that always sets the ProcessDebugPort return value to zero is shown here:
#define ProcessDebugPort 7
  static bpt_NtQueryInformationProcess() {
     auto p_ret;
   if (Dword(ESP + 8) == ProcessDebugPort) {//test ProcessInformationClass
       p_ret = Dword(ESP + 12);
       if (p_ret) {
          PatchDword(p_ret, 0);  //fake no debugger present
        }
       EIP = Dword(ESP);   //skip function, just return
       ESP = ESP + 24;     //stdcall so clear args from stack
       EAX = 0;            //signifies success
     }
     return 0;  //don't pause at the breakpoint
  }
EAX = 0; //signifies success
}
return 0; //don't pause at the breakpoint
}Recall that this function is invoked each time NtQueryInformationProcess is called. On entry, the stack pointer is pointing to the saved return address, which lies on top of the five arguments to NtQueryInformationProcess. The breakpoint function begins by examining the value of the ProcessInformation-Class to determine whether the caller is requesting ProcessDebugPort information ![]() . If the caller is requesting
. If the caller is requesting ProcessDebugPort, the function continues by retrieving the return value pointer ![]() , testing that it is non-null
, testing that it is non-null ![]() , and finally storing a return value of zero
, and finally storing a return value of zero ![]() to make it appear that no debugger is attached. In order to skip the remainder of the function, EIP is then modified by reading the saved return address
to make it appear that no debugger is attached. In order to skip the remainder of the function, EIP is then modified by reading the saved return address ![]() , after which ESP is adjusted to simulate a
, after which ESP is adjusted to simulate a stdcall return ![]() .
. NtQueryInformationProcess returns an NTSTATUS code, which is set to 0 (success) at ![]() before returning.
before returning.
Another function mentioned in Falliere’s article is NtSetInformation-Thread, which is also found in ntdll.dll. The prototype for this function is shown here:
NTSTATUS NtSetInformationThread(
   IN HANDLE  ThreadHandle,
   IN THREADINFOCLASS  ThreadInformationClass,
   IN PVOID  ThreadInformation,
   IN ULONG  ThreadInformationLength
);
The anti-debugging technique involves passing the value ThreadHideFromDebugger in the ThreadInformationClass parameter, which causes a thread to be detached from a debugger. Bypassing this technique involves the same basic setup as the previous example. The resulting setup code is shown here:
func = LocByName("ntdll_NtSetInformationThread");
AddBpt(func);                  //break at function entry
SetBptCnd(func, "bpt_NtSetInformationThread()");
The associated breakpoint function is shown here:
#define ThreadHideFromDebugger 0x11
  static bpt_NtSetInformationThread() {
    if
 (Dword(ESP + 8) == ThreadHideFromDebugger) {//test ThreadInformationClass
       EAX = 0;        //STATUS_SUCCESS
       EIP = Dword(ESP); //just return
       ESP = ESP + 20;   //simulate stdcall
     }
     return 0;
  }
On entry we test the value of the ThreadInformationClass parameter ![]() and bypass the function body if the user has specified
and bypass the function body if the user has specified ThreadHideFromDebugger. Bypassing the function body is accomplished by setting our desired return value ![]() and modifying the instruction pointer by reading the saved return address out of the stack
and modifying the instruction pointer by reading the saved return address out of the stack ![]() . We simulate the
. We simulate the stdcall return by making a 20-byte adjustment to ESP ![]() .
.
The last function that we will discuss, whose use as an anti-debugging technique is also discussed in Falliere’s article, is OutputDebugStringA from kernel32.dll. The prototype of this function is shown here:
void WINAPI OutputDebugStringA(
   __in_opt  LPCTSTR lpOutputString
);
In this example, WINAPI is a synonym for _stdcall and is used to specify the calling convention employed by OutputDebugStringA. Strictly speaking, this function has no return value, as specified by the void return type in its prototype; however, according to the article, this function “returns” 1 when no debugger is attached to the calling process, and it “returns” the address of the string passed as a parameter if it is called while a debugger is attached to the calling process. Under normal circumstances, _stdcall functions that do return a value return that value in the EAX register. Since EAX must hold some value when OutputDebugStringA returns, it can be argued that this is the return value of the function; however, since the official return type is void, there is no documentation or guarantee as to what value EAX may actually hold in this case. This particular anti-debugging technique simply relies on the observed behavior of the function. One solution to the observed change in return values is to ensure that EAX contains 1 whenever OutputDebugStringA returns. The following IDC code implements this technique:
func = LocByName("kernel32_OutputDebugStringA");
  AddBpt(func);
  //fix the return value as expected in non-debugged processes
  //also adjust EIP and ESP
 SetBptCnd(func, "!((EAX = 1) && (EIP = Dword(ESP)) && (ESP = ESP + 8))");
This example uses the same technique for automatically locating the end of the OutputDebugStringA function that we used in the preceding examples. However, in contrast to the preceding example, the work that needs to be done when the breakpoint is hit is simple enough to be specified in an IDC expression ![]() (rather than requiring a dedicated function). In this case, the breakpoint expression modifies (note this is assignment rather than comparison) the EAX register to ensure that it contains 1 when the function returns and also adjusts EIP and ESP to bypass the function. The breakpoint condition is negated to cause the breakpoint to be skipped in all cases, because the result of the Boolean and expression is always expected to be nonzero.
(rather than requiring a dedicated function). In this case, the breakpoint expression modifies (note this is assignment rather than comparison) the EAX register to ensure that it contains 1 when the function returns and also adjusts EIP and ESP to bypass the function. The breakpoint condition is negated to cause the breakpoint to be skipped in all cases, because the result of the Boolean and expression is always expected to be nonzero.
A script (HideDebugger.idc) that combines all of the elements presented in this section into a useful tool for simultaneously initiating debugging sessions and implementing measures to combat anti-debugging attempts is available on the book’s website. For more information on hiding the presence of the debugger, please see Ilfak’s blog, where he presents several hiding techniques.[235]
[230] Keep in mind that the software breakpoint instruction inserted by the debugger will cause the checksum computation to yield a result other than the expected result.
[231] For more information on Thread Local Storage (TLS) callback functions, please refer to the PE file format specification http://msdn.microsoft.com/en-us/windows/hardware/gg463119.aspx.
[234] This is also known as a thread environment block (TEB).