
In many cases you will be perfectly content with the disassembly listings that IDA generates. In some cases you won’t. As the types of files that you analyze diverge farther and farther from ordinary executables generated with common compilers, you may find that you need to take more control of the disassembly analysis and display processes. This will be especially true if you find yourself performing analysis of obfuscated code or files that utilize a custom (unknown to IDA) file format.
Code transformations facilitated by IDA include the following:
Converting data into code
Converting code into data
Designating a sequence of instructions as a function
Changing the starting or ending address of an existing function
Changing the display format for instruction operands
The degree to which you utilize these operations depends on a wide variety of factors and personal preferences. In general, if a binary is very complex, or if IDA is not familiar with the code sequences generated by the compiler used to build the binary, then IDA will encounter more problems during the analysis phase, and you will need to make manual adjustments to the disassembled code.
The simplest transformations that you can make to a disassembly listing involve customizing the amount of information that IDA generates for each disassembly line. Each disassembled line can be considered as a collection of parts that IDA refers to, not surprisingly, as disassembly line parts. Labels, mnemonics, and operands are always present in a disassembly line. You can select additional parts for each disassembly line via Options ▸ General on the Disassembly tab, as shown in Figure 7-4.
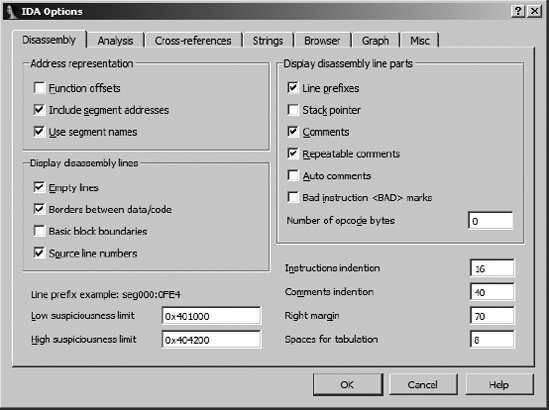
The Display Disassembly Line Parts section in the upper right offers several options for customizing disassembly lines. For IDA’s text disassembly view, line prefixes, comments, and repeatable comments are selected by default. Each item is described here and shown in the listing that follows.
- Line prefixes
A line prefix is the
section:addressportion of each disassembly line. Deselecting this option causes the line prefix to be removed from each disassembly line (the default in graph view). To illustrate this option, we have disabled line prefixes in the next listing.- Stack pointer
IDA performs extensive analysis on each function in order to track changes to the program stack pointer. This analysis is essential in understanding the layout of each function’s stack frame. Selecting the Stack pointer option causes IDA to display the relative change to the stack pointer throughout the course of each function. This may be useful in recognizing discrepancies in calling conventions (IDA may not understand that a particular function uses
stdcall, for example) or unusual manipulations of the stack pointer. Stack pointer tracking is shown in the column under . In this example, the stack pointer has changed by four bytes following the first instruction and a total of 0x7C bytes following the third instruction. By the time the function completes, the stack pointer is restored to its original value (a relative change of zero bytes). Whenever IDA encounters a function return statement and detects that the stack pointer value is not zero, an error condition is flagged and the instruction line highlighted in red. In some cases, this might be a deliberate attempt to frustrate automated analysis. In other cases, it may be that a compiler utilizes prologues and epilogues that IDA can’t accurately analyze.
- Comments and repeatable comments
Deselecting either of these options inhibits the display of the respective comment type. This may be useful if you wish to declutter a disassembly listing.
- Auto comments
IDA can automatically comment some instruction types. This can serve as a reminder as to how particular instructions behave. No comments are added for trivial instructions such as the x86
mov. The comments at are examples of auto comments. User comments take precedence over auto comments; in this case if you want to see IDA’s automatic comment for a line, you’ll have to remove any comments you’ve added (regular or repeatable).
- Bad instruction
<BAD>marks IDA can mark instructions that are legal for the processor but that may not be recognized by some assemblers. Undocumented (as opposed to illegal) CPU instructions may fall in this category. In such cases IDA will disassemble the instruction as a sequence of data bytes and display the undocumented instruction as a comment prefaced with
<BAD>. The intent is to generate a disassembly that most assemblers can handle. Refer to the IDA help file for more information on the use of<BAD>marks.- Number of opcode bytes
Most disassemblers are capable of generating listing files that display the generated machine language bytes side by side with the assembly language instructions from which they are derived. IDA allows you to view the machine language bytes associated with each instruction by synchronizing a hex display to the disassembly listing display. You can optionally view machine language bytes mixed with assembly language instructions by specifying the number of machine language bytes that IDA should display for each instruction.
This is fairly straightforward when you are disassembling code for processors that have a fixed instruction size, but it is somewhat more difficult for variable-length instruction processors such as the x86, for which instructions may range from one to more than a dozen bytes in size. Regardless of the instruction length, IDA reserves display space in the disassembly listing for the number of bytes that you specify here, pushing the remaining portions of the disassembly line to the right to accommodate the specified number of opcode bytes. Number of opcode bytes has been set to 5 in the following disassembly and can be seen in the columns under
 . The + symbol at
  indicates that the specified instruction is too long to be fully displayed given the current settings.
You can further customize the disassembly display by adjusting the indentation values and margins shown in the lower right of Figure 7-4. Any changes to these options affect only the current database. Global settings for each of these options are stored in the main configuration file, <IDADIR>/cfg/ida.cfg.
During the disassembly process, IDA makes many decisions regarding how to format operands associated with each instruction. The biggest decisions generally revolve around how to format various integer constants used by the wide variety of instruction types. Among other things, these constants can represent relative offsets in jump or call instructions, absolute addresses of global variables, values to be used in arithmetic operations, or programmer-defined constants. In order to make a disassembly more readable, IDA attempts to use symbolic names rather than numbers whenever possible. In some cases, formatting decisions are made based on the context of the instruction being disassembled (such as a call instruction); in other cases, the decision is based on the data being used (such as access to a global variable or an offset into a stack frame). In many other cases, the exact context in which a constant is being used may not be clear. When this happens, the associated constant is typically formatted as a hexadecimal constant.
If you happen not to be one of the few people in the world who eat, sleep, and breathe hex, then you will welcome IDA’s operand formatting features. Right-clicking any constant in a disassembly opens a context-sensitive menu similar to that shown in Figure 7-5.
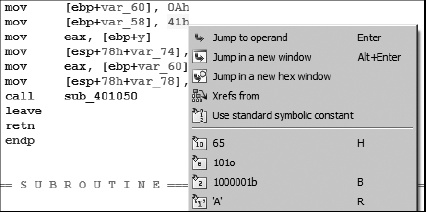
In this case, menu options are offered enabling the constant (41h) to be reformatted as decimal, octal, or binary values. Since the constant in this example falls within the ASCII printable range, an option is also presented to format the value as a character constant. In all cases, the menu displays the exact text that will replace the operand text should a particular option be selected.
In many cases, programmers use named constants in their source code. Such constants may be the result of #define statements (or their equivalent), or they may belong to a set of enumerated constants. Unfortunately, by the time a compiler is finished with the source code, it is no longer possible to determine whether the source used a symbolic constant or a literal, numeric constant. IDA maintains a large catalog of named constants associated with many common libraries such as the C standard library or the Windows API. This catalog is accessible via the Use standard symbolic constant option on the context-sensitive menu associated with any constant value. Selecting this option for the constant 0Ah in Figure 7-5 opens the symbol-selection dialog shown in Figure 7-6.
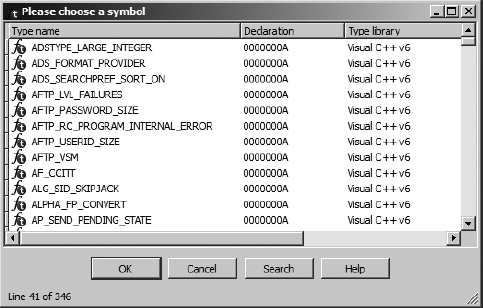
The dialog is populated from IDA’s internal list of constants after filtering according to the value of the constant we are attempting to format. In this case we see all of the constants that IDA knows to be equated with the value 0Ah. If we determined that the value was being used in conjunction with the creation of an X.25-style network connection, then we might select AF_CCITT and end up with the following disassembly line:
.text:004010A2 mov [ebp+var_60], AF_CCITT
The list of standard constants is a useful way to determine whether a particular constant may be associated with a known name and can save a lot of time reading through API documentation in search of potential matches.
There are a number of reasons that you may wish to manipulate functions after the initial autoanalysis has been completed. In some cases, such as when IDA fails to locate a call to a function, functions may not be recognized, as there may be no obvious way to reach them. In other cases, IDA may fail to properly locate the end of a function, requiring some manual intervention on your part to correct the disassembly. IDA may have trouble locating the end of a function if a compiler has split the function across several address ranges or when, in the process of optimizing code, a compiler merges common end sequences of two or more functions in order to save space.
Under certain circumstances, new functions can be created where no function exists. New functions can be created from existing instructions that do not already belong to a function, or they can be created from raw data bytes that have not been defined by IDA in any other manner (such as double words or strings). You create functions by placing the cursor on the first byte or instruction to be included in the new function and selecting Edit ▸ Functions ▸ Create Function. IDA attempts to convert data to code if necessary. Then it scans forward to analyze the structure of the function and search for a return statement. If IDA can locate a suitable end of the function, it generates a new function name, analyzes the stack frame, and restructures the code in the form of a function. If it can’t locate the end of the function or encounters any illegal instructions, then the operation fails.
You can delete existing functions using Edit ▸ Functions ▸ Delete Function. You may wish to delete a function if you believe that IDA has erred in its autoanalysis.
Function chunks are commonly found in code generated by the Microsoft Visual C++ compiler. Chunks are the result of the compiler moving blocks of code that are less frequently executed in order to squeeze frequently executed blocks into memory pages that are less likely to be swapped out.
When a function is split in such a manner, IDA attempts to locate all of the associated chunks by following the jumps that lead to each chunk. In most cases IDA does a good job of locating all of the chunks and listing each chunk in the function’s header, as shown in the following partial function disassembly:
.text:004037AE ChunkedFunc proc near .text:004037AE .text:004037AE var_420 = dword ptr −420h .text:004037AE var_41C = dword ptr −41Ch .text:004037AE var_4 = dword ptr −4 .text:004037AE hinstDLL = dword ptr 8 .text:004037AE fdwReason = dword ptr 0Ch .text:004037AE lpReserved = dword ptr 10h .text:004037AE .text:004037AE ; FUNCTION CHUNK AT
Function chunks are easily reached by double-clicking the address associated with the chunk, as at ![]() . Within the disassembly listing, function chunks are denoted by comments that delimit their instructions and that refer to the owning function, as shown in this listing:
. Within the disassembly listing, function chunks are denoted by comments that delimit their instructions and that refer to the owning function, as shown in this listing:
.text:004040D7 ; START OF FUNCTION CHUNK FOR ChunkedFunc
.text:004040D7
.text:004040D7 loc_0040C0D7:                   ; CODE XREF: ChunkedFunc+72↑j
.text:004040D7                 dec     eax
.text:004040D8                 jnz     loc_403836
.text:004040DE                 call    sub_4040ED
.text:004040E3                 jmp     loc_403836
.text:004040E3 ; END OF FUNCTION CHUNK FOR ChunkedFunc
In some cases IDA may fail to locate every chunk associated with a function, or functions may be misidentified as chunks rather than as functions in their own right. In such cases, you may find that you need to create your own function chunks or delete existing function chunks.
You create new function chunks by selecting the range of addresses that belong to the chunk, which must not be part of any existing function, and selecting Edit ▸ Functions ▸ Append Function Tail. At this point you will be asked to select the parent function from a list of all defined functions.
Note
In disassembly listings, function chunks are referred to as just that: function chunks. In the IDA menu system, functions chunks are instead referred to as function tails.
You can delete existing function chunks by positioning the cursor on any line within the chunk to be deleted and selecting Edit ▸ Functions ▸ Remove Function Tail. At this point you will be asked to confirm your action prior to deleting the selected chunk.
If function chunks are turning out to be more trouble than they are worth, you can ask IDA not to create function chunks by deselecting the Create function tails loader option when you first load a file into IDA. This option is one of the loader options accessible via Kernel Options (see Chapter 4) in the initial file-load dialog. If you disable function tails, the primary difference that you may notice is that functions that would otherwise have contained tails contain jumps to regions outside the function boundaries. IDA high-lights such jumps using red lines and arrows in the arrow windows on the left side of the disassembly. In the graph view for the corresponding function, the targets of such jumps are not displayed.
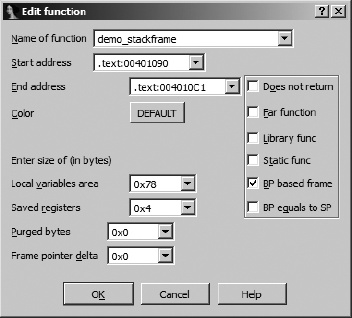
IDA associates a number of attributes with each function that it recognizes. The function properties dialog shown in Figure 7-7 can be used to edit many of these attributes. Each attribute that can be modified is explained here.
- Name of function
An alternative means for changing the name of a function.
- Start address
The address of the first instruction in the function. IDA most often determines this automatically, either during analysis or from the address used during the create function operation.
- End address
The address following the last instruction in the function. Most frequently, this is the address of the location that follows the function’s return instruction. In most cases, this address is determined automatically during the analysis phase or as part of function creation. In cases where IDA has trouble determining the true end of a function, you may need to edit this value manually. Remember, this address is not actually part of the function but follows the last instruction in the function.
- Local variables area
This represents the number of stack bytes dedicated to local variables (see Figure 6-4) for the function. In most cases, this value is computed automatically based on analysis of stack pointer behavior within the function.
- Saved registers
This is the number of bytes used to save registers (see Figure 6-4) on behalf of the caller. IDA considers the saved register region to lie on top of the saved return address and below any local variables associated with the function. Some compilers choose to save registers on top of a function’s local variables. IDA considers the space required to save such registers as belonging to the local variable area rather than a dedicated saved registers area.
- Purged bytes
Purged bytes shows the number of bytes of parameters that a function removes from the stack when it returns to its caller. For
cdeclfunctions, this value is always zero. Forstdcallfunctions, this value represents the amount of space consumed by any parameters that are passed on the stack (see Figure 6-4). In x86 programs, IDA can automatically determine this value when it observes the use of theRET Nvariant of the return instruction.- Frame pointer delta
In some cases, compilers may adjust a function’s frame pointer to point somewhere into the middle of the local variable area rather than at the saved frame pointer at the bottom of the local variable area. This distance from the adjusted frame pointer to the saved frame pointer is termed the frame pointer delta. In most cases any frame pointer delta will be computed automatically when the function is analyzed. Compilers utilize a stack frame delta as a speed optimization. The purpose of the delta is to keep as many stack frame variables as possible within reach of a 1-byte signed offset (−128..+127) from the frame pointer.
Additional attribute checkboxes are available to further characterize the function. As with other fields within the dialog, these checkboxes generally reflect the results of IDA’s automatic analysis. The following attributes can be toggled on and off.
- Does not return
The function does not return to its caller. When such a function is called, IDA does not assume that execution continues following the associated call instruction.
- Far function
Used to mark a function as a far function on segmented architectures. Callers of the function would need to specify both a segment and an offset value when calling the function. The need to use far calls is typically dictated by the memory model in use within a program rather than by the fact that the architecture supports segmentation, for example, the use of the large (as opposed to flat) memory model on an x86.
- Library func
Flags a function as library code. Library code might include support routines included by a compiler or functions that are part of a statically linked library. Marking a function as a library function causes the function to be displayed using the assigned library function coloring to distinguish it from nonlibrary code.
- Static func
Does nothing other than display the static modifier in the function’s attribute list.
- BP based frame
Indicates that the function utilizes a frame pointer. In most cases you determine this automatically by analyzing the function’s prologue. If analysis fails to recognize that a frame pointer is used in the given function, you can manually select this attribute. If you do manually select this attribute, make sure that you adjust the saved register size (usually increased by the size of the saved frame pointer) and local variable size (usually decreased by the size of the saved frame pointer) accordingly. For frame pointer–based frames, memory references that make use of the frame pointer are formatted to make use of symbolic stack variable names rather than numeric offsets. If this attribute is not set, then stack frame references are assumed to be relative to the stack pointer register.
- BP equals to SP
Some functions configure the frame pointer to point to the top of the stack frame (along with the stack pointer) upon entering a function. This attribute should be set in such cases. This is essentially the same as having a frame pointer delta equal in size to the local variable area.
As we mentioned previously, IDA makes every effort to track changes to the stack pointer at each instruction within a function. The accuracy that IDA manages to achieve in doing so significantly impacts the accuracy of the function’s stack frame layout. When IDA is unable to determine whether an instruction alters the stack pointer, you may find that you need to specify a manual stack pointer adjustment.
The most straightforward example of such a case occurs when one function calls another function that makes use of the stdcall calling convention. If the function being called resides in a shared library that IDA does not have knowledge of (IDA ships with knowledge of the signatures and calling conventions of many common library functions), then IDA will be unaware that the function utilizes stdcall and will fail to account for the fact that the stack pointer will have been modified by the called function prior to returning. Thus, IDA will reflect an inaccurate value for the stack pointer for the remainder of the function. The following function call sequence, in which some_imported_func resides in a shared library, demonstrates this problem (note that the stack pointer line part option has been turned on):
.text:004010EB   01C      push     eax
    .text:004010F3   020      push     2
    .text:004010FB   024      push     1
   .text:00401102   028      call    some_imported_func
    .text:00401107   028      mov     ebx, eax
Since some_imported_func uses stdcall, it cleans the three parameters from the stack as it returns, and the correct stack pointer value at ![]() should be
should be 01C. One way to fix this problem is to associate a manual stack adjustment with the instruction at ![]() . Stack adjustments can be added by highlighting the address to which the adjustment applies, selecting Edit ▸ Functions ▸ Change Stack Pointer (hotkey alt-K), and specifying the number of bytes by which the stack pointer changes, in this case 12.
. Stack adjustments can be added by highlighting the address to which the adjustment applies, selecting Edit ▸ Functions ▸ Change Stack Pointer (hotkey alt-K), and specifying the number of bytes by which the stack pointer changes, in this case 12.
While the previous example serves to illustrate a point, there is a better solution to this particular problem. Consider the case in which some_imported_func is called many different times. In that case, we would need to make the stack adjustment we just made at each location from which some_imported_func is called. Clearly this could be very tedious, and we might miss something. The better solution is to educate IDA regarding the behavior of some_imported_func. Because we are dealing with an imported function, when we attempt to navigate to it, we eventually end up at the import table entry for that function, which looks something like the following entry:
.idata:00418078   ; Segment type: Externs
.idata:00418078   ; _idata
.idata:00418078         extrn some_imported_func:dword ; DATA XREF: sub_401034↑r
Even though this is an imported function, IDA allows you to edit one piece of information concerning its behavior: the number of purged bytes associated with the function. By editing this function, you can specify the number of bytes that it clears off the stack when it returns, and IDA will propagate the information that you supply to every location that calls the function, instantly correcting the stack pointer computations at each of those locations.
In order to improve its automated analysis, IDA incorporates advanced techniques that attempt to resolve stack pointer discrepancies by solving a system of linear equations related to the behavior of the stack pointer. As a result, you may not even realize that IDA has no prior knowledge of the details of functions such as some_imported_func. For more information on these techniques, refer to Ilfak’s blog post titled “Simplex method in IDA Pro” at http://hexblog.com/2006/06/.
During the automatic analysis phase, bytes are occasionally categorized incorrectly. Data bytes may be incorrectly classified as code bytes and disassembled into instructions, or code bytes may be incorrectly classified as data bytes and formatted as data values. This happens for many reasons, including the fact that some compilers embed data into the code section of programs or the fact that some code bytes are never directly referenced as code and IDA opts not to disassemble them. Obfuscated programs in particular tend to blur the distinction between code sections and data sections.
Regardless of the reason that you wish to reformat your disassembly, doing so is fairly easy. The first option for reformatting anything is to remove its current formatting (code or data). It is possible to undefine functions, code, or data by right-clicking the item that you wish to undefine and selecting Undefine (also Edit ▸ Undefine or hotkey U) from the resulting context-sensitive menu. Undefining an item causes the underlying bytes to be reformatted as a list of raw byte values. Large regions can be undefined by using a click-and-drag operation to select a range of addresses prior to performing the undefine operation. As an example, consider the simple function listing that follows:
.text:004013E0 sub_4013E0      proc near
.text:004013E0                 push    ebp
.text:004013E1                 mov     ebp, esp
.text:004013E3                 pop     ebp
.text:004013E4                 retn
.text:004013E4 sub_4013E0      endp
Undefining this function would yield the series of uncategorized bytes shown here, which we could choose to reformat in virtually any manner:
.text:004013E0 unk_4013E0      db  55h ; U
.text:004013E1                 db  89h ; ë
.text:004013E2                 db 0E5h ; s
.text:004013E3                 db  5Dh ; ]
.text:004013E4                 db 0C3h ; +
To disassemble a sequence of undefined bytes, right-click the first byte to be disassembled and select Code (also Edit ▸ Code or hotkey C). This causes IDA to disassemble all bytes until it encounters a defined item or an illegal instruction. Large regions can be converted to code by using a click-and-drag operation to select a range of addresses prior to performing the code-conversion operation.
The complementary operation of converting code to data is a little more complex. First, it is not possible to convert code to data using the context menu. Available alternatives include Edit ▸ Data and the D hotkey. Bulk conversions of instructions to data are easiest to accomplish by first undefining all of the instructions that you wish to convert to data and then formatting the data appropriately. Basic data formatting is discussed in the following section.