
In a Bloomberg Television interview about a year and a half after the 2008 financial crisis, previous Fed chairman Alan Greenspan said, “Everybody missed it—academia, the Federal Reserve, all regulators.” In this same interview, he dismissed the notion that the Fed fueled the housing bubble with its loose monetary policy. To rescue the economy from the ensuing Great Recession, and the deep and persistent recessionary gap shown in Figure 2.7a, unprecedented actions were taken. The Fed’s monetary policy and the fiscal policy enacted by the Bush administration—and continued by the Obama administration—pushed the budget deficit, in per capita terms, to levels that were more than twice that of the previous record, quadrupled the Fed’s balance sheet,1 and resulted in excess reserves exploding from its precrisis level of about 50 billion dollars to trillions of dollars. Rather than putting a dent in the deep recessionary gap the economy is presently stuck in, record fiscal and monetary stimulus appears to be reflating asset bubbles (Keenan 2013; Ro 2013). Despite all of that, most economists in the 2012 National Association for Business Economics policy survey said that they wanted fiscal or monetary policy to continue.2 A year later, economists in that same survey indicated that monetary policy was about right.3 Thus, it appears that little has been learned from excessive government meddling in markets.
The problem arises from how mainstream economic theory is being and has been applied. Although monetarism and supply-side economics are politically lumped with the Austrian school, given the way in which these schools of thought have been applied, grouping them with the Keynesian school is perhaps more appropriate. Consider Milton Friedman’s monetarist view that calls for slow and predictable money growth (Willoughby 2013).Compared to interest-rate targeting, his monetary rule is welcomed by classicalists because it ignores short-run variations in gross domestic product (GDP) and lessens economic uncertainty, which improves the economy’s long-run growth path. Although Austrian economists consider this to be the lesser of the two evils, they view his acknowledgment that the Fed is here to stay as an endorsement of sorts. This has contributed to the overwhelming support the Fed receives from policy makers, politicians, journalists, and economists. With its detractors sidelined, the Fed wields much power and influence over economic matters. Since it is not bound by Freidman’s monetary rule, the Fed has chosen to target interest rates to manage short-run output gaps rather than toe Friedman’s line. In this light, it is not surprising that Austrian economists view Friedman as the guy who put the kids in charge of the candy store (Rothbard 2002). Thus, monetarism, in practice, is more Keynesian than classical. The same can be said of supply-side economics because Congress cannot bind future Congresses to low permanent tax rates it enacts.
Unlike many mainstream economists who are prescribing the same policies that created the housing bubble that triggered the subsequent financial crisis, the Austrian prescription is to repeal the string of government interventions that led to both. In The Road to Serfdom, Hayek points out that the unintended consequences of a government intervention are addressed with additional interventions. Because these have unintended consequences, the adoption of interventions in the form of federal regulations becomes a never-ending cycle. Figure 7.1 shows the number of regulations, as measured by the number of pages in the Federal Register,4 with long-run economic growth.5 Although the figure shows the number of pages peaking at around 87,000 pages in 1980, the number of pages has generally increased as long-run economic growth has declined.
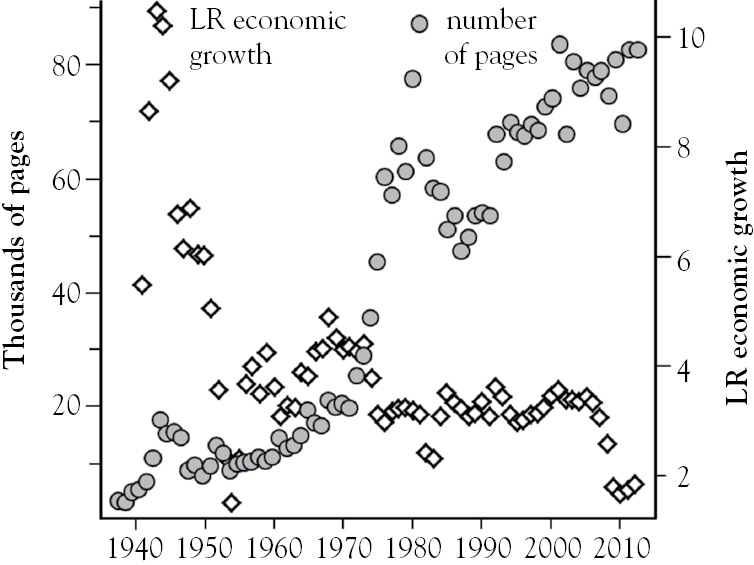
Figure 7.1 Number of pages in the federal register and long run economic growth
The Austrian prescription is not popular because it involves repealing institutions and regulations that most believe are necessary. The most notable are the legislation and regulations that keep the Fed and fractional reserve banking in place. Fractional reserve banking works well as long as depositors do not drain their checking accounts. The money that is lent into existence, which is made possible by the required reserves ratio permitting banks to lend out up to 90 percent of their customers’ demand deposits, can vanish at a moment’s notice. The bank panic sparked by the collapse of Lehman Brothers put the federal funds market in emergency mode. This resulted in a shortage of reserves that had to be filled with discount loans, which increased by nearly 578 percent in the weeks following Lehman’s demise.
Prior to Lehman’s collapse, the Fed’s policies of artificially low interest rates and relaxed credit standards set the stage for the housing bubble. Rather than expanding or opening up businesses, Americans used leverage to speculate in housing markets. Leverage works as long as home values appreciate. Consider a home that is purchased for $200,000 today and sold for $220,000 a year later. If the purchase is not financed, a cash sale yields an investor a 10 percent return. If the home purchase is financed at 5 percent, the yield is 42 percent with 20 percent down or 168 percent if leveraged with 1 percent down. The widespread use of leverage drove home demand ever higher, which created supply. As home prices crest, yields on heavily leveraged homes decline to zero. When prices start declining, the yields on leveraged properties are negative, and the more leverage that is used, the more negative the yield.
Following the recommendations of mainstream economics keeps in place the policies that led to the financial crisis. This is precisely why the U.S. financial system needs federal deposit insurance, the Fed to be the lender of last resort, the too-big-to-fail doctrine, and mortgages securitized by Fannie Mae and Freddie Mac. The problem with these safeguards, however, is that lenders are more likely to make risky loans when others, taxpayers in this case, incur the cost of failed mortgages. The moral hazard these interventions create encourages banks to play faster and looser with depositors’ money than what would have been the case otherwise. For example, small local credit unions are hesitant to make 30-year fixed rate mortgages when interest rates are at historic lows because (a) they know interest rates will be higher in the future and (b) they understand that they are too small to be bailed out. When future interest rates rise above the rate on 30-year fixed-rate mortgages made today, credit unions that made too many of these loans will go broke.
Since the Fed has set interest rates lower than they were before the housing bubble popped, large national banks continue to make 30-year mortgages, and near-zero down-payment mortgages are being backed by the Federal Housing Administration, it appears that little has been learned from the 2008 financial crisis.
Repealing all federal banking regulations and backstops would transform our factional reserve banking system into a free-banking system. Under such a system, banks would have to be very good stewards of their customers’ deposits. Without government backstops, bankers would know that their banks will go under if they play too fast and loose with their customers’ money. Hence, banks are held accountable by their desire to maintain a trustworthy reputation, and their officers are held accountable by the least merciful of all regulators, depositors who love their money. Perhaps this is why credit unions and Midwestern banks were able to weather the financial crisis, and continue to be cautious today.6 In a free banking system, deposits are considered the property of depositors. Without government backstops and bailouts, banks would be reluctant to borrow short from demand deposits to lend long to home buyers. Instead, banks would have to borrow long to make mortgages. To do this, they would need to raise the interest paid on time deposit just enough to get its customers to move monies from demand deposits to time deposits.
Although Greenspan said all regulators and everybody at the Fed and in academia failed to predict the housing bubble and the financial crisis, this is not so according to Axel Leijonhufvud. In 2008 he wrote, “Operating an interest-targeting regime keying on the CPI, the Fed was lured into keeping interest rates far too low far too long. The result was inflation of asset prices combined with a general deterioration of credit … a variation on the Austrian overinvestment theme.”7 Randal Forsyth concurred, “The Austrians were the ones who could see the seeds of collapse in the successive credit booms, aided and abetted by Fed policies.”8 How is it that the Austrian school foresaw the coming financial crisis but mainstream economics did not? To answer this, one must gain a better understanding of Austrian Macroeconomics, which Garrison (2001) refers to as Capital Based Macroeconomics (CBM).
A major difference between the two views on macroeconomics is the treatment of capital. Capital is aggregated into variable K in mainstream macroeconomics but is divided across stages of production in CBM. For simplicity, capital is divided into three stages of production here. Capital goods produced in the first stage, like rubber and steel, are high-order goods. Capital goods like tires and engines are medium-order goods that are produced in the second stage of production. Final goods like cars and pickups are low-order goods and are produced in the final stage of production. K1, K2, and K3 are the values of physical capital at each stage of production, I1 and I2 are the values of business expenditures on goods produced in the first and second stages of production, while C is the value of consumer expenditures on low-order goods produced in the final stage. High-order goods were committed to the production of medium-order goods two periods ago, and medium-order goods were committed to the production of consumer goods one period ago. This intertemporal allocation of resources in CBM is a more realistic representation of production than what is assumed in mainstream macroeconomics. Figure 7.2a shows three stages of production forming a Hayekian triangle.9 It gets taller from left to right because high-order goods derive their value from being inputs to the production of medium-order goods, which derive their value from being inputs to the production of consumer goods.
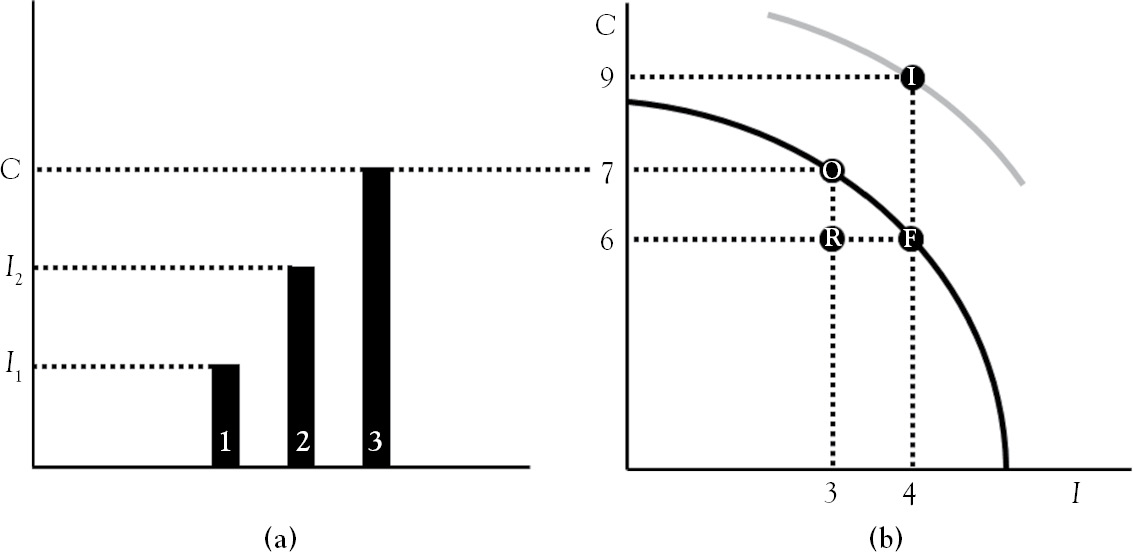
Figure 7.2 The Hayekian triangle and the economy’s PPF
Another major difference between the macroeconomic views is the treatment of consumption and investment. The two are assumed to rise and fall together in mainstream macroeconomics but are considered trade-offs in CBM. Figure 7.2b models this trade-off using a production possibilities frontier (PPF). Along the PPF, the economy is at full employment (points O and F). The economy is in an inflationary gap beyond the PPF (point I) and in a recessionary gap inside it (point R). If the economy depicted in Figure 7.2 is presently at point O, consumption equals 7 trillion dollars, real GDP equals its potential, and unemployment is equal to its natural rate. Also, I2 and I1 sum up to 3 trillion dollars, which represents gross investment. Gross investment is the sum of replacement capital and net investment. If the economy is at point O with net investment equal to $0, the PPF does not shift. If consumers decide to save 1 trillion dollars by reducing their expenditures by the same amount, the economy moves to point F. The increase in savings raises net investment from 0 to 1 trillion dollars over the period. This shifts the PPF to the gray curve, resulting in ultimately higher overall consumption and investment next period. If net investment was 0.5 trillion dollars at point O, it increases to 1.5 trillion dollars when the economy moves to point F as savings increase by 1 trillion dollars. The long-run effect of increased savings in this situation pushes the PPF beyond the gray curve in Figure 7.2b. Thus, increased savings accelerates economic growth, which contradicts Keynes’s paradox of thrift.10
The loanable funds market, the third component of CBM, is helpful in understanding why the paradox of thrift does not hold. If consumers become more forwardlooking, they become thriftier. This increases the supply of loanable funds from the black line to the gray line in Figure 7.3d. At the moment this happens, the nominal interest rate has yet to change. This results in an excess supply of loanable funds, which would be represented by a horizontal line segment from point O to the gray line, if shown in the figure. The excess supply, however, creates competition among savers, who bid down the nominal interest rate from 4 to 3 percent. When the market clears at 3 percent, both investment and savings rise from their initial levels. If output and factor markets are allowed to clear, the economy will remain on its PPF and move from point O to point F in Figure 7.3b.
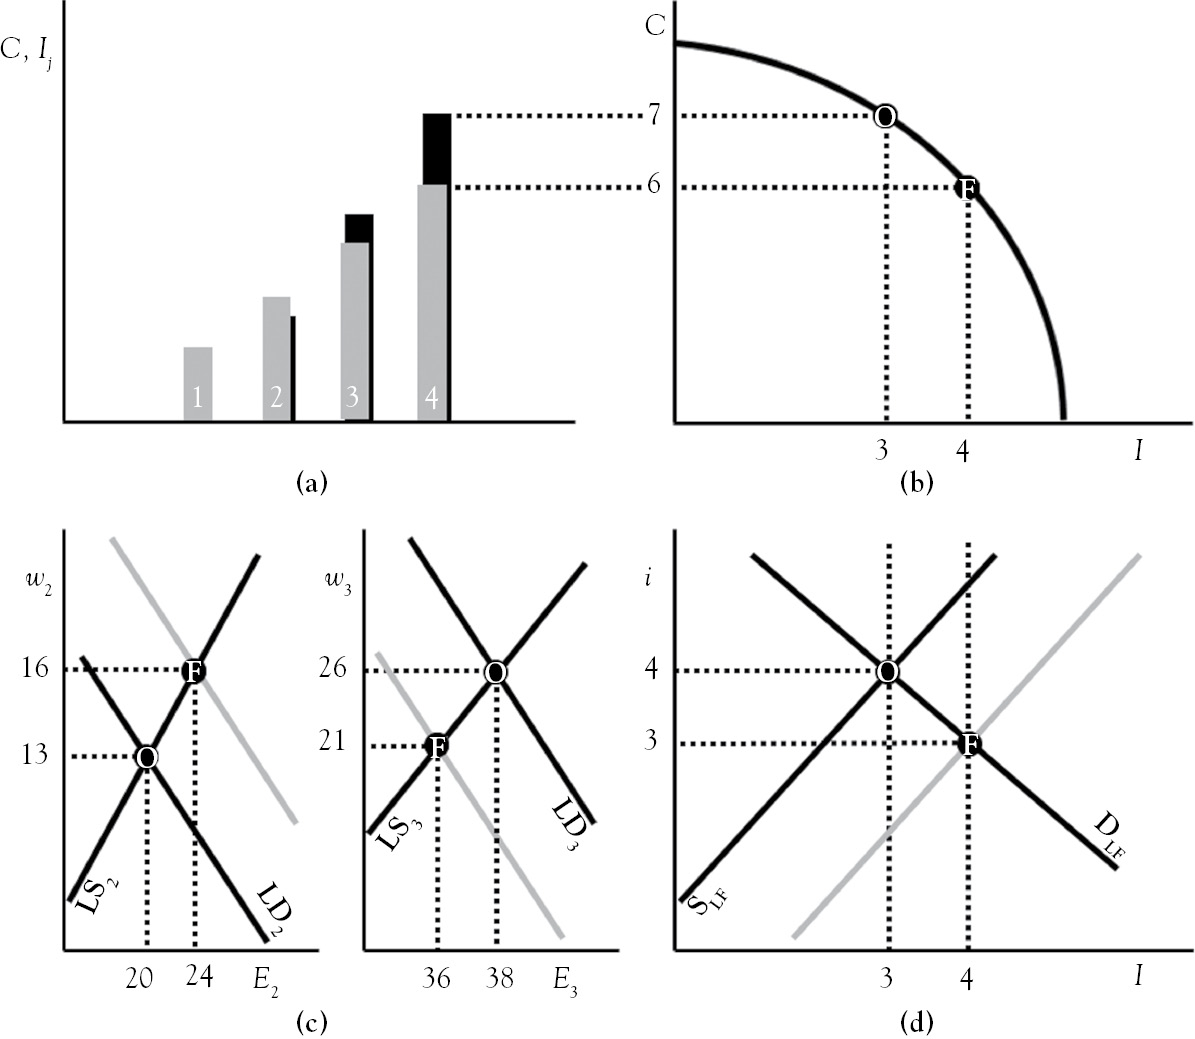
Figure 7.3 Integrated effects of increased thriftiness in CBM
The decline in consumer expenditures flattens the Hayekian triangle in Figure 7.3a. This is called the derived demand effect because the decline in the demand for consumer goods reduces investment activities in the second-to-last stage of production. The decline in this stage’s investment expenditure is modeled by the second tallest black bar in the Hayekian triangle shrinking to the second tallest gray bar. In time period 2, the economy has added a stage of production where the third stage has become the fourth, the second has become the third, and so on. The widening of the triangle is called the time-discount effect because the nominal interest rate falling to 3 percent causes investment activities in early stages of production to increase. The change in the shape of the triangle models the reallocation of capital from the last stage (e.g., retail inventories) to earlier stages (e.g., product development).
The final innovative feature of CBM is the disaggregation of stage-specific labor markets. Figure 7.3c shows the labor markets for the second and third stages of production. The decline in third-stage investment causes labor demand in that stage to fall, which results in lower wages and less employment. Just the opposite is true in the second stage. Greater investment in this stage increases labor demand, resulting in greater employment and higher wages. This is an important result because mainstream macroeconomics operates under the assumption that all markets are in recession when the economy sinks into a recessionary gap. In reality, some labor and product markets expand while others contract when economic output shrinks. During the second time period, some of the two million workers that lost jobs in the third stage of production migrate to the second stage of production. This reduces third-stage labor supply (not shown in Figure 7.3c) and increases second-stage labor supply (not shown in Figure 7.3c), which equalizes wage rates across the two stages of production. Because four million jobs are added in the second stage and two million are lost in the third stage, third-stage output falls as second stage output increases.
By the start of period 3, capital restructuring is complete and saving-induced investments have worked their way through the economy. The restructuring results in the economy adding a fifth stage of production in Figure 7.4a and the PPF shifting out to point E in Figure 7.4b. At this point, consumption expenditure is greater than it was in the first period. Thus, forgoing consumption in period 1 pays dividends in the third period. However, this is only possible if markets are allowed to work. Market interventions like social security, unemployment insurance, minimum wage laws, welfare and SNAP benefits, and interest rate setting reduce consumer saving, and make wages, prices, and interest rates sticky. In the presence of these market interventions, short-run aggregate supply is unable to self-correct in a recessionary gap, and unemployment remains high for a prolonged period of time. Hence, the unintended consequences of these government interventions require additional interventions, the fiscal and monetary stimulus that is enacted during recessions.
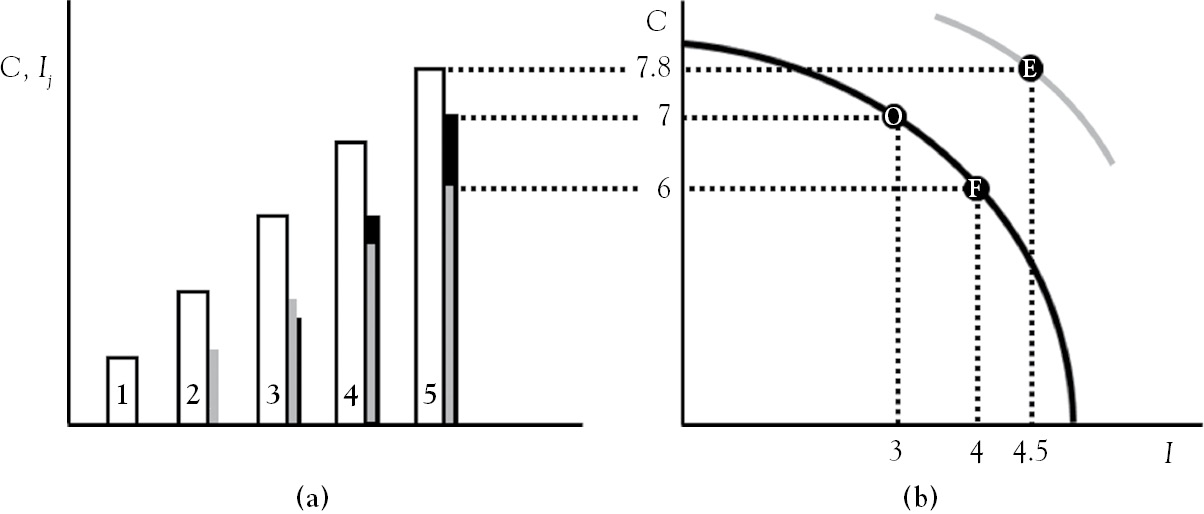
Figure 7.4 The long run effects of increased thriftiness in CBM
Figure 7.5 illustrates the effect of a rapid expansion of credit by the Fed after it injects a large amount of reserves into the banking system via open market purchases of Treasuries. Through multiple deposit creation, the additional reserves are multiplied into new money. This shifts the supply of loanable funds to the gray line in Figure 7.5c, which causes the nominal rate of interest to fall to 3 percent. As a result, savings is 2 trillion dollars less than investment, which has increased to 4 trillion dollars. Thus, expansionary monetary policy drives a wedge, triangle OCI in Figure 7.5c, between investors and savers. At the lower rate of interest, the difference in investment (4 trillion dollars at point I) and savings (the 2-trillion-dollar decline in consumption from point I to point C) equals the amount of new money that was lent into existence. The expansionary monetary policy increases consumption expenditures and investment expenditure to point B in Figure 7.5b. In the Austrian school, this is the boom in the boom-and-bust cycle.
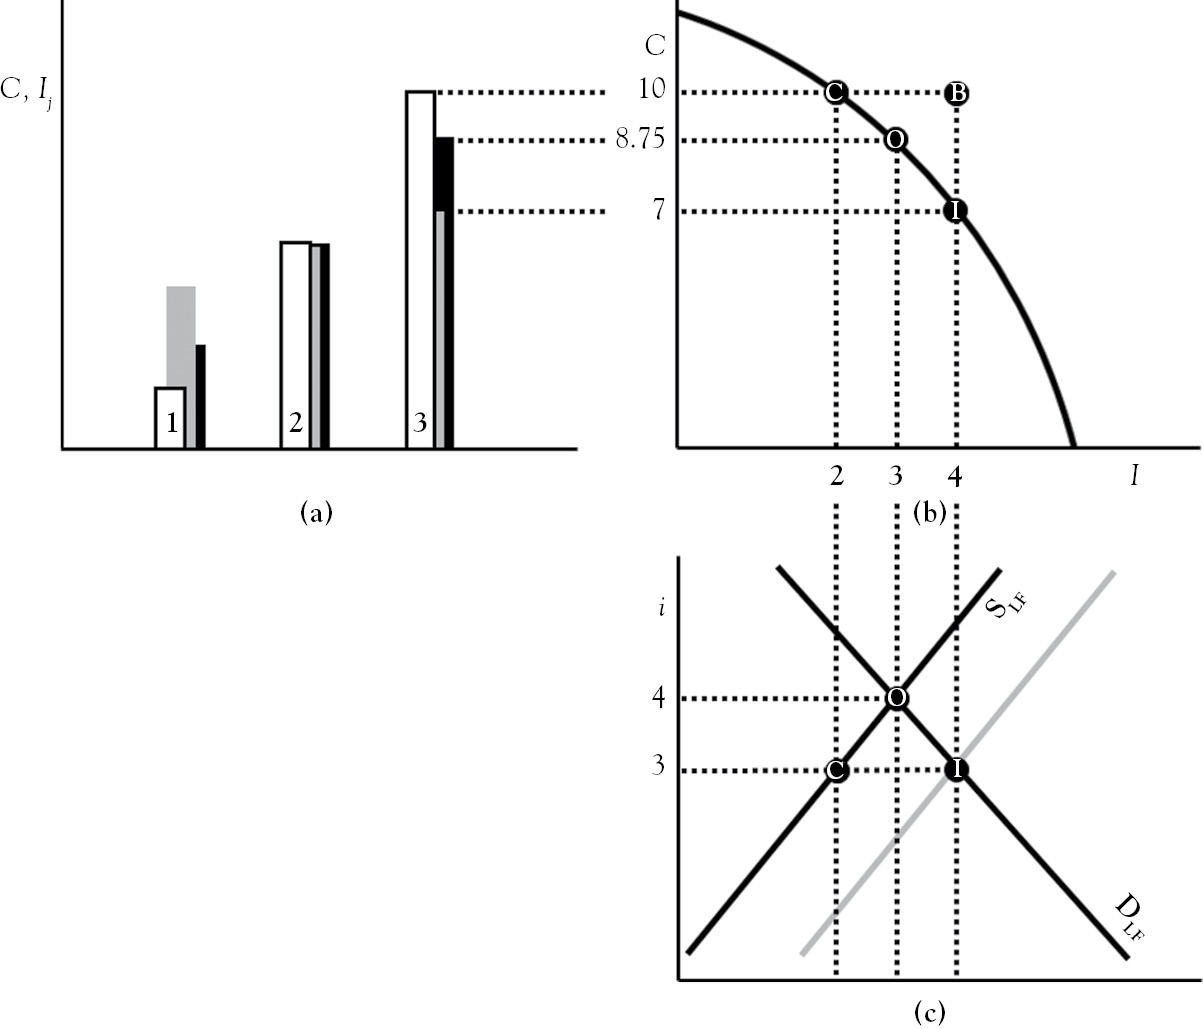
Figure 7.5 The effects of monetary intervention in CBM
The boom is unsustainable. If the economy was at point I instead of point B, capital would have been restructured. Investments would have been redirected from late to early stages of production. This is represented in Figure 7.5a by the Hayekian triangle shifting from the initial black bars to the gray bars. If, on the other hand, the economy was at C instead of B, capital would have been restructured differently. Investments would have been redirected from early to late stages of production, which represents the Hayekian triangle shifting from black to white bars. Because the economy is at point B, investment activities in the first and third stages both increase. The difference in the height of the white bar (10 trillion dollars) and the black bar (8.75 trillion dollars) in the third stage of production is overconsumption, while the difference in the height of the gray and black bars in the first stage represents malinvestment. With relaxed credit standards and low interest rates, consumers and the firms that operate in the first stage of production use leverage to compete for the economy’s limited resources. Overconsumption and malinvestment push asset prices higher. As asset bubbles inflate, yields and inflation expectations rise. To dampen inflation expectations, the Fed withdraws stimulus. As soon as asset prices fall, yields on heavily leveraged asset purchases go negative, investors and consumers are underwater on their loans, asset bubbles pop, and the boom becomes the bust.
The unintended consequence of fiscal and monetary policy, according to Austrian Business Cycle, drives the cycle of the boom and bust.
So, who should we trust?
1 The Fed’s balance sheet has grown from $869 billion on August 8, 2007, to $3470 billion on June 10, 2013. See www.federalreserve.gov/monetarypolicy/bst_recenttrends.htm
4 Office of the Federal Register, Federal Register & CFR Publications Statistics. (https://www.federalregister.gov/uploads/2014/04/OFR-STATISTICS-CHARTS-ALL1-1-1-2013.pdf)
5 Here, long-run economic growth is the 10-year running average of annual real GDP growth.
6 See Kansas City Federal Reserve President Thomas Hoenig’s August 23, 2010, testimony to the House subcommittee hearing, “Too Big to Fail: Learning from Midwest Banks and Credit Unions.”
7 See Leijonhufvud (2008).
8 See Forsyth (2009).
9 See Figure 1 on page 39 of F. A. Hayek (1935) Prices and Production (1935, p. 39).
10 “Thrift may be the handmaiden of Enterprise. But equally she may not. And, perhaps, even usually she is not.” (Keynes 1930).