
The response times in your solutions can make a big difference to the usability of the application. This section provides information on how to monitor and manage response times in Lightning and Visualforce.
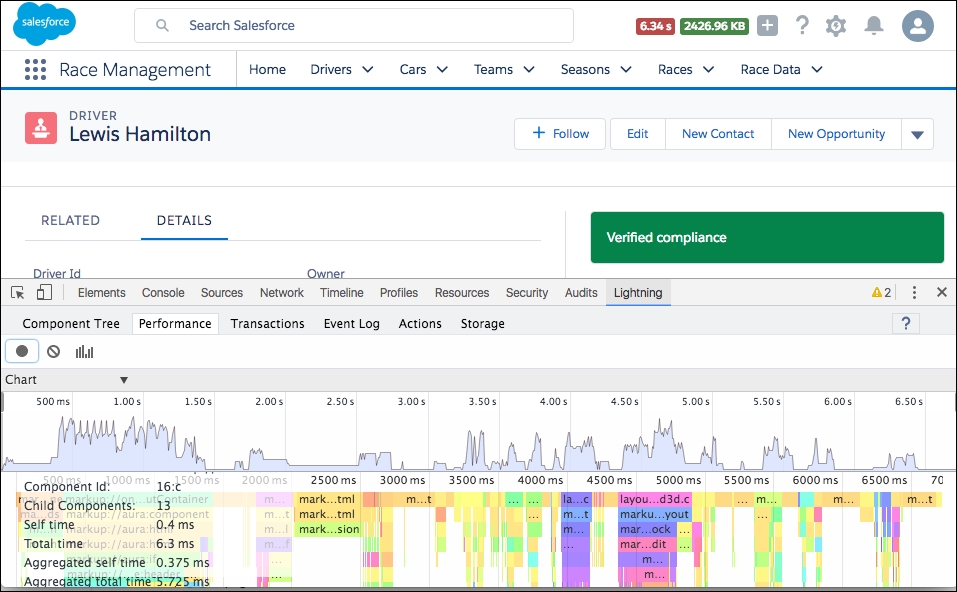
In Lightning, it is important to monitor the complexity of your component hierarchy. While it is good to componentized for reasons of separation of concerns, too much of it can result in a heavy component tree, and result in poor performance. Salesforce provides an excellent tool known as Lightning Inspector, which provides insight into your component hierarchy and the rendering times each component takes. You can download and install this from the Google Chrome Web store.
The following shows an example screenshot for the FormulaForce application:
You may also have noticed that LEX displays page size and response time in the header:

Visualforce Developer's Guide has a section within it entitled Best Practices for Improving Visualforce Performance, in which it outlines some excellent ways to ensure that your pages remain responsive. I highly recommend that you take the time to read through it. There is, however, one point in that topic that I want to elaborate further on in this section:
"If your view state is affected by a large component tree, try reducing the number of components your page depends on."
This symptom can result in poor response times, even for pages that are properly optimized in all other regards described in the documentation. The cause stems from the internal overhead of the Salesforce Visualforce components, known as internal view state, which increases when you have many such components on the page, typically in tabular or apex:repeat scenarios.
Depending on your Visualforce page design, it can often represent proportionally more than the data the developer explicitly places in the view state through controller properties and member variables. Together, they both contribute to reaching the 145 KB limit on view state size, though before this is reached larger view states can effect response times.
Here are a few considerations when designing Visualforce pages utilizing tables or repeated sections that contain the native Visualforce components:
- View state is only generated if you have a
apex:formtag on the page; if you don't need one, then you should remove it, for example in view only pages. - Consider if you need to use Visualforce components such as
apex:outputFieldor if using HTML elements directly with a Visualforce expression would suffice. HTML elements consume no viewstate. However be careful to consider localization features the standard components provide when doing this, such as formatting dates and numbers; you might need to perform this in the Apex code and bind to the formatted values. - Avoid nested
apex:repeattags that contain Visualforce components. If possible, flatten a nested structure with the Apex logic in your controller and expose a single iterable list property that results in the same output. - Consider moving to a stateless controller mode as described in the following section.
- Consider implementing pagination in your page.
Tip
For a further analysis, search http://salesforce.stackexchange.com/ for 'How to reduce a large internal view state / what is in the internal view state?