
Highlight tables represent tabular information in a color-coded grid. The background color of the individual cells corresponds to the relative magnitude of the value it represents. Highlight tables are great when displaying the actual numeric values are important, but you also want the visual emphasis by adding the background colors on the cells.
In this recipe, we will modify the text table created in the Creating a text table (crosstab) recipe to create a text table with colored background, based on a film's worldwide gross amount:

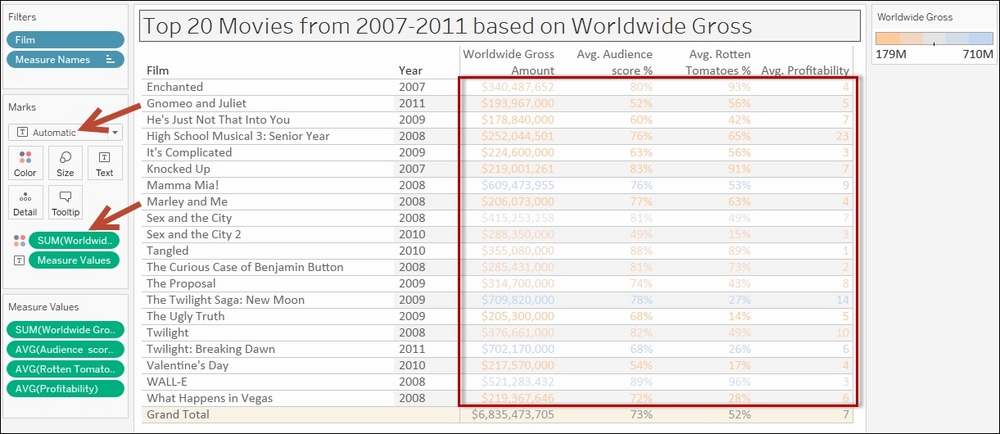
To follow this recipe, open B05527_01 – STARTER.twbx. Use the worksheet called Highlight Table, and connect to the HollywoodMostProfitableStories data source.

In addition, this recipe requires the text table in the Creating a text table (Crosstab) recipe to be created. This text table is the starting point of this recipe.
The following are the steps to creating a highlight table:
- If you haven't already done so, follow the steps in the recipe Creating a text table (crosstab) to create the starting text table.
- From Measures, drag Worldwide Gross Amount to Color in the Marks card.
- Change the mark in the Marks card to Square.
- Click on the drop-down arrow beside the color legend and choose Edit colors….
- Choose the Orange-Blue Light Diverging palette. Select the Stepped Color, and specify
5steps.
- Click on the drop-down arrow beside the color legend and choose Edit title….
- Edit the title of the color legend to display Worldwide Gross.
You might like the heat map because it emphasizes the items that have the darkest or lightest colors, but don't like the fact that it doesn't have the numbers.

You might like text tables, but it requires that you look at the numbers closely and focus before you can make sense of it.

You're in luck, you can create a hybrid table. You can have the text table, and color the grids according to your selected measure. This hybrid table is called the highlight table.
There is a trick to creating highlight tables in Tableau. The first is to create a text table. See the Creating a text table recipe in this chapter for the steps. Once you have the text table, you can drop a measure onto Colors in the Marks card. This colors your text table with a gradient of colors, which honestly will make your text table very hard to read.
Once your table already has the gradient-colored text, the final step is to change the mark to a Square. This is the magic sauce that creates your highlight table.