
A reference band creates a banded or shaded area in a chart, and can show if other points fall within a range or interest or not.
In this recipe, will highlight the time range when water quality complaints are filed using a reference band:

To follow this recipe, open B05527_06 – STARTER.twbx. Use the worksheet called Reference Band and connect to the NYC Water Quality Complaints data source:

The following are the steps to create the time series graph with reference band in this recipe:
- From Dimensions, right-click and drag Created Date DT to Columns and select Discrete Hour:
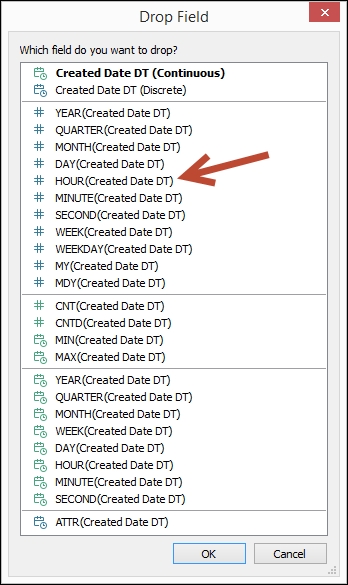
- Right-click on the HOUR(Created Date DT) field in Columns and select Continuous.
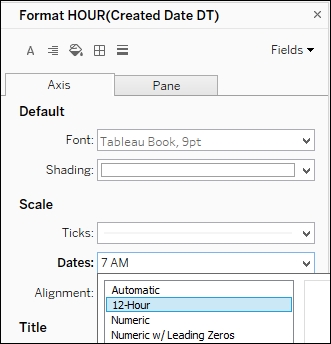
- Right-click on the HOUR(Created Date DT) field in Columns, and select Format. On the side bar, under Scale, choose 12-Hour format for Dates:
- Right-click on the Created Date DT axis to edit axis. Change the axis title to # Complaints.
- From Measures, drag Number of Records to Rows.
- Edit the Number of Records axis and change the axis title to Complaint Time.
- From Dimensions, drag Descriptor (group) to Color in the Marks card.
- On the side bar, click on the Analytics tab to activate it.
- Under Custom, drag Reference Band from the Analytics tab and drop it onto Table in the HOUR(Created Date DT) placeholder:

- In the Edit Reference Line, Band, or Box window, use the following settings:
- Scope is Entire Table
- Band From Value is From Time
- Band From Label is Custom, and type in 8 AM
- Band To Value is To Time
- Band To Label is Custom, and type in
5 PM:

- Click OK when done.
- Right-click on the Reference Band and select Format.
- Set the Alignment for the Reference Line Label to top.
A reference band is essentially two reference lines where the range between the lines are typically shaded. Reference bands help draw the eyes to the range that may be important to highlight or emphasize.
In Tableau, we can drag Reference Band from the Analytics pane and drop it onto our view. If we have different groups in the view, we will be presented with the scope options Tableau, Pane, and Cell. If there is more than one axis, we also have the option of creating the band on one of the axes or both.
With a reference band, we need to supply the range – the Band From and the Band To value. Before we can select this in the Edit Reference Line, Band, or Box window, we need to make sure the fields for the boundary values are already in the view. If it is not yet there, and it does not need to be placed in a way that affects the overall view, we can place these fields in the Details property in the Marks card.
For a reference band, we typically also need to change the fill so that the range between the values are shaded.