
In this recipe, we will combine the fields in two different Excel worksheets into one:

To follow this recipe, download this chapter's files from the Packt website and use the file called Worlds Busiest Airports—Join.xls.
Here are the steps to combine the fields from the two worksheets:
- Connect to the Excel file in this recipe. Make sure you choose Excel from the To a File section:

- Drag Busiest Airports 2015 from the sheets section to the data connection window:

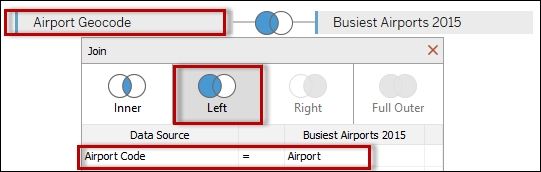
- Drag Airport Geocode to the right of Busiest Airports 2015 in the data connection window.
- In the Join window that comes up, choose Airport from Busiest Airports 2015 to match up to the Airport Code field from the Airport Geocode sheet:

- Add a new sheet and create your visualization using this data set.
A join is primarily a relational database concept that allows you to combine records from different tables using common fields. When data sets are joined, all fields are combined based on the join conditions provided.
In Tableau, joins can be done on file-based data sources as well. For Excel files, each tab or worksheet in an Excel file acts like a table with records. If your data source is text files, each file in a folder is considered a table.
In our recipe, we combined two worksheets from the same Excel workbook. Records in both worksheets will be combined only if the Airport field from Busiest Airports 2015 has the same value as the Airport Code field in the Airport Geocode worksheet. This join, based on the equality of values, is also called an equi-join:

Once the fields are joined, you will find the fields from both worksheets represented in the side bar. Fields are grouped based on their source:

In general, we have two types of join: inner and outer joins.
Inner joins find matching values from both tables based on the join condition. The join condition is not always based on equality. There are cases where you may use other operators such as greater than (>), greater than or equal to (>=), less than (<), less than or equal to (<=) or even not equal to (<>). Depending on the data source, some of these operators may not be supported.
Outer joins, also called preserving joins, preserve one or both sides of the tables as well as matching records. Outer joins can be further classified as left outer, right outer, and full outer. Some data sources do not support certain types of outer joins. Outer joins are positional; the placement of the tables relative to the JOIN operator affects the results.
A left outer join preserves the table to the left of the join operator and finds the matching values from the table on the right side of the operator. If a record on left table being preserved does not have a matching value in the right table, that record is preserved but the fields from the other table will show NULL. A NULL value means the absence of value.
Here is an example of a LEFT OUTER JOIN using our worksheet in this recipe. The records in the table to the left, Busiest Airports 2015, is matched up to the records to the right, Airport Geocode, based on Airport and Airport Code fields respectively:

Busiest Airports 2015 has a record for Airport value CDG, but this Airport Code does not exist in the Airport Geocode worksheet. Hence, as can be seen in the following screenshot, the corresponding Airport Geocode fields are reporting Null for the CDG airport:

A right outer join is the reverse; it preserves the records from the right table and finds matching values from the left table. Right outer joins are not natively supported in Excel data sources. However, we could simply switch the data sources—putting Airport Geocode to the left and Busiest Airports 2015 to the right—to achieve the same desired result:
Airport Geocode has a record for DFW, but the Busiest Airports 2015 worksheet does not have this. The resulting records will report Null for the Busiest Airports 2015 columns for the DFW record:

A full outer join preserves both tables being operated on. If the data source driver does not support this, a full outer join result can be derived by getting the result of the left outer join and appending it to the result of the right outer join.
There are a few other types of join—a self-join and a cross join. A self-join simply means that the same table is joined to itself. The actual join type can be inner or outer or even cross join. A cross join gets the cartesian product of the records in the tables being cross joined. When we get a cartesian product, we match up the records from one table to all records in the other table. If we have m of records in one table and n of records in another table, after a cartesian product we will end up with mxn records.
In our recipe, once we have combined the fields, we can start visualizing our records. Here is a possibility—creating a map that depicts the busiest airports and ranks them based on the average number of passengers:

A union is another operation that can be used to combine different data sets. Joins are fundamentally different from a union. In a union, the record sets are stacked on top of each other, thus producing a taller result set. A join works by combining records and fields horizontally based on common fields, thus creating wider data sets that have all the combined fields together. A join also does not require union compatibility.
Before Tableau 10, joins were limited to combining tables from the same data source, that is, the tables need to be using a single data connection. Tableau v10 adds flexibility to the join operation by allowing cross-database joins. Tables are no longer restricted to coming from the same data source.
In the following example, we can see that there are two color-coded connections in the left-hand pane. One is an Excel connection, and the other is a text file connection. In the middle connection window, we can see that the join operation was allowed between the two data sources:
