
Story Points allow us to organize our topics and views into a sequence of points that aid in presenting data. Story Points can leverage any views or dashboards in the workbook and use any of those in each point.
In this recipe, we will explore where fatal floods have happened over time using Tableau's story points.

To follow this recipe, open B05527_04 – STARTER.twbx. We will use the following worksheets:
- Fatalities by Country
- Fatalities by Country Map
- Flood History by Country
We are also going to use the following dashboard which shows Thailand Floods data:

The following are the steps to create the story points in this recipe:
- Create a new story point. You can click on the new Story Point tab, which looks like a book with a plus sign, at the bottom of the canvas.

- Double-click on the title, and change story title to
Fatal Floods over Time. - Click on the Story menu at the top, and select Format.

- Format the story using the following settings:
- Story Shading to gray
- Story Title Font to
22pt bold, Tableau Bold font family, white color - Story Title Shading to black
- Navigator Font to
10pt, Tableau Book font family - Navigator Shading to dark red

- Change the Story size to Automatic.

- Click on New Blank Point to create a new story point.

- Click on New Blank Point to create another point.

- Zoom to where the reddest areas are. You can do this by clicking on the map's view toolbar, and using the magnifying lens to zoom to the area.

- Add mark annotations onto the three countries with the reddest colors—Bangladesh, Burma, and Thailand. Leave the default text on the mark annotations, which should include the country name and the total fatalities for those countries.
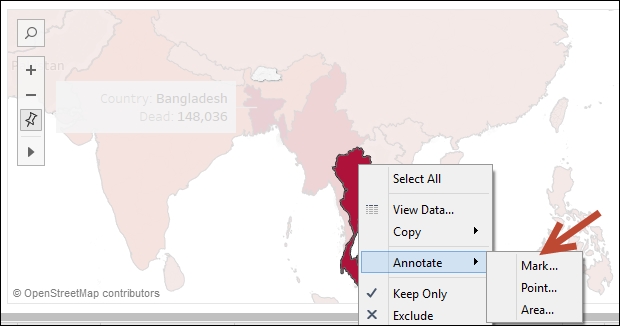
- Right-click on each of the annotation boxes and select Format. Add a thick gray border to each of the annotations.
- Click on Save as a New Point to save this view as a new point.
- Change the text on this new point to
Bangladesh,Burma, andThailand.
- Click on New Blank Point, and change the text to
Thailand Floods. - Drag the Thailand Floods dashboard from the Sheets onto this new story point.

- Click on New Blank Point, and change the text to
Thailand Floods History. - Drag the Flood History by Country worksheet onto the story point.

- Click on the presentation mode, or press F7, and test the story points. You click on the navigator, or simply use the left and right arrows in your keyboard to move through the points.
Story points help you organize your points and thoughts for a presentation. You may have done this in the past using different software applications. This, however, would have required you to export the worksheets and dashboards as images so they can be embedded into the presentation application. This does limit the interactivity, and you really lose the advantages that Tableau brings to the table.
Tableau is largely an interactive tool, and allows for the exploration of information. As you select, you may see other views get filtered. As you hover, you may get highlights. Story points allow you to present, as well as retain, the interactive components of Tableau. It provides a seamless flow of discussion and analysis.
If you need to incorporate images and custom text, you will need to create a dashboard first with those objects and then use them in the story points.
What is presented in this recipe is just a starting point. Story points are completely dependent on your data story, your goal, and your audience. Although the formatting options for story points are fairly limited, you can still create very organized, interactive, and compelling presentations using Tableau's story points.