
In this recipe, we will walk through the strategy to display and sort measures based on user selection.

To follow this recipe, open B05527_03 – STARTER.twbx. Use the worksheet called Dynamic Measure Display and Sort, and connect to the MasterTable (FlooddataMastListrev) data source.

The following are the steps to create a chart that enables displaying and sorting measures through a parameter:
- Right-click the arrow beside the Dimensions section in the side bar, and select Create Parameter.
- Create a string parameter called Sort by with the following settings:

- Show the parameter control for Sort by. You can do this by right-clicking on the parameter, and selecting Show Parameter Control.
- Create another parameter called
Sort directionwith the following settings:
- Show the Sort direction parameter control.
- Create a calculated field called
Chosen Sort bywith the following formula: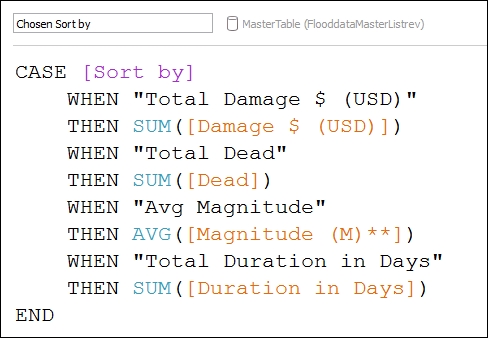
- Create another calculated field called
Chosen Sort by with direction, which takes into account the selected direction.
- From Measures, drag the calculated field Chosen sort by to the Columns shelf.
- From Dimensions, drag Country to the Rows shelf.
- Right-click on the Country pill in the Rows shelf, and select Sort.
- Sort the Country based on the calculated field Chosen sort by with direction in Ascending order.
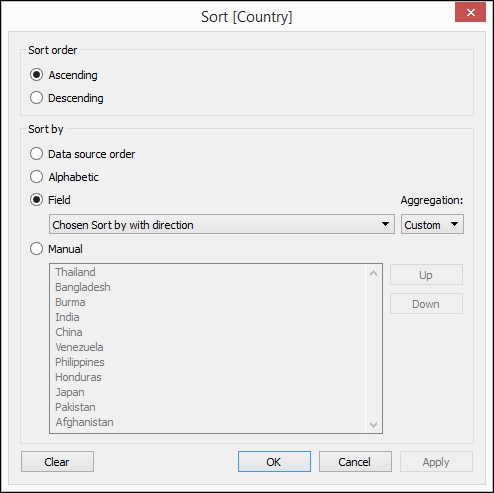
- Click OK when done.
- From Measures, drag Chosen sort by to the Filters shelf.
- Choose Special, and select Non-null values.

- From Dimensions, drag Country to the Filters card.
- Under the General tab, check the Exclude option, and select Null. Notice that selecting something when the Exclude option is checked adds a strikethrough to the selected item, meaning that item will be excluded.

- Click OK when done.
- Test the parameters. Ensure that as you change the parameter selection, the measures and the sorting change accordingly.
In this recipe, we put the end users in the driver's seat and let them change the measures being displayed as they require, as well as how the measures are sorted.
Normally we place the measures we want to display in the shelves or cards. However, to allow end users to change this on demand, we must first enable them to specify their choice through a parameter. In our recipe, we called this parameter Sort by. This parameter is used in a calculated field that determines the actual measure to be used in the visualization, as well as the appropriate aggregation function:

In addition to this, we also created another parameter called Sort direction. The Sort direction parameter is used in a calculated field called Chosen Sort by with direction that either keeps the value of the calculated field Chosen Sort by as is if ascending, or reverses it by multiplying it by -1 if descending.

This calculated field is to be used with the sort direction for the Country dimension.
When the parameter choices change, the respective calculated fields will trigger the change in the chart, and show the appropriate measure and sort direction.

