
While Tableau can map most geographic locations, you may still encounter locations that are unrecognizable in Tableau, and therefore do not show up on your map. It is still possible to visualize this. One way to make this happen is by importing your location information along with its latitude and longitude coordinates into Tableau.
In this recipe, we will import custom geocoding to visualize where the busiest airports were in 2015:

To follow this recipe, open B05527_05 – STARTER.twbx. Use the worksheet called Import Geocoding, and connect to the Busiest Airports data source:
In addition, take the file called Busiest Airports.csv that comes with the downloadable files for this chapter and place it in a local folder by itself:

Alternatively, you could get the data from the original source, www.world-airport-codes.com, and save it into a csv (comma separated value) file.
This is what the file contents look like:

Here are the steps to import custom geocoding:
- Go to the Map menu, and select Import Custom Geocoding.

- In the Import Custom Geocoding window, select the folder that contains the
Busiest Airports.csvfile. Note your folder path may be different from what is shown in the following screenshot:
- Click on Import. This will load the custom geocoding, and depending on how fast your machine is, may take a few minutes.
- After the custom geocoding is imported, right-click on the Airport dimension field and change the Geographic Role to Busiest Airports, and then Airport Code:

- Double-click on the Airport field in the Dimensions section of the sidebar. This will create a map in your view.
- Click on the indicator shown on the bottom-right corner of your view:

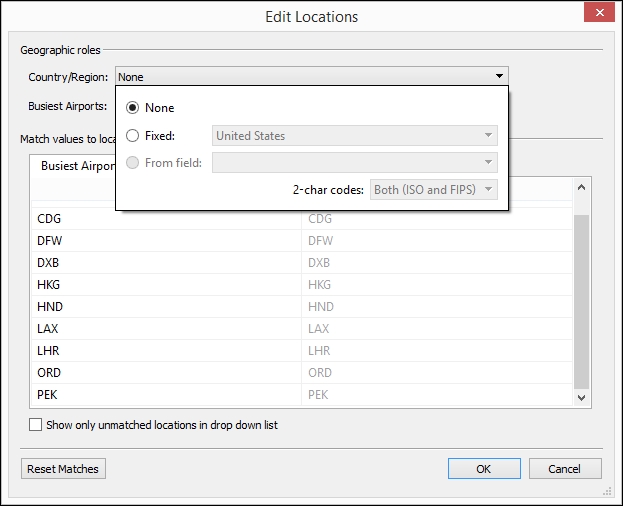
- In the Special Values for [Airport] window, select Edit Locations…:

- Select None for Country/Region field. Click OK when done:
- From Measures, drag Passengers to Color.
- Right-click on the Passengers pill in the Color property in the Marks card and select Measure, and then Average.
- From Measures, drag Passengers to Size.
- Right-click on the Passengers pill in the Size property in the Marks card and select Measure, and then Average.
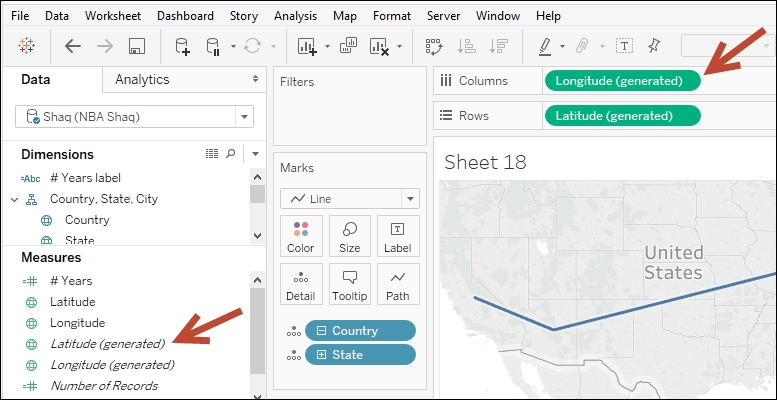
Tableau is installed with its own geocoding database, which is why when you double-click on a geocoded field in your data source, a map is automatically rendered. What this does is place the latitude and longitude that is related to that location on Rows and Columns, respectively. By default, these fields have the (generated) suffix with them.
If we want to add to this database, we can import our own geocoding values. At the very least, you need a location identifier and the latitude and longitude. You can also extend existing geographic roles (or a hierarchy of roles) by providing those role names in the CSV (comma separated value) file, as well as the corresponding latitude and longitude.
The requirements for custom geocoding are fully documented in Tableau's website, which you can access using this URL: http://bit.ly/custom-geocode.
Before you import custom geocoding, you need to close other instances of the Tableau application. There needs to be just a single instance running.
To import the custom geocoding, the CSV file(s) must be placed in a directory. In Tableau, under the Maps menu, there is an option to Import Custom Geocoding. When you select this, you will get a window asking for the directory path of the CSV file(s):

Depending on how fast your machine is, the import may take a few seconds to a few minutes. Once the geocoding is imported, you should be able to see the new role under Geographic Role. The new, main role name is based on the directory name you imported from. The additional roles you see in the following screenshot—Airport Code and Airport Name—are derived from the field names in the CSV file:

When you assign a field to these new roles, the fields will be assigned a new icon – a globe with a paperclip beside it:
