
In this recipe, we will combine the records from a text file and an Excel file using a blend.
To follow this recipe, download this chapter's files from the Packt website and use the following files:
- The
Airport Geocode—Blend.csvfile - The Worlds
Busiest Airports—Blend.xlsxfile
This is the content of the Airport Geocode—Blend.csv file:

These are the records in the Worlds Busiest Airports - Blend.xlsx file:

Here are the steps to blend the two data sources:
- Connect to the Excel file in this recipe. Make sure you choose Excel from the To a File section:

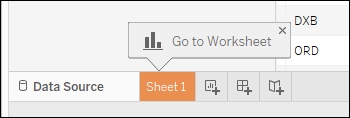
- Go to new worksheet:
- Click on the New Data Source icon, and this time connect to a Text file. Connect to the text file in this recipe:

- If you are directed back to the initial connection screen, go back to sheet 1.
- Under the Data menu, click on Edit Relationships:

- While Airport Geocode—Blend is selected as the Primary data source, click on Custom and match up the Airport Code field to Airport:

- Click on OK when done.
- While Airport Geocode—Blend is selected as the data source, drag Airport Code to the Rows shelf.
- Switch data source to the Excel file. Notice that Airport now has an orange link icon beside it:

- Continue to create your visualization using this dataset.
Blends are great for data mashups. Blending in Tableau allows multiple data sources to be linked together. The data sources can be of different types—for example, one could be an Excel file while another could be a text file.
Note
In previous versions of Tableau, a blend was the only way from within Tableau to link multiple data sources together. Starting in Tableau 10, cross-database joins are supported. See Using Join recipe in Chapter 6, Analytics for more information.
The data sources must have some common fields before they can be blended in Tableau. By default, Tableau looks for the same field names in the data sources and links the sources together based on these fields.
However, if the fields have different names, Tableau will give a warning message indicating that there is no relationship between the data sources. You will also find that when you start using fields from one or both data sources, there will be a broken link icon:

If the field names are different, the relationship needs to be defined. To do this, we can go to the worksheet menu and select Edit Relationships. From there, instead of Automatic, Custom can be chosen as well as identify which fields from both sources should match up:

After the relationship is set, you will find that the link will be enabled. This link will only appear after you have dragged one of the blending fields into the view. If none of the blending fields are in the view, the icon will still appear as broken:

With a blend, there must be only one primary and at least one or multiple secondary data sources. The primary data source is identified by a blue check arrow icon beside it, and the secondary data sources have an orange check arrow icon:

Fields from the secondary data sources will automatically be aggregated when dragged into the view or used in a calculated field. The level of aggregation follows that of the primary:

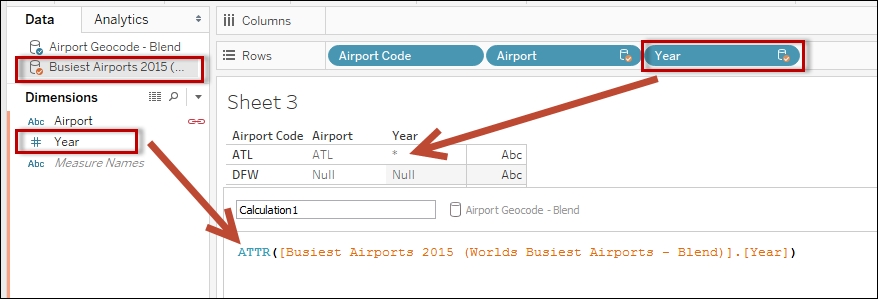
Dimension fields will also be aggregated using the ATTR function. If there are many related records in the secondary data source, and if there are multiple values for that field, the ATTR function will return an asterisk (*):
This leads to a common issue faced in blends when creating calculated fields. We need to make sure that we have the primary and secondary data source fields in an aggregated format when we use them in our expressions. Otherwise, we will get the error Cannot mix aggregate and non-aggregate arguments with this function:

Blend settings are per worksheet. If you create a new worksheet, the data source you drag from the first will be the primary.
Now that Tableau 10 supports cross-database joins, why would we still want to consider blending data? There are still some compelling reasons to go with blends. The first is, currently, the cross-database join functionality is not supported in all possible connections. Second, we may want to achieve a level of aggregation first before we want to data sources combined.
To better illustrate this, let's consider the two following data sources:
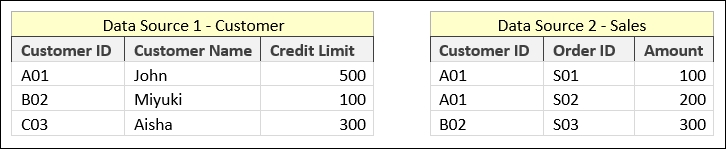
If we were to use a join operation (specifically a left outer join, with customer on the left side of the join operator so it is preserved), we will get the following result. The Credit Limit for Customer ID A01 is incorrect because the credit limit was doubled—$1,000 is being reported when it really is only $500:

This is the nature of joins, however. The join is working perfectly—it finds the matching values from the other table. Since Customer ID A01 bought twice, Customer ID from the Customer table matched twice to the Sales table and therefore reported the credit limit twice.
If we were to blend, however, we will get the following result set, reporting some different values:

In a blend, the aggregation happens at the data source level first, before the records from the two data sources are combined. Notice in the Measure Values card, the pill still says SUM(Credit Limit)— the same expression you saw in the previous join operation. This time, though, the SUM(Credit Limit) happens at the customer data source only, not at the resulting joined records. The SUM(Credit Limit) for Customer ID A01 in the customer data source is still $500 because there is only one record for that Customer ID in that data source.
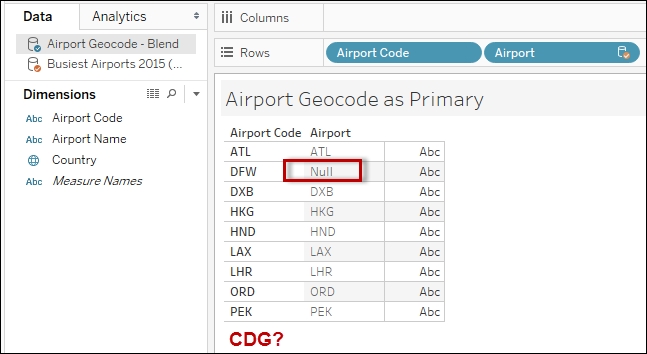
One more important thing to know about blends is that after the records in both data sources are aggregated to the same level, the records are combined using an operation akin to a left outer join. This means that if some values in the blending field are absent in the primary, they will not be reported at all.
For example, if our primary is the Airport Geocode, and it does not have the airport code CDG which our secondary has, CDG will not be pulled into any view:
The same issue will occur even if we reverse the primary and secondary data sources, and if the new primary is missing some values that are present in the secondary. The following shows what you would see if we made Busiest Airports 2015 the new primary data source, but it is missing the code for DFW:

There is no magic bullet solution for this issue, however. What we need to do is have another data source that has the complete set of values, and make that our primary. Or, if this is a data quality issue, this is great way to illustrate why data quality is of utmost importance in data analysis. Remember—good data in, good data (analysis/visualization) out. Not-so-good data in, not-so-good data (analysis/visualization) out.