
4
Effects of the Size and Nature of Fillers on the Thermal and Mechanical Properties of PEEK Matrix Composites
Marie DOUMENG1,2, Karl DELBÉ1, Florentin BERTHET2, Olivier MARSAN3, Jean DENAPE1 and France CHABERT1
1 ENIT – INPT, University of Toulouse, France
2Institut Clément Ader, University of Toulouse, France
3CIRIMAT – ENSIACET – INPT, University of Toulouse, France
4.1. Introduction
The properties of composites are governed by the properties of each of the constituents and their interactions at the interface. In nanocomposites, this contact surface is larger at constant filler rate, which makes the role of the interface preponderant. This role is even more dominant as the size of the fillers decreases; going from a micrometer to a nanometer filler, the specific surface increases by a factor of 1,000 for spheres. For nanocomposites, the researchers’ goal is to predict how matrix chemistry and morphology synergize with surface chemistry, size and shape of nanoscale fillers to define the properties of the resulting material. Crosby (2007) clearly outlines the state of knowledge of the “nano” effect on the mechanical properties of nanocomposites. Since then, numerous works have been able to better quantify the gain brought by nanofillers. This effect comes from the fact that the scales of the macromolecule and the filler are similar. It depends on the matrix, the filler and the interfacial interactions. Crosby and Lee (2007) observe that the “nano” effect is reduced when nanocomposites are developed by melt-processing, because the nanoparticles are difficult to separate: they form aggregates or coalesce to establish a percolation network within the material. In comparison, when the latter are prepared by in situ polymerization and by mixing diluted solutions, the nanoparticles are better dispersed and their effective size is smaller. However, these preparation methods are difficult to transpose industrially. We have therefore chosen to retain the melt method for this work, in order to avoid the use of solvents that are toxic to humans and the environment.
The shape factor (diameter/length, it is equal to 1 for spheres) also plays an important role in maximizing the area/volume ratio. It is clear that the platelet geometry has a significant advantage over more spherical fillers for an equivalent volume fraction. Nevertheless, high form factor fillers are difficult to disperse isotropically at high volume fractions. Consequently, the mechanical properties of the composites are likely to be anisotropic.
The Van der Waals interactions between the particles depend on the chemistry of the filler. The intensity of the interactions is quantified by the Hamaker constant. These interparticle interactions play an important role for high volume fractions by forming a percolating network, and also take part in strengthening particle aggregates.
The size, shape of the particles and their surface chemistry produce the interphase, a zone where the macromolecules are disturbed by the presence of fillers. Within this zone, the mobility of macromolecules, the crystallinity, the entanglement rate and the degree of cross-linking for thermosets are different. Therefore, in the interphase we observe a graduation of the properties, from the interface to the bulk matrix. It is commonly accepted that this phenomenon results from the establishment of weak Van der Waals-type bonds and donor–acceptor interactions, as in the case of hydrogen bonds (Jesson and Watts 2012). Numerous studies on polymeric fibers, collected in the review of Liu and Kumar (2014), report that the incorporation of carbon nanotubes enhances the mechanical properties in tension. This is due to the polymer–nanotube interaction that leads to the formation of an interphase, where the polymer is more ordered, more crystalline and better oriented than the rest of the polymer. This interphase is important for the performance of the material, as it cannot only improve the stress transfer between the rest of the polymer matrix and the fillers to fully utilize the mechanical properties of the particles which are stiffer, but also improve the properties of the polymer, as the ordered interphase layer will itself have much better mechanical properties than the rest of the matrix. The same observations were made with functionalized graphene (Terrones et al. 2011): the authors found an increase in glass transition temperature of 30°C in polymethyl methacrylate with only 0.05% weight of graphene, and 46°C in poly(acrylonitrile) with 1 wt % of graphene. An increase in the glass transition reflects a mechanical stiffening. These results were attributed to (a) the rough morphology of graphene, which improves the grip with the polymer chain and consequently provides better interfacial adhesion, and (b) the presence of oxygenated groups on the graphene surface, which can form hydrogen bonds with the carbonyl groups of acrylic polymers. Due to the disparity in material properties between the fiber and matrix, stress concentration can develop at the reinforcement–matrix interface. This stress concentration is amplified with the ratio of the shear moduli of the constituents and with the volume fraction of the reinforcements.
Understanding filler/matrix interactions opens the door to modifying the surface of fillers for a better control of mechanical properties. This is demonstrated by Bedi et al. (2018), who developed carbon nanotubes on the surface of steel, brass and carbon fibers. The interphase thickness, as measured by scanning electron microscopy (SEM), increases from 7 to 21 μm in the vicinity of steel fibers, for example. The gradual variation of the elastic modulus in the interphase after carbon nanotube grafting suppresses undesirable stress concentrations around the reinforcement caused by the existence of an interface. The review by Karger-Kocsis et al. (2015) provides an update on the various avenues explored to modify the surface chemistry of fillers, particularly for carbon fibers. The same idea was exploited earlier by Drzal et al. (1983) by way of surface treatment of graphite fibers in an epoxy matrix. The fiber treatment creates a brittle interphase layer between the fiber and the matrix, which increases the interfacial shear strength, resulting in a change in failure mode from interfacial to matrix fracture.
Numerous other studies highlight the effect of nanoscale sizes on the mechanical and thermal properties of composites (Shiu and Tsai 2014; Lee et al. 2016; Saleem et al. 2016; Khostavan et al. 2019). However, it is difficult to establish general rules for correlating these results, as the nature of the interactions in the interphase varies considerably between filler/matrix systems, and the complete chemical definition of their interactions is scarce. In addition, size comparison using multiple types of fillers is rarely the subject of studies. In parallel with experimental studies, modeling efforts have been conducted to better understand the properties of nanocomposites. Among notable works, Choi et al. (2015) proposed a model for predicting the overall Young modulus of the material and the mechanical stress transfer to the filler surface as a function of particle size and interphase thickness, using molecular dynamics and finite element simulation.
In this chapter, we have chosen four types of fillers that are known to increase the thermal conductivity of polymer matrix composites and/or provide mechanical reinforcement.
These are alumina (Al2O3), silicon carbide (SiC), boron nitride (BN) and graphite. In addition, studies that focus on understanding “nano” phenomena are conducted with model matrices, namely whose rheological behavior is close to the flowing model developed by Flory (1953), and whose resistance to degradation is appropriate for long characterizations. Nevertheless, these matrices are not the most interesting for advanced applications. For this reason, the matrix used is PEEK, a polyaryletherketone (Attwood et al. 1981), whose chemical structure made up of aromatic groups linked by ether and ketone groups gives the material a high chemical resistance and mechanical rigidity (Rae et al. 2007). PEEK is increasingly used as a replacement for steel in industries that require high-performance materials, such as aerospace or medical ones, with the advantage of considerable weight savings. Some authors have already worked on the influence of mechanical and thermal properties when adding alumina (Goyal et al. 2007), carbon nanotubes (Díez-Pascual et al. 2012) or graphite (Panda et al. 2019). However, the role of the interphase is not detailed in this work. Chen and Hsiao (1992) highlight the appearance of a transcrystallization of PEEK in the presence of carbon, glass and aramid fibers, that is to say, an interphase in the vicinity of the fibers more crystalline than the rest of the matrix. The effect on the thermal and mechanical properties is not specified.
The micro-/nanocomposites prepared by melt-mixing were characterized by thermal measurements, dynamic mechanical analysis and friction measurements to highlight the effect of size and nature of fillers on the thermal and mechanical properties of the composites.
4.2. Materials and methods
4.2.1. Polymer
The polymer under study is PEEK 450G, a grade used for injection molding and extrusion, synthesized and marketed by Victrex. This grade is the most common polyetheretherketone used in industry. Its thermal and mechanical properties are given by the supplier and presented in Table 4.1.
Table 4.1. Properties of Victrex PEEK 450G at room temperature
| Properties | PEEK 450G | Testing method |
| Melting temperature | 343°C | ISO 11357 |
| Start of the glass transition temperature | 143°C | ISO 11357 |
| Young’s modulus | 3.8 GPa | ISO 178 |
| Thermal conductivity | 0.32W/(m·K) | ISO 22007-4 |
| Density | 1.30 g/cm3 | ISO 1183 |
| Hardness | 84.5 Shore D | ISO 868 |
4.2.2. Reinforcements
4.2.2.1. Particulate reinforcements
SiC is a crystalline material formed by the alternating stacking of compact planes of C-Si pairs. More than 200 polytypes of SiC are counted, each of these polytypes has a different structural arrangement. One of them, grade β or SiC-3C in Ramsdell notation (Ramsdell 1947), crystallizes in a face-centered cubic lattice whose C-Si stacking sequence contains three layers. Each Si atom binds to four atoms of C forming tetrahedra (see Figure 4.1(a)), which are arranged such that the atoms lie in parallel planes containing nodes of regular hexagons (Lefevre 2008). It has the same structure as diamond carbon. Figure 4.1(b) represents the position of C and Si atoms in the (-1 1 0) plane, A, B and C represent the stacking sequence. In SiC, the interatomic bonds of length 0.189 nm are highly covalent at 89% (Lafon-Placette 2015) due to the small electronegativity difference between Si (1.9) and C (2.55) on the Pauling scale (Pauling 1932). It is used as an abrasive due to its high hardness, but also in the field of electronics for its broadband semiconductor properties. In addition, SiC is chemically inert, it does not react in the presence of a large number of substances and has good corrosion resistance.
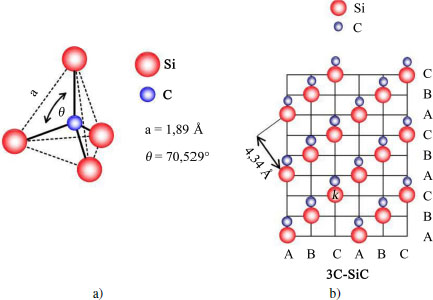
Figure 4.1. SiC crystal structure: a) tetrahedron formed by four atoms of Si and b) representation in the (–1 1 0) plane of the basic pattern of the polytype 3C (Lefevre 2008). For a color version of this figure, see www.iste.co.uk/bai/nanocomposites.zip
The α phase of aluminum oxide or alumina, denoted α-Al2O3, is a chemical compound existing naturally in bauxite. Alumina crystallizes in the rhombohedral system considered as a compact hexagonal stacking of the O−2 oxygen anions with the Al3+ cations. The Al atoms occupy two out of three octahedral sites (see Figure 4.2) (Kronberg 1957; Roussel 2013). Alumina contains hybrid ionic bonds at 57% and covalent bonds at 43%, making it resistant to degradation by external agents. Being a ceramic, alumina is chemically inert. Alumina is abrasion resistant, refractory and biocompatible, and could be used in biomedical applications. Its electrical conductivity is low and can be used as an electrical insulator in semiconductor components (Decup 2010).
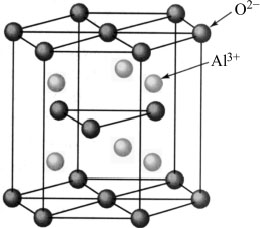
Figure 4.2. Crystal structure of alumina
The properties of these reinforcements are summarized in Table 4.2. These particles are expected to reinforce the polymer matrix in volume by stiffening the composite.
Table 4.2. Properties of the particles used in the study at room temperature
| Properties | Silicon carbide | Aluminum oxide |
| Density (g/cm3) | 3.22 | 3.95 |
| Vickers hardness (HV) | 22 | 13.7 |
| Young’s modulus (GPa) | 420 | 400 |
| Thermal conductivity (W/(m·K)) | 490 | 30 |
4.2.2.2. Lamellar compounds
Graphite is a set of two-dimensional sheets, named graphene, whose thickness is one carbon atom. The sheets are spaced about 0.335 nm apart (Bernal 1924). In natural graphites, two graphite polytypes are mixed: graphite-2H, called α-phase possessing a hexagonal crystal structure, and graphite-3R, known as β-phase possessing a rhombohedral crystal structure (Figure 4.3). This material has lubricating properties, because it is composed of sheets that slide relatively to each other, and the bonds between the sheets are weak Van der Waals-type bonds. In the planes, the bonds are strong and of the covalent type. However, the lubricating properties can be diminished by the presence of gases and vapors in the environment, which limit the interactions facilitating the cleavage of the planes (Savage and Schaefer 1956; Zaidi et al. 1995). Thermal and electrical conductivity are high and increase with temperature because phonons and valence electrons have more mobility. Graphite is not chemically inert, it is amphoteric. It can gain or give up electrical charges to form links with its environment. It can therefore form bonds with the polymer matrix.
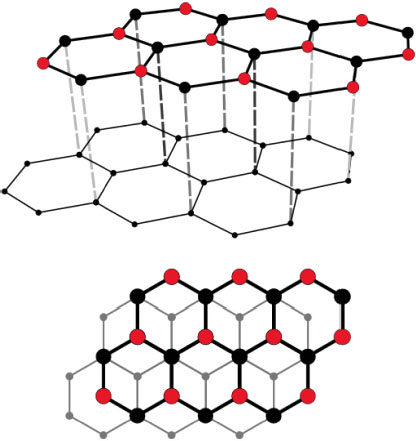
Figure 4.3. Crystal structure of graphite. For a color version of this figure, see www.iste.co.uk/bai/nanocomposites.zip
BN is very similar to carbon because it is formed of the elements boron and nitride, which are neighbors of the element carbon in the periodic table. It exists in hexagonal or cubic form. The hexagonal form, denoted h-BN, is a ceramic known as “white graphite” because its color and crystallographic structure is almost identical to that of graphite (Termoss 2009). BN is chemically inert and does not react in the presence of another substance, which makes it different from graphite. Moreover, the shear strain energy dominates over the sliding energy in the case of graphene, which is the opposite for BN (Figure 4.4) (Falin et al. 2017). The BN sheets slide more relatively to each other for distances smaller than 15 nm.
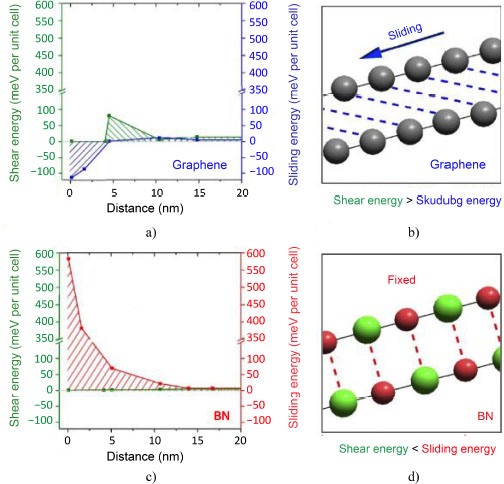
Figure 4.4. Distribution of shear strain energy and sliding energy according to the distance for a) and b) graphene and c) and d) boron nitride (Falin et al. 2017). For a color version of this figure, see www.iste.co.uk/bai/nanocomposites.zip
The properties of these reinforcements are summarized in Table 4.3. The materials are anisotropic, and their properties vary in the plane or perpendicularly to the plane of the sheets. Lamellar compounds are solid lubricants that often limit wear and friction.
Table 4.3. Properties of the lamellar compounds used in the study at room temperature
| Properties | Boron nitride | Graphite |
| Density (g/cm3) | 2.10 | 2.10 |
| Vickers hardness (HV) | 0.2 ⊥, 24.6 // | 60 |
| Young’s modulus (GPa) | 93 | 1 000 |
| Thermal conductivity (W/(m·K)) | 30 ⊥, 600 // | 2–800 ⊥, 200–2000 // |
4.2.3. Nano- and microcomposites preparation
The composite materials are elaborated by adding powdered reinforcements to the PEEK polymer matrix. To highlight the size effects, two filler sizes are used. The concentrations chosen are from 2.5% to 10% by volume to quantify the effect of the reinforcement rate on the different properties. These rates correspond to those generally used for micro- and nanocomposites. To implement the reinforced PEEK samples, the matrix and reinforcements are blended by melt-mixing with ThermoFischer’s Rheomix 600 internal blender, which is equipped with roller rotors suitable for blending molten thermoplastics. The temperature is chosen to be 360°C and corresponds to the complete melting of PEEK on the DSC thermograms. Although the polymer is still very viscous at this temperature, further heating is not possible due to the sensitivity of PEEK to thermo-oxidative degradation. The rotation speed of 40 rpm corresponds to an average shear rate of 40 s−1. When the temperature of 150°C is reached, the mixture is quickly extracted from the chamber before its cooling, which is accompanied by stiffening. The crushed material is placed in a mold, then shaped with the LAB 800P hot press from Pinette Emidecau Industries, requiring only a small amount of material. The compression cycle is composed of three steps. The first consists of heating the polymer to 360°C at 4 K/min to melt it. Then, the temperature is stabilized for 300 s, allowing time for the entire polymer to melt. Finally, the polymer is cooled at a ramp rate of 4 K/min, to allow time for the polymer to crystallize uniformly. When the temperature of the molded plate is below its glass transition, the plate can be removed from the mold without any risk of deformation. To control the roughness, the mold is placed between two sheets of foil, previously cleaned to avoid impurities on the surface of the samples.
4.2.4. Characterization
4.2.4.1. SEM
The scanning electron microscopic observation is achieved with a ZEISS EVO HD 15 LS to determine the filler distribution in the matrix at a pressure of 40 Pa in the analysis chamber. The observations are made in chemical or topographic contrast mode.
4.2.4.2. Laser granulometry
The laser diffraction granulometer instrument is the Horiba LA960 analyzer. It is composed of two light sources and a set of photodiodes collecting the scattered light to calculate the particle size distribution. The analysis is made by a liquid-based process in the aqueous phase with deionized water, in order to respect the integrity of the samples. The ultrasounds are not activated during the measurement. For each sample, two sets of three measurements are performed to check the repeatability and reproducibility of the measurements.
4.2.4.3. Density
The density ρ gives an indication of the physical structure of the polymer. The method used in this study is based on hydrostatic weighing or immersion according to the ISO 1183-1:2019 standard. The sample is placed in a nacelle supported on a gantry that rests on the scale. The water beaker is positioned on a base that does not rest on the scale. The sample is cut with an automatic saw to the dimensions 15 mm× 45 mm. It is then soaked in a wetting agent, a mixture of dishwashing liquid and water, and placed in the weighing device. Each sample is weighed three times.
4.2.4.4. DSC
The DSC instrument used is Q200 from TA Instruments. The samples are sliced to obtain about 10 mg of material and then placed in sealed aluminum pans. They are then heated from 80 to 380°C at 10 K/min. A flow of nitrogen is circulated at 50 mm · min−1. The temperature is held for 1 minute, then the sample is cooled from 380 to 80°C at 10 K/min and a heating cycle is applied for the second time. For each material, two samples were analyzed. The DSC analysis gives information on the characteristic temperatures of the polymer, including the glass transition temperature Tg.
The final crystallinity is calculated from the DSC thermogram using the following formula:
The quantities used are the experimental enthalpy of fusion ΔHm and the theoretical enthalpy of fusion in the case where the material would be 100% crystalline, for PEEK, ![]() . If cold crystallization occurs, the enthalpy of cold crystallization ΔHcc must be subtracted from the experimental enthalpy of fusion ΔHm. For a composite, we must take into account its polymer weight content xmas.PEEK, which is calculated from the following formulas with the density of PEEK ρPEEK, the filler density ρfillers and the filler volume content xvol.Fillers:
. If cold crystallization occurs, the enthalpy of cold crystallization ΔHcc must be subtracted from the experimental enthalpy of fusion ΔHm. For a composite, we must take into account its polymer weight content xmas.PEEK, which is calculated from the following formulas with the density of PEEK ρPEEK, the filler density ρfillers and the filler volume content xvol.Fillers:
In addition, PEEK can recrystallize when heating during DSC analysis. This phenomenon is not taken into account in the formula of the crystallinity rate. For each sample, two analyses are made to verify the repeatability and reproducibility of the measurements.
4.2.4.5. Thermal conductivity
Thermal characterization provides an indication of the material and in particular, its ability to diffuse thermal energy during tribological testing. The Hot Disk TPS 2500S analyzer is an instrument for measuring thermal conductivity, thermal diffusivity and heat capacity of homogeneous and heterogeneous materials in a non-destructive way. The 2 mm diameter probe is made up of a double nickel spiral electrically insulated by a Kapton insulating coating. It provides a heating power fixed at 20 mW for a time of 5 s in order to raise the temperature of the studied material by a few degrees. This same probe is also used to measure the temperature rise by means of recording the variation of its electrical resistance via a Wheastone bridge. The characteristics of the temperature rise, directly related to the evolution of the electrical resistance of the probe, are precisely recorded and the analysis of this variation (transient regime) allows us to determine both the conductivity and the thermal diffusivity. This measurement is absolute and therefore requires no prior calibration or correction factors. Each 3.5 mm thick sample is analyzed five times for test reproducibility.
4.2.4.6. DMA
Dynamic mechanical analysis measures the viscoelastic properties and gives information on the molecular mobility of the polymer chains. The tests are performed on a rheometer (ARES LN2, Rheometrics). The configuration chosen in this study is a rectangular torsion with a fixed deformation of 0.5% at 1 Hz imposed by a motor at the bottom axis. The sensor connected to the top axis measures the resulting stress developed in the sample. The sample is heated in an electric oven. The temperature is measured in the air a few millimeters away from the sample. Each material is tested once in the linear viscoelasticity range, that is, the range where stress is proportional to applied strain, from room temperature to 300°C, with a temperature ramp of 3 K/min.
4.2.4.7. Tribological testing
The tribological tests are carried out using the UMT Tribolab tribometer from Bruker. All of the tests are performed without lubrication under similar conditions in order to be able to compare them. The chosen configuration is of the ball/plane type, and it leads to having an open contact. The plane is PEEK or PEEK matrix composite. The ball, which is the wiper, is made of 100Cr6 steel with a diameter of 9.5 mm. The parameters are based on standard ASTM G133: “Standard Test Method for Linearly Reciprocating Ball-on-Flat Sliding Wear”. The motion is linear reciprocating at a frequency of 5 Hz with a displacement of 10 mm. The normal load of 25 N is controlled by the load sensor, which has a measuring range of 5–500 N with a resolution of 25 mN. Under these conditions, the maximum allowable Hertz pressure for no deformation to occur after withdrawing the ball is 162 MPa, with a contact radius of 0.27 mm for the PEEK sample (E = 4 GPa and ν = 0.35). The tests have a duration of 300, 600, 900, 1200 and 1500 s to quantify the evolution of tribological properties over time. Each test is repeated three times to confirm the reproducibility of the tests.
4.3. Results
4.3.1. Characterization of the powders
The powders are characterized by SEM and laser granulometry to determine their dimensions before mixing them with the polymer.
4.3.1.1. Scanning electron microscopy
Fillers form aggregates and were observed using SEM. The images are presented in Tables 4.4 and 4.5. The dimensions of the fillers are indicated in the tables and are taken from the data sheets provided by the suppliers.
4.3.1.2. Particle size
The particle size distribution curves of the initial powders are presented in Figures 4.5(c) and (d), confirming the presence of agglomerates prior to the composite mixing step.
Table 4.4. SEM observations of the particles used in the study
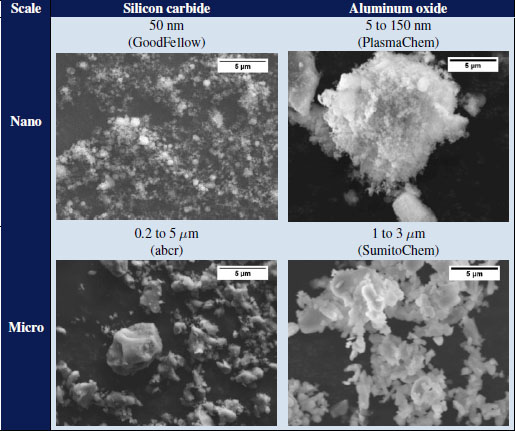
For SiC, nano-sized alumina and nano-sized graphite powders, at least two size populations are brought forward. Only the curves for BN powders have a Gaussian and narrower shape, indicating a more regular distribution. SiC is the one whose sizes are the smallest, between 30 nm and 3 μm for nanometric sizes, and between 80 nm and 20 μm for micrometric sizes. Graphite and alumina form the largest agglomerates with maximum sizes of 300 μm. In addition, the powders qualified as nanometric size form agglomerates whose sizes are greater than those of micrometric size powders. It is recalled that these measurements were made without prior dispersion. It is certain that a step in an ultrasonic bath would have resulted in reducing the number and size of the agglomerates. However, and in particular for BN and graphite fillers, the cohesion appears to be weak and the sheets easily detach themselves during handling. For this reason, it is expected that during the mixing step during composite forming, the agglomerates will break up and the laminates will partially exfoliate.
Table 4.5. SEM observations of the lamellar compounds used in the study
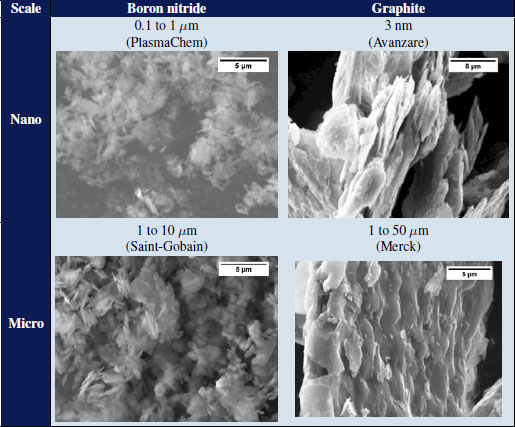
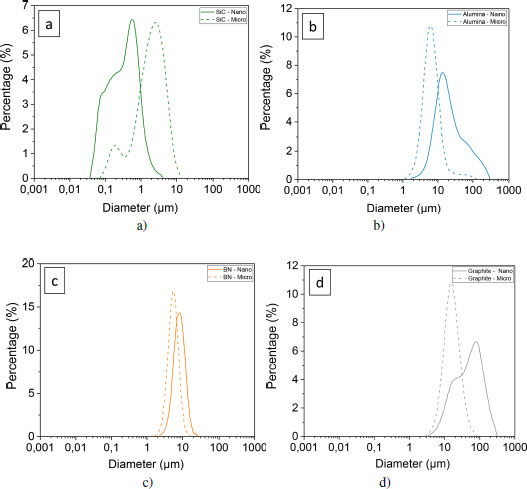
Figure 4.5. Particle-size curves of nano and micrometer-sized powders of a) silicon carbide, b) alumina, c) boron nitride and d) graphite. For a color version of this figure, see www.iste.co.uk/bai/nanocomposites.zip
4.3.2. Filler distribution in the matrix
The distribution of the fillers has a strong influence on the behavior of the composites, that is why their dispersion in the matrix was verified. As seen previously, all of the fillers used are in the form of aggregates before the mixing step. The high shear viscosity of PEEK in the molten state, around 5000 Pa·s, results in high stress on the aggregates, which leads to filler rupture and erosion. These mechanisms have been well described in the works of Peuvrel–Disdier on polypropylene matrices (Zouari et al. 2012; Domenech et al. 2014; Normand et al. 2016). These works show that the dispersion increases along with the duration of shear until a percolating lattice is created, which is reflected by a drastic increase in viscosity at low shear. Nevertheless, with PEEK, it is not possible to continue mixing beyond 10 minutes due to thermal degradation of the polymer. The dispersion state was quantified by SEM images in chemical contrast mode. The images were analyzed using ImageJ. Figure 4.6 shows the distribution of SiC fillers within the PEEK matrix, SEM images (a and c) and binarized images (b and d). The distribution is considered homogeneous for the two sizes under study.
The histograms illustrate the size distribution of the fillers in Figure 4.7. With the addition of micrometric fillers, particle sizes are larger than those indicated by the suppliers, represented in red on the histograms. This confirms the presence of agglomerates. With the addition of nanoscale fillers, agglomerates are also present, which can reach up to 3 μm. According to the laser particle size results, the D10 value is 80 nm for nanometric SiC; in other words, 10 volume % of the particles are smaller than 80 nm. Nevertheless, the histogram from the image analysis shows that one-third of the detected particles are smaller than 50 nm. These results prove that the mixing step has indeed led to reducing the size of the nanoparticle agglomerates. It is likely that a larger number of even smaller particles are not detected by the analysis software. For micrometer sizes, the value of D50 is at 2 μm: half of the particles measure less than 2 μm before mixing and the image analysis gives about the same proportion after mixing. Therefore, there is little change in size for the micrometer particles following their incorporation into the matrix.
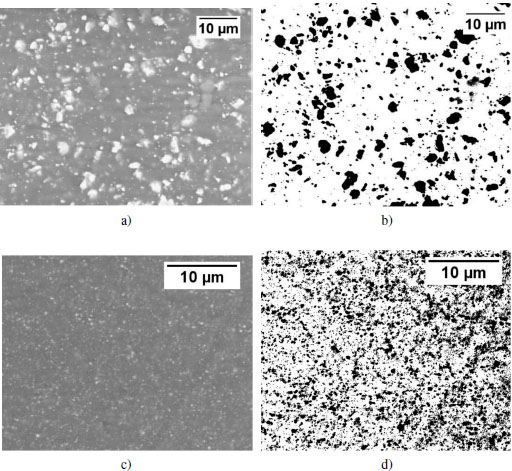
Figure 4.6. SEM images of the surface of a) nanometer-sized and c) micrometer-sized silicon carbide-loaded samples and associated binarized images b) and d)
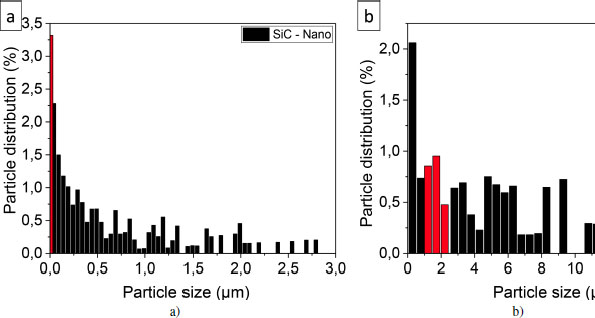
Figure 4.7. Particle size distribution histograms for silicon carbide loaded samples of a) nanometer and b) micrometer sizes. In red: sizes given by the supplier. For a color version of this figure, see www.iste.co.uk/bai/nanocomposites.zip
Furthermore, the dispersion is characterized by the critical inter-particle distance CID, which is defined by the following equation, where dr is the diameter of the reinforcements and xvol.Fillers is the content by volume in reinforcements (Kadiyala and Bijwe 2018). It should be noted that this equation is only valid for spherical reinforcements such as alumina and silicon carbide:
Figure 4.8 represents the critical interparticle distance for SiC-loaded samples whose shape is similar to a spherical shape. The critical interparticle distances are higher with micrometer-sized SiC particles (CIDmax = 8.8 μm) compared to nanometer-sized SiC particles (CIDmax = 0.1 μm). The SiC microparticles are spaced further apart, relatively to each other. The addition of alumina particles gives similar results to the addition of SiC. However, this equation cannot be used in the case of lamellar reinforcements, which do not have a spherical shape.
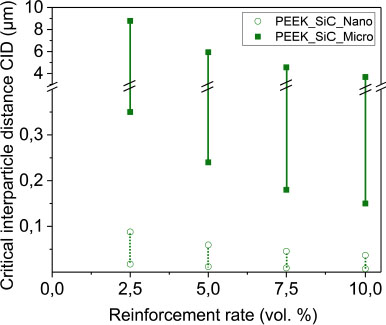
Figure 4.8. Critical inter-particle distance CID of silicon carbide. The vertical bars indicate the minimum and maximum CID. For a color version of this figure, see www.iste.co.uk/bai/nanocomposites.zip
In addition, density measurement is performed for all samples to confirm the loading percentage. The density of PEEK ρPEEK manufactured by thermocompression is 1.297 g/cm3. The filler densities are: ρBN = 2.1 g/cm3, ρsiC = 3.21 g/cm3, ρGraphite = 2.1 g/cm3 and ρAl2O3 = 3.95 g/cm3. Figure 4.9 represents all of the values of the experimental densities. The density evolves linearly at the reinforcement rates, and the lines representing the theoretical densities according to the rate and type of reinforcement are identical to the theoretical densities. The percentage of fillers corresponds well to the percentage of fillers initially introduced into the polymer.
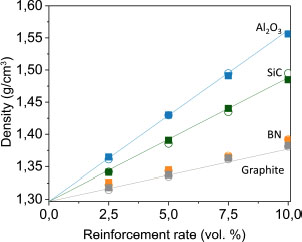
Figure 4.9. Density of reinforced PEEK samples: nano ○ and micro ■ scale. The absolute uncertainty is ± 0.005 g/cm3 and is not represented on the plot. For a color version of this figure, see www.iste.co.uk/bai/nanocomposites.zip
4.3.3. Effect of size on thermal transitions
The PEEK thermogram is shown in Figure 4.10. The glass transition temperature is determined by the tangent method by taking the slope at the inflection point. The melting and crystallization temperatures are taken at the maximum of the respective peak. The characteristic temperatures are Tg = 152.5°C, Tm = 345.1°C and Thc = 300.3°C.
An increase in the glass transition temperature Tg means that the polymer material becomes stiffer and retains its mechanical properties at higher temperatures. According to Kadiyala et al. (2018), upon addition of reinforcement, the free volume decreases, the critical interparticle distance CID decreases, and the polymer macromolecules have less mobility. However, the effect on the free volume depends on the chemical nature of the filler surface. When the interfacial adhesion is strong, chain mobility is reduced in the interphase area, which results in an increase in the glass transition. Therefore, more energy is needed to allow the macromolecules to move. With the addition of particulate reinforcement in PEEK, Tg decreases, as shown in Figure 4.11. This confirms the existence of a strong interaction between fillers and macromolecules, which leads to the stiffening of the chains. On the contrary, no trend is observed with the addition of lamellar reinforcement with scattered results. This may suggest a heterogeneous dispersion of the reinforcements or the addition of several antagonistic effects on chain mobility. The effect of particles on the melting and crystallization temperature is not shown here. The maximum of the melting peak is shifted by 2°C at most toward the higher temperatures for all of the fillers. Concerning the crystallization phenomenon, the peak maximum is shifted by 8°C at most toward the lower temperatures for SiC and alumina, while it is shifted by 1–2°C toward the higher temperatures for BN and graphite. These changes, even of a small amplitude, confirm the existence of interactions of a different nature in each filler/matrix couple.
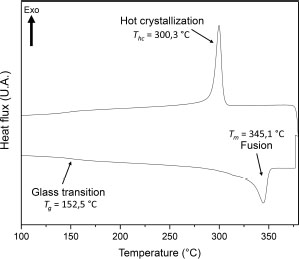
Figure 4.10. DSC thermogram of PEEK processed by thermocompression
4.3.4. Effect of size on the degree of crystallinity
The degree of crystallinity can be established using several techniques: density measurement, differential scanning calorimetry and X-ray diffraction. We have established an approach to verify the strengths and shortcomings of each technique, in the analysis of the microstructure of PEEK (Doumeng et al. 2021). We only use differential scanning calorimetry in this study. The degree of crystallinity is calculated from the enthalpy of fusion and the value is corrected by the actual amount of polymer, taking into account the proportion of fillers. Figures 4.12(c) and (d) illustrate these values for the reinforced samples.
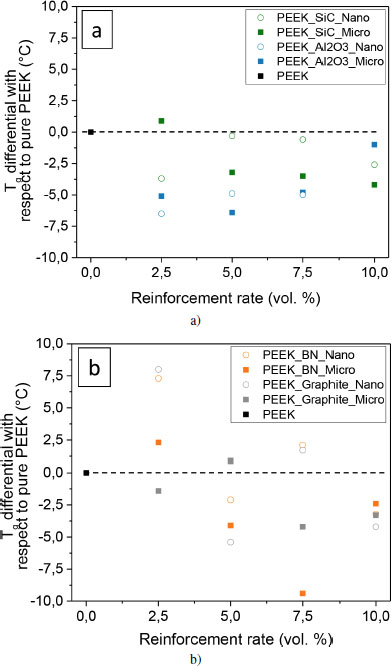
Figure 4.11. Evolution of glass transition temperatures Tg for PEEK samples reinforced with fillers: a) particulate and b) lamellar. The absolute uncertainty is ± 0.1°C, and it is not shown in the figure. For a color version of this figure, see www.iste.co.uk/bai/nanocomposites.zip
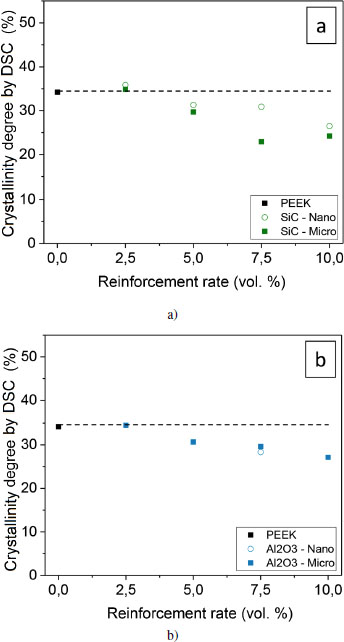
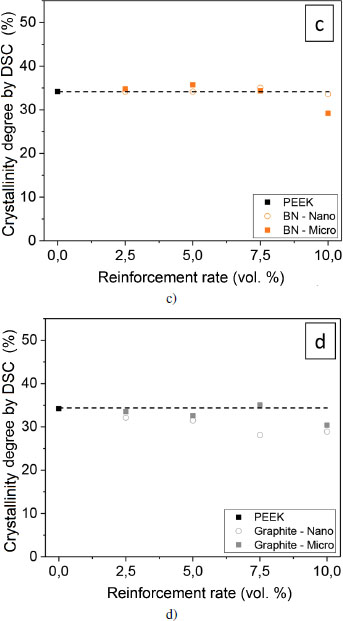
Figure 4.12. Crystallinity degree of reinforced PEEK samples determined by DSC: nano ○ and micro ■ scale. The absolute uncertainty is ± 0.4%, and it is not shown in the figure. For a color version of this figure, see www.iste.co.uk/bai/nanocomposites.zip
Particulate-based reinforcements (alumina and SiC) imply a greater decrease in the crystallinity degree compared to lamellar-based reinforcements (BN and graphite). These results are in agreement with the findings on the evolution of the crystallization temperature. The addition of SiC and Al2O3 results in a hindrance for the macromolecules, they have to self-organize. This hindrance could originate from a stronger interfacial adhesion. The movement of the chains would then be limited by their attachment to the particle. Kuo et al. (2005) observed a decrease in the crystallinity degree from 5.5 weight % (that is, 1.9 volume %) of alumina, whereas Kadiyala et al. (2018) observed a decrease from 10 weight % (that is, 4.3 volume %) of SiC. The size of the reinforcements does not seem to significantly influence the degree of crystallinity. For all of the samples, there still seems to be a tendency for the crystallinity to decrease with the reinforcement rate.
4.3.5. Thermal properties
Thermal conductivity, thermal diffusivity and mass heat capacity were measured for PEEK and for each of the composite materials in this study.
We recall that the thermal conductivity represents the ability of the material to gradually transport thermal energy. Thermal diffusivity represents the capacity to distribute more or less quickly and homogeneously this thermal energy in the material; it can thus depend strongly on the homogeneity of the material. Finally, the mass heat capacity is associated with the thermal energy to be brought to the material to raise its temperature by 1 kelvin per unit of mass. It also reflects the degree of freedom of the elementary constituents of the material: therefore, the higher the heat capacity, the more the phenomena of vibration, rotation and deformation at the molecular scale are numerous and can be brought into play. These three thermal properties are related since the thermal conductivity is the product of the density with the thermal diffusivity and the mass heat capacity.
The thermal conductivity of the fillers is higher than that of PEEK, which is 0.29 W/(m·K). Therefore, the composites have a higher conductivity than the virgin matrix. This is well highlighted in Figures 4.13(a) and 4.14(a).
With materials containing SiC or Al2O3, the thermal conductivity increases with filler content from 0.3 to 0.5 W/(m·K) (see Figure 4.13(a)). The particle size does not seem to significantly affect this increase. At the same time, the thermal diffusivity of the composites increases significantly: from 2.5 · 107 to 3 · 107 m2/s (see Figures 4.13(b) and 4.14(b)). The addition of manometric SiC leads to the most notable increase in thermal diffusivity. Thereby, SiC nanoparticles contribute to the most efficient heat diffusion of this series of materials. Finally, the heat capacity generally varies little with the addition of SiC or Al2O3 filler (see Figure 4.13(c)). Nonetheless, the SiC nanoparticles lead to a significant lowering of heat capacity, which is consistent with a decrease in intramolecular mobility that would be caused by the presence of SiC nanoparticles. The 2.5 volume % content of micrometric SiC also causes this drop in heat capacity, but this effect quickly fades with the addition of fillers.

Figure 4.13. Evolution of a) thermal conductivity, b) thermal diffusivity and c) heat capacity of particulate filler-reinforced PEEK samples. Nano ○ and micro ■ scale. For a color version of this figure, see www.iste.co.uk/bai/nanocomposites.zip
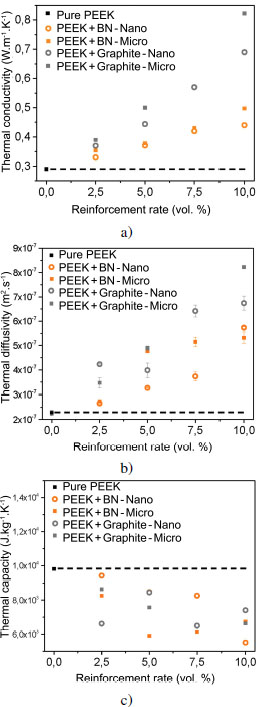
Figure 4.14. Evolution of: a) thermal conductivity, b) thermal diffusivity and c) heat capacity of lamellar filler-reinforced PEEK samples. Nano ○ and micro ■ scale. For a color version of this figure, see www.iste.co.uk/bai/nanocomposites.zip
In the case of lamellar particles, the increase in thermal conductivity is more significant, from 0.35 W/(m·K) with 2.5 volume % of lamellar fillers, up to 0.4 W/(m·K) with 10 volume % of h-BN. We even measure 0.8 W/(m·K) with 10 volume % of micrometric graphite (see Figure 4.14(a)). This is accompanied by an increasing thermal diffusivity with particle content (see Figure 4.14(b)) and a decrease in mass heat capacity (see Figure 4.14(c)). The addition of lamellar particles increases the ability of the material to transport heat efficiently and homogeneously throughout the volume; however, this is at the expense of intramolecular mobility. It is therefore the networks created by the additional fillers that seem to cause the improvement of the thermal conductivity of these materials.
PEEK loaded with 7.5 volume % of SiC nanoparticles or 5 volume % of graphite nanoparticles does not seem to have a homogeneous filler distribution in the matrix. As a matter of fact, the thermal diffusivity and heat capacity of these two materials do not follow the generally observed trends.
4.3.6. Effect of size on mechanical properties
4.3.6.1. Thermomechanical study
Although the long-range molecular motion of PEEK is reduced below the α transition corresponding to the glass transition temperature, there exists limited motion of the lateral groups, corresponding to the β and γ transitions. The β transition takes place at −95°C, reflects the rotation of aromatic rings and movements of polar carbonyl bridges, and is more pronounced in the presence of moisture. A γ transition has also been reported at a temperature of – 155°C, resulting from very localized non-cooperative motions (David and Etienne 1992).
Our tests are conducted between 50°C and 300°C; within this range, only the α transition is visible. The curves showing the evolution of the storage modulus E′, the loss modulus E″ and the ratio tan δ are presented in Figure 4.15. The storage modulus of PEEK is stable up to 145°C with a value close to 1 GPa. The polymer is found in its glassy state in which it is rigid and brittle, due to the reduced molecular movements. Between 145°C and 185°C, a drop of one decade in modulus is observed, which corresponds to the shift to the glass transition until about 200 MPa is reached. From 185°C, E′ decreases more slowly, it is the rubbery plateau in which molecular movements are possible, the material is soft. From 270°C onwards, the fall of the modulus accelerates, it is the beginning of the flow of the polymer when the molecules begin to slide on one another. The loss modulus E’’ is equal to 10 MPa, before the glass transition. In this glassy state, E’ is greater than E’’; this is characteristic of a “solid” behavior of the viscoelastic material, which is preserved throughout the temperature range studied. On the contrary, above 300°C (not shown), E’’ becomes dominant, material then exhibits a “liquid”-like behavior. In the transition region between 125°C and 225°C in Figure 4.15, the value of E″ increases sharply and then decreases; this peak indicates the maximum amount of heat dissipated per deformation unit. At the molecular level, this maximum value of the loss modulus indicates that intermolecular bonds are broken, macromolecules have more mobility to flow by rubbing against each other. The tan δ curve follows a shape identical to that of E″, with a maximum at the time of the glass transition.
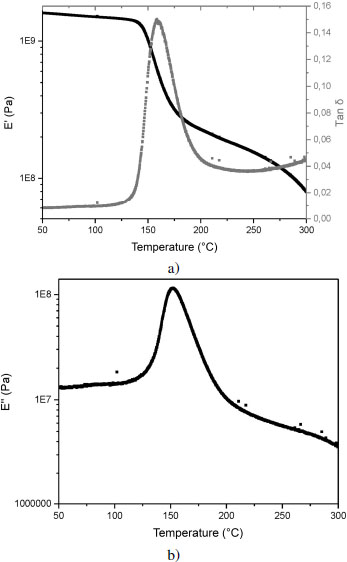
Figure 4.15. Evolution of a) the storage modulus E′ of the loss angle tan δ and b) the loss modulus E″ for PEEK
The storage modulus E′, corresponding to the proportion of energy recovered, increases with the addition of reinforcement for all samples at room temperature; thereby, the energy return is greater. To highlight this evolution, Figures 4.16(c) and (d) represent the evolution of E′ at 50°C according to type, size and loading rate. In our study, the evolution of E′ is linear according to the content for this concentration range. However, the phenomenon is more complex, E′ is the sum of the contribution of several phenomena: filler properties, interfacial interaction and organization of the fillers within the matrix. We assume that the evolution of E′ follows a mixing rule in our particular case; we have drawn lines on the graphs to quantify this evolution.
The increase in E′ is more significant with the addition of micron BN reinforcement with a slope of 9.4 · 107 Pa/% for the fitting curve. Nevertheless, this is a fitting curve that follows a mixing rule and does not take into account interactions between the reinforcements and the matrix. On the contrary, the smallest increase in E′ corresponds to the nanoscale alumina reinforcements, with a slope of 2.8 · 107 Pa/% for the fitting curve. This means that the proportion of energy recovered is greater with micrometric BN reinforcements, and the material is stiffer than with nanometric alumina reinforcements. We note that the sample reinforced with 2.5 volume % of boron nitride microfiller has a storage modulus E′ of 1.4 GPa, which is lower than that of PEEK. The energy recovered is less important for this sample. Nonetheless, it appears that the points corresponding to the concentrations under study are aligned. This shows that the increase in stiffness of PEEK with BN is not an affine equation passing through 0 volume %. It appears that BN causes a decrease in the stiffness of PEEK, which is explained by the creation of an interphase of greater mobility around the BN layers, due to the absence of interfacial adhesion.
Let us now look at the loss modulus, which reflects the viscous character of the material. It represents the flow of chains, one on top of the other, without modification of their chemical structure. Due to molecular friction, heat is dissipated; this energy is lost by the material. When E″ is higher, it means that the proportion of energy dissipated will be higher. As mentioned before, the evolution of E″ is linear in our case, but other phenomena are taken into account, such as the filler distribution within the matrix and the interactions between fillers and matrix. If we compare our samples, E″ is the highest for the graphite reinforced sample (see Figures 4.17(c) and (d)). For particulate filler-reinforced samples, the values of E″ vary little with the addition of reinforcement.
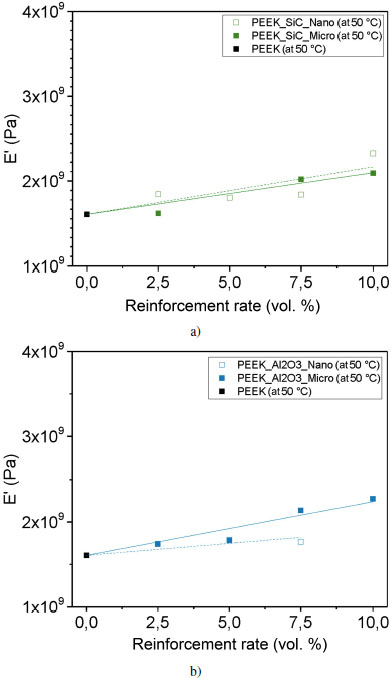
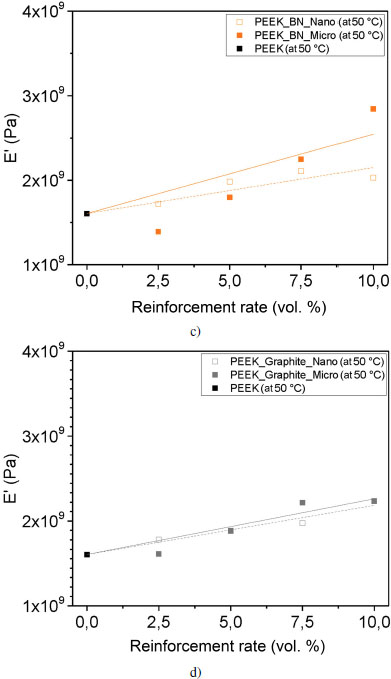
Figure 4.16. Evolution of the conservation modulus E′ at 50°C for each reinforcement: a) silicon carbide, b) alumina, c) boron nitride and d) graphite. For a color version of this figure, see www.iste.co.uk/bai/nanocomposites.zip
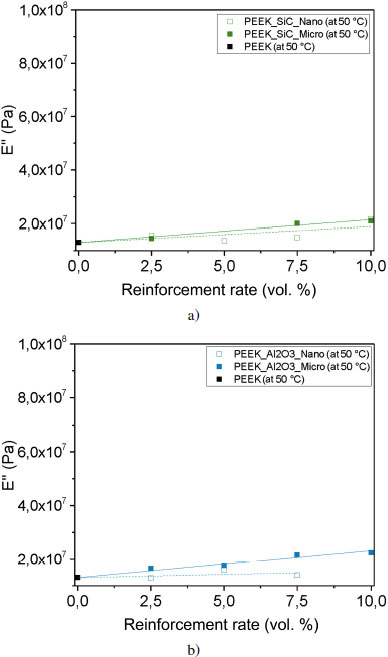
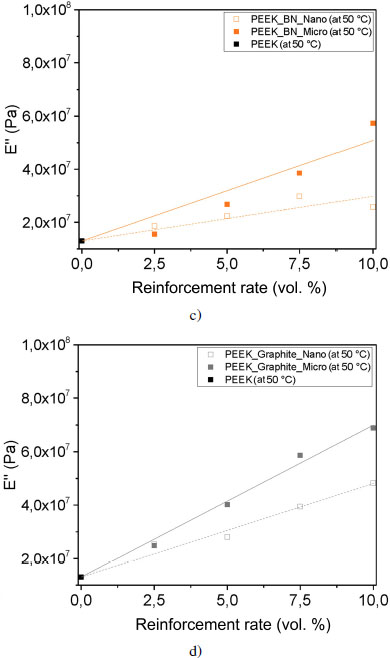
Figure 4.17. Evolution of loss modulus E” at 50°C for each reinforcement: a) silicon carbide, b) alumina, c) boron nitride and d) graphite. For a color version of this figure, see www.iste.co.uk/bai/nanocomposites.zip
Here again, BN stands out with a possibly prominent interphase role. In this interphase, the molecules are organized differently from the molecules in the volume, due to the interaction between the polymer chains and the surface of the reinforcement. The surface of the BN sheets is devoid of chemical groups capable of interacting with the polymer chain, which is why this material is called chemically inert. The BN/polymer interface is therefore not adherent, which leaves more mobility for the macromolecules, resulting in a decrease in mechanical stiffness at low levels. At higher rates, this tendency is compensated by the stiffness of the fillers themselves because the Young modulus of the fillers is much higher than that of the matrix. The mixing rule then becomes applicable.
The presence of this interphase in the vicinity of the fillers leads to a gain or loss of mobility for the macromolecules in the interphase. This change in mobility is measurable by rheometry, and can be seen in the tan δ curves shown in Figures 4.18(a) and (b). For most composites, tan δ is less than or equal to PEEK at the glass transition temperature, except for 10 volume % SiC nanofiller-reinforced samples and 5 volume % Al2O3 microfiller. For these two samples, the loss modulus E” is larger than the storage modulus E′. The energy dissipated due to molecular friction is higher.
The curvature that occurs at the beginning of the glass transition of the tan δ curves corresponds to the mobility of the macromolecules and can therefore be related to interfacial interactions. Since the shape of the curves is very similar for all fillers and proportions, let us focus on the curvature of the foot of the peak: for all SiC and alumina ratios, the glass transitions occur at the same temperature. Figures 4.19(c) and (d) show that the molecular mobility of the polymer reinforced with micrometric alumina is identical, regardless of the reinforcement rate.
On the contrary, for lamellar fillers, the glass transition starts at a lower temperature as the rate increases. At the interphase level, the bonds between the reinforcements and the matrix are weaker, as previously explained; we can conclude that adhesion between the reinforcement and the matrix is less intense. In addition, in the case of poor interfacial adhesion, stresses become concentrated at the interface and microcracks appear at the interface and propagate, leading to material failure. A good interfacial adhesion allows the transmission of mechanical stresses from the matrix to the filler; there is no interruption, the material will be more resistant to failure.
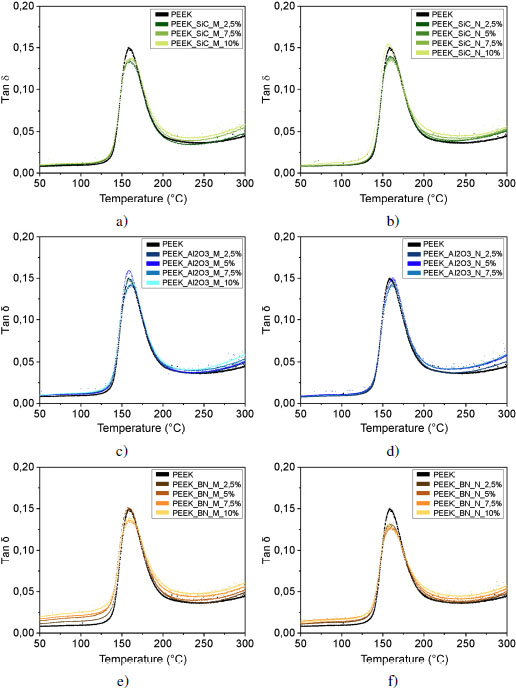
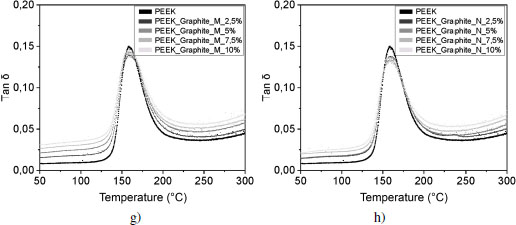
Figure 4.18. Evolution of tan δ for PEEK and a) and b) silicon carbide, c) and d) alumina and e) and f) boron nitride reinforced samples for micrometer-sized (a, c, e) and nanometer-sized (b, d, f) fillers, and graphite reinforced samples for g) micrometer and h) nanometer sized fillers. The deformation is 0.5% at 1 Hz. For a color version of this figure, see www.iste.co.uk/bai/nanocomposites.zip
4.3.6.2. Tribological study
A tribological test campaign is conducted using a commercial tribometer in a plane/ball configuration. The ball follows a reciprocal translation motion over a length of 10 mm and with a frequency of 5 Hz. A force of 25 N is applied. The friction coefficients are measured from the ratio of the tangential force to the applied force. The traces are measured and then observed to identify accommodation modes and the presence of debris.
In Figure 4.20, three groups of composites can be highlighted by comparing the depth of the traces and their friction coefficients. The group of materials at the bottom left represents moderate surface wear along with reduced energy dissipation. It brings together PEEK and composites based on 2.5 and 5 volume % graphite microparticles, as well as one containing 2.5 volume % graphite nanoparticles. Two other groups correspond to high and to severe wear. This last group contains traces with depths greater than 125 μm. Composites with h-BN and contents of 2.5 volume % of microparticles or 2.5 volume % and 5 volume % of nanoparticles are among the materials showing this severe wear. PEEK filled with 7.5 and 10 volume % of graphite, regardless of the filler size, also fall within this group.
When materials have a coefficient of friction between 0.3 and 0.45, then they dissipate little energy during tribological testing, and this leads to a small wear trace. When μ > 0.45, the traces are large in size.
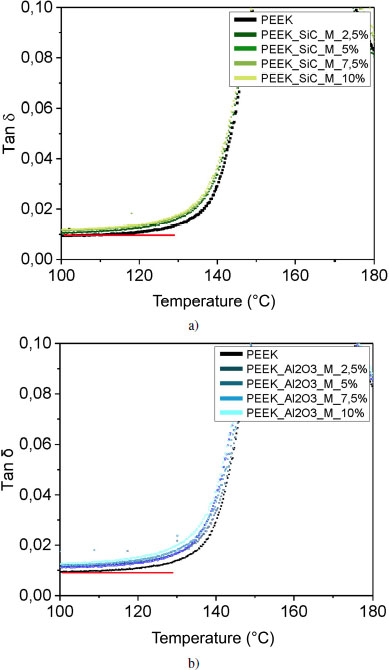
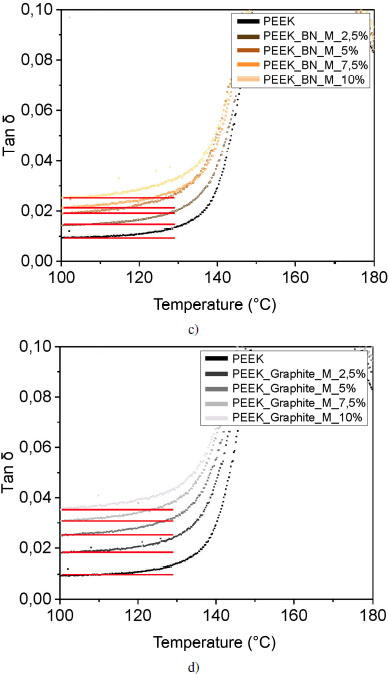
Figure 4.19. Evolution of tan δ for PEEK and reinforced samples: with a) silicon carbide, b) alumina, c) boron nitride and d) with micrometric size graphite. The deformation is 0.5% at 1 Hz. For a color version of this figure, see www.iste.co.uk/bai/nanocomposites.zip
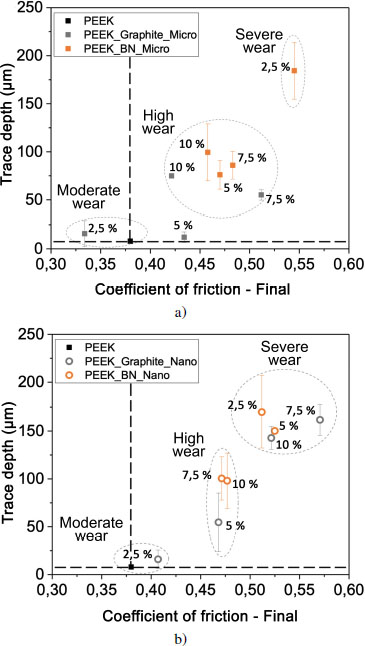
Figure 4.20. Evolution of depth according to the coefficient of friction for PEEK and lamellar particle-filled composites of a) micrometer and b) nanometer sizes. For a color version of this figure, see www.iste.co.uk/bai/nanocomposites.zip
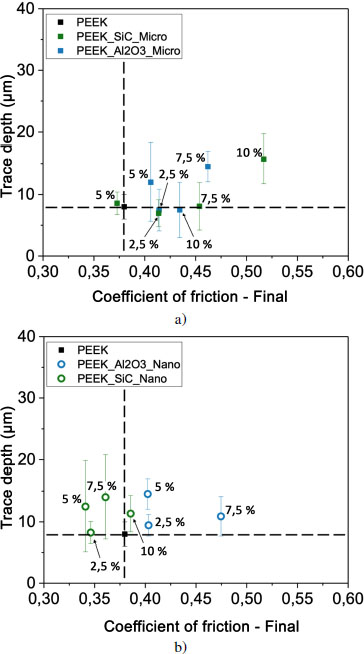
Figure 4.21. Evolution of depth according to the coefficient of friction for PEEK and composites filled with particulate fillers of a) micrometer and b) nanometer sizes. For a color version of this figure, see www.iste.co.uk/bai/nanocomposites.zip
Composites with the lowest graphite content have the lowest coefficient of friction and the smallest trace sizes. The addition of h-BN leads to the highest friction coefficients and the most severe wear.
With PEEK added with SiC or Al2O3 particles, the trace depths and friction coefficients are reduced and clustered around the PEEK values (Figure 4.21). This corresponds to the area that we have associated with moderate wear.
The materials have therefore retained their mechanical strength with the addition of alumina and SiC fillers, limiting the opening and deepening of the groove caused by the movement of the ball. Nevertheless, we verified the condition of the steel balls after the tribological tests and identified the presence of brown debris and scratches on their surfaces. The balls are therefore slightly damaged and emit material that oxidizes within the contact interface. Alumina and SiC particles, therefore, contribute to the degradation of the steel balls with which the composites are made to slide.
The modes of accommodation that prevail in these steel/PEEK matrix composites friction pairs are essentially plastic deformation modes. Depending on the type of filler added, they can be intense and produce high or severe wear. This is the case with BN. The accommodation modes are also dependent on the lamellar particle content and, in general, the higher the content, the more pronounced the plastic deformation.
With energy dissipation comparable to PEEK, the addition of Al2O3 or of SiC significantly reduces wear. In this case, the composite does not collapse under tribological loading, which is in good agreement with a reduced variation of the storage modulus E′, loss modulus E″ and damping factor tan δ for composites. Indeed, the complex moduli of the composites are very close to the moduli of the PEEK matrix. The plastic deformation in these composites is limited, but this reinforcement has a counterpart: the steel balls are slightly degraded.
Ultimately, optimized configurations can be proposed by employing micrometric graphite-filled PEEK composites at a volume ratio of less than 5%. This formulation would have the advantage of avoiding the emission of debris by the ball. Composites prepared with SiC or alumina will remarkably reduce wear compared to composites containing BN. It should be noted that particle size will not produce a significant effect on wear for these types of fillers. On the other hand, the use of SiC nanoparticles, between 2.5 and 7.5 volume %, will induce a decrease in the friction coefficient below that of PEEK and thus a lower dissipated energy during sliding.
4.4. Conclusion
Understanding the effect of size and filler/matrix interactions in nanocomposites is crucial to develop high-performance and durable materials. Keeping in mind that the role of the interphase on the physical properties of materials is undeniable, it remains difficult to predict these properties that differ for each couple filler/matrix. We sought to bring forward the influence of the size and nature of the fillers in microcomposite and PEEK matrix-based nanocomposite materials. For this purpose, samples loaded with SiC, alumina, graphite and BN were prepared using the melt process, using volume rates between 2.5 and 10%. The fillers are commercial and can be found in powder form, with each type of filler being classified as nanometric and micrometric in size. The initial particle size distribution was verified by laser granulometry: the distributions are wide and agglomerates are initially present, and all the more for nanoparticles. At the end of the melt mixing operation, the distribution of particles in the matrix was verified using SEM and image analysis. Here again, agglomerates were observed, but their size is smaller, especially for nanometric particles, which shows the efficiency of shear during mixing to break the aggregates and disperse the particles. As desired, the filler/matrix interface is more important in the case of nanocomposites.
The prepared composites were characterized by differential scanning calorimetry, thermal measurements, dynamic mechanical analysis and finally by frictional resistance measurements. The glass transition of PEEK, which reflects the mobility of the macromolecules, decreases by a few degrees in the presence of SiC and alumina for the highest levels, suggesting a stiffening of polymeric chains. Nano-sized fillers do not affect the matrix mobility more than micrometer sizes, despite the larger contact area. For graphite and BN, the results are more scattered, with deviations of 10°C with respect to the reference PEEK, which does not allow us to conclude about the existence of an interphase. Despite the glass transition being the expression of cooperative motions, it is likely that the mobility of macromolecules is inhomogeneous in the material, with localized less rigid areas. The crystallinity, initially 35% for PEEK, decreases for higher concentrations regardless of filler type. This decrease is more important for SiC, which reflects a hindrance caused by the surface of the particles, for the macromolecules to self-organize. The creation of weak bonds between the SiC and polymer chain could be at the origin of this problem.
For all fillers, the thermal conductivity of PEEK is slightly increased, due to the high conductivity of the selected particles. However, the increase does not follow a linear relationship with the concentration, which confirms the complexity of the heat transfer phenomenon that results from the movement of electrons and phonons. For graphite, this increase is noticeable and seems to mark the appearance of a percolating network, even if the concentrations studied remain too low to confirm it. The micrometric particles seem to bring a slight gain in heat transfer compared to the nanometric particles. The presence of large particles that constitute high conductivity zones that act as thermal bridges in the material could explain these results.
The dynamic mechanical analysis in the linear viscoelastic regime highlights the reinforcement provided by the particles, which themselves have much larger Young’s moduli than the PEEK matrix. The increase in the storage modulus E′ is almost linear with the volume rate, except for BN and graphite. Indeed, the evolution of their modulus E′ follows a linearity without passing through the PEEK value. BN is inert and does not establish chemical bonds with macromolecules. It is likely that adhesion is non-existent at the interface, suggesting an interphase effect in which the molecules would have more mobility. This gain in mobility was not shown by DSC, but because of the ratio E′/E″, that is to say, of the tangent loss factor δ. The curves representing the loss factor are very similar for all materials and similar in shape to that of PEEK, which shows the absence of a population of chains with drastically different behavior. Nevertheless, a close study of the loss factor peak shows that the curvature marking the onset of the glass transition appears a few degrees earlier for BN and graphite, which supports this hypothesis. Surprisingly, this interphase effect seems to be more pronounced for micrometric particles than for nanometric ones.
Finally, the effect of the size and nature of the fillers on the frictional properties was studied. A size effect is undeniable for SiC and alumina: their friction coefficient is lower for nanometric fillers. Therefore, the energy dissipated during friction in these materials will be less, which allows for energy savings during use. Concerning their wear, measured here by the shape of the wear trace, the nature of the load predominates. A distinction must be made between lamellar fillers – graphite and BN – which cause high wear, and particulate fillers – SiC and alumina – for which wear is low.
Finally, this work shows that nanometric sizes do not bring the expected gain on thermal and mechanical properties, but allow a better understanding of the role of filler/matrix interactions. The effect of the nature of the filler and in particular of the interfacial interaction, and namely of the bonds established between the particles and the macromolecules, seems to be dominant over the size effect. Improving the dispersion and exfoliation state of the fillers is essential to increase the contact surface and thus benefit more from the effects of the filler/matrix interphase. However, by using the melt mixing process and the materials studied, it will be difficult to do better due to the high viscosity of PEEK and its sensitivity to thermo-oxidative degradation.
4.5. References
Attwood, T.E., Dawson, P.C., Freeman, J.L., Hoy, L.R.J., Rose, J.B., Staniland, P.A. (1981). Synthesis and properties of polyaryletherketones. Polymer, 22(8), 1096–1103 [Online]. Available at: https://linkinghub.elseviercom/retrieve/pii/0032386181902998.
Bedi, H.S., Tiwari, M., Agnihotri, P.K. (2018). Quantitative determination of size and properties of interphases in carbon nanotube-based multiscale composites. Carbon, 132, 181–190 [Online]. Available at: https://linkinghub.elsevier.com/retrieve/pii/S0008622318301830.
Bernal, J. (1924). The structure of graphite. Proceedings of the Royal Society A, 106, 749.
Chen, E.J.H. and Hsiao, B.S. (1992). The effects of transcrystalline interphase in advanced polymer composites. Polymer Engineering & Science, 32(4), 280–286 [Online]. Available at: https://onlinelibrary.wiley.com/doi/abs/10.1002/pen.760320408.
Choi, J., Shin, H., Yang, S., Cho, M. (2015). The influence of nanoparticle size on the mechanical properties of polymer nanocomposites and the associated interphase region: A multiscale approach. Composite Structures, 119, 365–376 [Online]. Available at: https://linkinghub.elsevier.com/retrieve/pii/S0263822314004474.
Crosby, A.J. and Lee, Y. (2007). Polymer nanocomposites: The “nano” effect on mechanical properties. Polymer Reviews, 47, 217–229.
David, L. and Etienne, S. (1992). Molecular mobility in para-substituted polyaryls 1. Sub-(Tg) relaxation phenomena in poly(aryl ether ether ketone). Macromolecules, 25(17), 4302–4308 [Online]. Available at: https://pubs.acs.org/doi/abs/10.1021/ma00043a010.
Decup, M. (2010). Impact des procédés industriels de traitement sur les propriétés diélectriques des substrats d’alumine utilisés dans les modules de commutation haute tension. PhD Thesis, Université Toulouse 3 Paul Sabatier, Toulouse.
Díez-Pascual, A.M., Guan, J., Simard, B., Gómez-Fatou, M.A. (2012). Poly(phenylene sulphide) and poly(ether ether ketone) composites reinforced with single-walled carbon nanotube buckypaper II. Mechanical properties, electrical and thermal conductivity. Composites Part A: Applied Science and Manufacturing, 43(6), 1007–1015 [Online]. Available at: https://linkinghub.elsevier.com/retrieve/pii/S1359835X11003629.
Domenech, T., Zouari, R., Vergnes, B., Peuvrel-Disdier, E. (2014). Formation of fractallike structure in organoclay-based polypropylene nanocomposites. Macromolecules, 47(10), 3417–3427 [Online]. Available at: https://pubs.acs.org/doi/10.1021/ma5001354.
Doumeng, M., Makhlouf, L., Berthet, F., Marsan, O., Delbé, K., Denape, J., Chabert, F. (2021). A comparative study of the crystallinity of polyetheretherketone by using density, DSC, XRD, and Raman spectroscopy techniques. Polymer Testing, 93, 106878 [Online]. Available at: https://linkinghub.elsevier.com/retrieve/pii/S0142941820321073.
Drzal, L.T., Rich, M.J., Koenig, M.F., Lloyd, P.F. (1983). Adhesion of graphite fibers to epoxy matrices II. The effect of fiber finish. The Journal of Adhesion, 16, 133–152.
Falin, A., Cai, Q., Santos, E., Scullion, D., Qian, D., Zhang, R., Yang, Z., Huang, S., Watanabe, K., Taniguchi, T., Barnett, M., Chen, Y., Ruoff, R., Li, L. (2017). Mechanical properties of atomically thin boron nitride and the role of interlayer interactions. Nature Communications, 8(1) [Online]. Available at: http://www.nature.com/articles/ncomms15815 and https://creativecommons.org/licenses/by/4.0/deed.fr.
Flory, P.J. (1953). Principles of Polymer Chemistry. Cornell University Press, New York.
Goyal, R., Tiwari, A., Mulik, U., Negi, Y. (2007). Novel high performance Al2O3/poly(ether ether ketone) nanocomposites for electronics applications. Composites Science and Technology, 67(9), 1802–1812 [Online]. Available at: https://linkinghub.elsevier.com/retrieve/pii/S0266353806004143.
Jesson, D.A. and Watts, J.F. (2012). The interface and interphase in polymer matrix composites: Effect on mechanical properties and methods for identification. Polymer Reviews, 52, 321–354.
Kadiyala, A.K. and Bijwe, J. (2018). Poly (ether ether ketone)-silicon carbide composite adhesives for elevated temperature applications of stainless steel joints. Composites Science and Technology, 155, 177–188 [Online]. Available at: https://linkinghub.elsevier.com/retrieve/pii/S0266353817324442.
Kadiyala, A.K., Bijwe, J., Kalappa, P. (2018). Investigations on influence of nano and micron sized particles of SiC on performance properties of PEEK coatings. Surface and Coatings Technology, 334, 124–133 [Online]. Available at: https://www.sciencedirect.com/science/article/pii/S0257897217311726.
Karger-Kocsis, J., Mahmood, H., Pegoretti, A. (2015). Recent advances in fiber/matrix interphase engineering for polymer composites. Progress in Materials Science, 73, 1–43 [Online]. Available at: https://linkinghub.elsevier.com/retrieve/pii/S0079642515000328.
Khostavan, S., Fazli, M., Ahangari, M.G., Rostamiyan, Y. (2019). The effect of interaction between nanofillers and epoxy on mechanical and thermal properties of nanocomposites: Theoretical prediction and experimental analysis. Advances in Polymer Technology, 8156718.
Kronberg, M.L. (1957). Plastic deformation of single crystals of sapphire: Basal slip and twinning. Acta Metallurgica, 5(507), 507–524.
Kuo, M.C., Tsai, C.M., Huang, J.C., Chen, M. (2005). PEEK composites reinforced by nano-sized SiO2 and Al2O3 particulates. Materials Chemistry and Physics, 90(1), 185–195 [Online]. Available at: http://www.sciencedirect.com/science/article/pii/S0254058404005218.
Lafon-Placette, S. (2015). Performances tribologiques d’un carbure de silicium pour paliers d’étanchéité dynamique fonctionnant en conditions sévères. PhD Thesis, Institut National Polytechnique, Toulouse.
Lambrecht, W.R.L., Limpijumnong, S., Rashkeev, S., Segall, B. (1997). Electronic band structure of SiC polytypes: A discussion of theory and experiment. Phys. Stat. Sol. B, 202(1), 5–33 [Online]. Available at: https://onlinelibrary.wiley.com/doi/abs/10.1002/1521-3951%28199707%29202%3A1%3C5%3A%3AAID-PSSB5%3E3.0.CO%3B2-L.
Lee, M.-Y., Wang, T.-Y., Tsai, J.-L. (2016). Mechanical properties of nanocomposites with functionalized graphene. Journal of Composite Materials, 50(27), 3779–3789.
Lefevre, J. (2008). Étude des effets d’irradiation dans le polytype cubique du carbure de silicium par les techniques spectroscopiques de photoluminescence et de résonance paramagnétique électronique. PhD Thesis, École Polytechnique, Palaiseau.
Liu, Y. and Kumar, S. (2014). Polymer/carbon nanotube nano composite fibers: A review. ACS Applied Materials & Interfaces, 6(9), 6069–6087 [Online]. Available at: https://pubs.acs.org/doi/10.1021/am405136s.
Normand, G., Peuvrel-Disdier, E., Vergnes, B. (2016). Matrix degradation during high speed extrusion of polypropylene/clay nanocomposites – Influence on filler dispersion. International Polymer Processing, 31(4), 508–516 [Online]. Available at: https://www.degruyter.com/view/journals/ipp/31/4/article-p508.xml.
Panda, J.N., Bijwe, J., Pandey, R.K. (2019). Optimization of graphite contents in PAEK composites for best combination of performance properties. Composites Part B: Engineering, 174 [Online]. Available at: https://linkinghub.elsevier.com/retrieve/pii/S1359836819311709.
Pauling, L. (1932). The nature of the chemical bond IV, the energy of single bonds and the relative electronegativity of atoms. Journal of American Chemical Society, 54(9), 3570–3582.
Rae, P.J., Brown, E.N., Orler, E.B. (2007). The mechanical properties of poly(ether-ether-ketone) (PEEK) with emphasis on the large compressive strain response. Polymer, 48(2), 598–615 [Online]. Available at: https://linkinghub.elsevier.com/retrieve/pii/S0032386106012742.
Ramsdell, L. (1947). Studies on silicon carbide. American Mineralogist, 32, 19.
Roussel, N. (2013). Optimisation du dopage d’alumines nanométriques et frittage par SPS. Application aux céramiques transparentes. PhD Thesis, Université Toulouse 3 Paul Sabatier, Toulouse.
Saleem, H., Edathil, A., Ncube, T., Pokhrel, J., Khoori, S., Abraham, A., Mittal, V. (2016). Mechanical and thermal properties of thermoset-graphene nanocomposites. Macromolecular Materials and Engineering, 301(3), 231–259 [Online]. Available at: http://doi.wiley.com/10.1002/mame.201500335.
Savage, R. and Schaefer, D. (1956). Vapor lubrication of graphite sliding contacts. Journal of Applied Physics, 27(2), 136–138.
Shiu, S.-C. and Tsai, J.-L. (2014). Characterizing thermal and mechanical properties of graphene/epoxy nanocomposites. Composites Part B: Engineering, 56, 691–697 [Online]. Available at: https://linkinghub.elsevier.com/retrieve/pii/S1359836813005209.
Talbi, F. (2010). Étude des phénomènes de conduction et de rupture diélectrique dans les céramiques à haute teneur en alumine. PhD Thesis, Université Mouloud Mammeri, Tizi-Ouzou.
Termoss, H. (2009). Préparation de revêtements de nitrure de bore (BN) par voie polymère précéramique : étude des paramètres d’élaboration : caractérisations physico-chimiques. PhD Thesis, Université Claude Bernard–Lyon 1, Lyon.
Terrones, M., Martín, O., González, M., Pozuelo, J., Serrano, B., Cabanelas, J.C., Vega-Díaz, S.M., Baselga, J. (2011). Interphases in graphene polymer-based nanocomposites: Achievements and challenges. Advanced Materials, 23(44), 5302–5310 [Online]. Available at: http://doi.wiley.com/10.1002/adma.201102036.
Yacoby, A. (2011). Graphene: Tri and tri again. Nature Physics, 7(12), 925–926 [Online]. Available at: http://www.nature.com/articles/nphys2166.
Zaidi, H., Robert, F., Paulmier, D. (1995). Influence of adsorbed gases on the surface energy of graphite: Consequences on the friction behaviour. Thin Solid Films, 264(1), 46–51 [Online]. Available at: https://linkinghub.elsevier.com/retrieve/pii/0040609095066063.
Zouari, R., Domenech, T., Vergnes, B., Peuvrel-Disdier, E. (2012). Time evolution of the structure of organoclay/polypropylene nanocomposites and application of the timetemperature superposition principle. Journal of Rheology, 56(4), 725–742 [Online]. Available at: http://sor.scitation.org/doi/10.1122/1.4708602.