
3
Size Effects on Physical and Mechanical Properties of Nano-Reinforced Polymers
Fahmi BEDOUI1, Adoté Sitou BLIVI1, Benhui FAN2 and Djimédo KONDO3
1 Université de technologie de Compiègne, Sorbonne University, France
2 CentraleSupélec, Paris-Saclay University, Gif-sur-Yvette, France
3 Institut Jean Le Rond d’Alembert, Sorbonne University, Paris, France
The interaction of particles with the matrix will be quantified at different scales. It should be noted that since the volume fraction of the different samples was kept constant, the effects observed will then be attributed to the effect of size. This effect will be investigated on different aspects – mechanical, physical and thermal – in order to understand the effect of the particle size across the existing scales in the material.
3.1. Size effect on the glass transition temperature
3.1.1. Differential scanning calorimetry
Differential scanning calorimetry (DSC) is a technique used to study the thermal properties of materials, including glass transition and decomposition temperature.
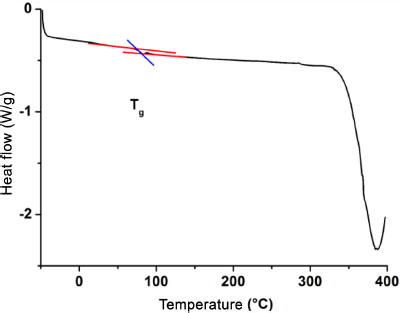
Figure 3.1. DSC curve of 4%/60 nm nanocomposites
The tests were performed on a DSC Q100 machine with hermetic aluminum crucibles under a nitrogen atmosphere to avoid any reaction with the external environment. The samples, which were previously baked at 40°C, were subjected to two heating cycles. The first cycle, which goes from –50°C to 200°C with a heating rate of 10°C/min, and then to –50°C, makes it possible to eliminate the residual traces of moisture and solvent that could pollute the measurements. The measurement of the temperature of the vitreous transition (Tg) is made during the second cycle carried out between –50°C and 400°C (limit temperature of the machine) with a speed of 10°C/min. Figure 3.1 shows the DSC curve of the 4%/60 nm nanocomposite. Three transformation zones can be observed on the curve. These transformations occur in the matrix because the temperature of the first transformation of silica is about 600°C. The three observed transformations correspond to the secondary (≈ 25°C), vitreous (≈ 80°C) and decomposition (≈ 387°C) transition zones of the matrix, respectively. The secondary transition is due to local movement of the matrix chains. The vitreous transition is that of the cooperative movement of the chains. The absence of a crystallization peak is clearly visible and shows that the matrix retains its amorphous structure even with nanoparticles of nanometric size. The effect of size on the glass transition temperature will be the point of focus of this work. The determination of the Tg value is carried out using the TA Universal Analysis software provided by the manufacturer of the DSC machine. The procedure consists of indicating the start (Onset) and end (Offset) points of the transition zone and recovering at the output the corresponding Tg value. The tests were performed three to six times for each type of material and the result presented in this chapter is the average thereof.
Figure 3.2 shows the glass transition zones (DSC) of the 4% filled nanocomposites. It can be observed that between the 500 nm and 15 nm curves, there is a slight shift of the transition zone toward higher temperature values. The Tg values are determined and averaged over three trials.
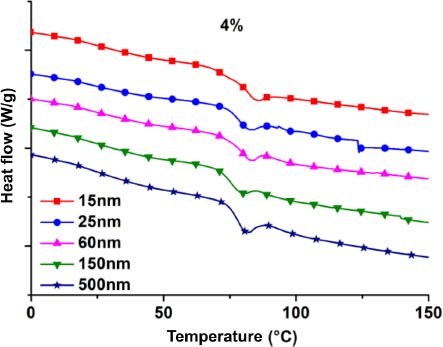
Figure 3.2. DSC curves: glass transitions zones of 4% filled nanocomposites
3.1.2. Dynamic mechanical analysis
The tests were performed on a DMA+ 150 machine from Metravib with a 150 N force cell. It can perform tensile, compression, shear tests, etc., by controlling the strain rate and the temperature of the specimen. The tests are done in tractioncompression without imposing static strain but only a dynamic deformation of 5 × 10⁻⁴. The frequency is 1 Hz and the studied temperature range is from 20°C to 120°C, with a heating rate of 2°C/min.
Figure 3.3 represents the tanδ curves of the 4% filled nanocomposites of the different nanoparticle sizes. The vitreous transition temperature corresponds to the temperature of the maximum tanδ. Two observations can be made with the decrease in the nanoparticle size. There is a decrease in the maximum tanδ value and an increase of the Tg. The decrease in the maximum of tanδ is reflected in the material by a decrease in its dissipative properties with respect to those of conservation tanδ = E”/E’ It follows that the decrease in the size of the nanoparticles hardens the material. The same effect is visible on the thermal properties, where an increase in the Tg is observed with the decrease in the size of the nanoparticles. For each type of material, the Tg values are determined and averaged.
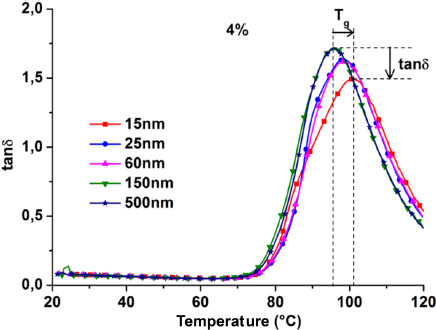
Figure 3.3. Damping factor (tanδ) curves of 4% filled nanocomposites
3.1.3. Wide-angle temperature synchrotron X-ray diffraction (WAXS)
X-ray diffraction (XRD) is a physicochemical analysis technique that consists of sending a beam onto a sample and recovering, through detectors, the different wavelengths (λ) that have reacted with the elements of the sample. The value of the wavelengths is used to determine the position of the elements that have interacted with the beam, and also to calculate the distance that separates them by the following relations:
This test, when performed in the laboratory, requires a significant exposure time to the beam, which can cause local heating in polymers that have a very temperature sensitive microstructure. This heating can locally modify the microstructure, especially at high temperatures where chain mobility is more important. Instead of conventional X-ray diffraction, we have opted for synchrotron X-ray diffraction tests, which feature a power that allows for very short exposure times (less than a second) and for making observations while varying the temperature of the sample (Ryan et al. 1997; Barnes et al. 2000). The tests were performed on the 5-ID-DND line of the synchrotron at the Argonne1 National Laboratory.
During the test, the sample is placed in an aluminum crucible, which is held in a DSC cell through which the beam passes. The DSC tests are performed between 30 and 150°C with a heating rate of 10°C/min. We performed observations with a step of 1°C and a beam exposure time of 0.005 s. The tests are performed with the empty crucible, the different nanoparticle sizes and all nanocomposites. For each material, the data are grouped (Figure 3.4) and processed to compare the evolution of the diffraction curves (intensity versus diffusion vector) as a function of temperature. The treatment consisted of subtracting from the sample data those of the crucible and the DSC cell used during the test. The crucible and the cell also diffract and it is important to subtract their data to have the diffraction data of the content (nanoparticles or nanocomposites).
Figure 3.4 shows the evolution of the corrected wide-angle diffraction curves of the 4%/25 nm nanocomposite as a function of temperature. In the figure, we can note, independently of the temperature, the peaks presenting a diffuse halo characteristic of an amorphous microstructure. It shows that the matrix remained amorphous in the presence of nanoparticles and at high temperatures. An increase in the value of the maximum intensity can be observed with the increase in temperature. A shift is also observed in the position of the peak at maximum intensity toward low values of q when the temperature increases. At 30°C, the position of the peak at maximum intensity is around q = 0.96 Å–1 while it is at q = 0.86 Å–1 when the temperature is 150°C. All of these observations are indicators of change occurring in the material and can be used to determine the vitreous transition temperature (Nguyen 2014; Gelineau 2015). The silica used has its first transition point above 600°C, which is to say that all of these observations are relative to the microstructure of the matrix only. We shall use this information to determine the temperature zones where the matrix changes behavior. The process utilized (Ryan et al. 1997; Gelineau 2015) consists of decomposing the experimental signal into Gaussians, in order to distinguish the contribution of the matrix from that of the nanofillers. The transition zones are then targeted by summing the area of each of the matrix Gaussians and their variation with respect to temperature. However, in the case of most of our materials, this technique did not allow us to obtain a variation of the area under the matrix curves with respect to temperature, thus making it difficult to determine the transition zone. The same observation was also made in the work of Gélineau (2015). This does not mean that the transition zone is non-existent. The baseline used at the time of deconvolution could have an effect on the area of the Gaussian. As a matter of fact, the starting and ending points of the signal change with temperature, making the baseline dynamic. We believe that this change in baseline with temperature affects the area under the curves. In order to avoid this problem, we are interested in the evolution of the characteristic lengths as a function of temperature through the position of the peaks that does not depend on the baseline.
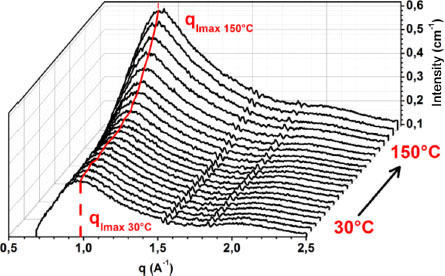
Figure 3.4. Diffraction patterns versus temperature of the 4%/25 nm nanocomposite
Polymeric materials are very sensitive to temperature. This sensitivity is reflected in microstructural changes, and more particularly in the characteristic lengths. Nevertheless, the chain mobility in the polymer does not occur at the same temperature. Indeed, polymers have different types of transitions, such as tertiary or gamma (γ), secondary or beta (β) and principal or alpha (α), which occur at different temperatures and mobilize different types of chains. The volume of polymers changes under the action of temperature. This change in volume is due to an evolution in intermolecular distances. The intermolecular distances represent the lengths of the weak interactions (Van der Waals) that are the first to be stressed in the polymer. To determine the main transition temperature of our materials by the temperature DRX test, we followed the evolution of the interchain distance according to temperature. The diffraction curves obtained according to temperature were deconvoluted and the position of peak 1 was located. The corresponding distances are calculated using Bragg’s law. Figure 3.5 represents the evolution of the intermolecular distance (d1) according to temperature for nanocomposites filled with 4% of particles of sizes 15 nm, 60 nm and 500 nm. The temperature values are on the abscissa and the intermolecular distance on the ordinate.
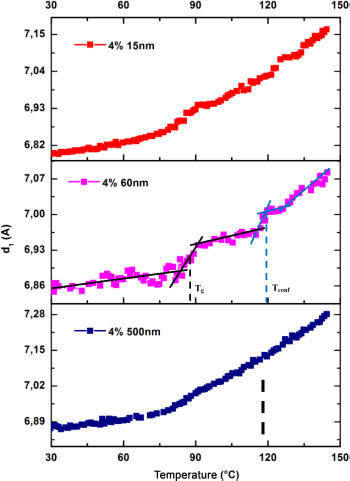
Figure 3.5. Intermolecular distance versus temperature for the 4% nanofilled matrix of 15 nm, 60 nm and 500 nm particle sizes
Then, for each size, an increase of d1 can be noted with the increase in the temperature. This evolution can be classified in different zones: stability zones where the variation of d1 is very progressive and others of instability where the slope changes. The increase in the slope results from a greater chain mobility at the corresponding temperature values. The vitreous transition is an area where all of the chains of the matrix acquire a greater mobility. We consider the areas of rapid change in the slope as transition zones and the average of the starting and ending temperatures of the zone as the transition temperature. On these curves, two transition zones were observed. The first one is close to the glass transition zone observed in DSC and the second is at a higher temperature. For the first transition zone, the transition temperature determined is not a vitreous transition temperature in the usual sense. However, given its proximity to that measured in DSC, we shall assimilate it to the Tg. The second transition zone which was not visible in DSC can be the transition zone of the confined chains. These chains have a reduced mobility compared to the other chains because of their confinement in the subsurface of the particles. We note this temperature Tconf to designate the confinement. As in the DSC and dynamic mechanical analysis (DMA) cases, the values of the Tg are indicated in Table 3.1 and represented in Figure 3.6. The Tconf values are also recorded in Table 3.1 and their evolution with particle size is shown in Figure 3.7.
In Figure 3.6, the curves of the Tg of the PMMA/0 matrix and of the nanocomposites are grouped according to the size of the nanoparticles for the four 2% and 4% volume fractions. These curves are obtained by using the three different thermal analysis techniques (DSC, DMA and WAXS-DSC). The mixed two-dot and long dashed lines at the bottom of each curve represent the Tg values of PMMA/0 obtained in DSC and DMA, respectively. It can be seen that the trend of the curves is the same from one volume fraction to another, even though the analysis technique is different. An increase in the Tg value is thus observed with the decrease in the nanoparticle sizes (size effect). This trend can be broken down into two stages: a first stage between 500 nm and 60 nm where the increase is small, and a second between 60 nm and 15 nm where the increase is more pronounced. In Figure 3.6, we notice that the Tg of the nanocomposites is higher than that of the matrix, regardless of the analysis technique. This may be due to different phenomena such as the hydrogen bonds that are created between the matrix and the nanoparticles (Wang et al. 1991; Tripp and Hair 1992). Due to the -OH groups existing on their surface, the silica nanoparticles create hydrogen bridges with the carbonyl groups of the matrix, thus making the nanocomposite matrix less sensitive to temperature compared to the matrix alone.
The two-phase increase in Tg between nanocomposites, as explained above, is due to the hydrogen-nanoparticle-matrix bonds and the size of the nanoparticles. Indeed, the number of -OH groups present on the surface of nanoparticles increases with the decrease in the nanoparticle size (Tripp and Hair 1992). The interest in using spherical nanoparticles comes from their large area-volume ratio, and this ratio is even greater as the size of the nanoparticles decreases. Therefore, large nanoparticles, although better dispersed than small nanoparticles, present a lower surface-to-volume ratio than small nanoparticles and form fewer hydrogen bonds with the matrix chains. The size effect thus becomes more visible at the size where the interactions are preponderant in the nano-composite, and this critical size seems to be between 60 nm and 100 nm in our study. This critical size region is the same as the one observed in the morphological characterization. The interparticle distance also decreases with the decrease of the particle size, which leads to a confinement of the chains. The confined area increases with the decrease of the size. Another advantage of small nanoparticles resides in their small size. This small size allows them to better adhere to the matrix. They form a homogeneous system with the matrix and reinforce their interactions, which increases the Tg value. Obtaining such a mechanism requires a good nanoparticle dispersion (2% and 4% cases). On the other hand, their small size increases their reactivity and when they are too close to each other (poorly dispersed), they tend to attract themselves and agglomerate. In this case, they reduce their bonding surface with the matrix and the Tg value drops or varies little. This is the case for the 6% volume fraction where it was observed, with the three techniques used, that between 60 nm and 15 nm the curve falls or forms a plateau. In the case of the theoretical 8% fraction, the difference between the volume fractions measured for the different particle sizes – 11.7 ± 2.19% for 15 nm particles and 8.59 ± 0.2 for 150 nm particles (Table 3.1), namely a difference of 3.11% – does not allow the increase in Tg to be attributed to the size of the particles. This increase is also due to a reinforcing effect because of the 3.11% difference in volume fractions.
The nanoparticles, due to the strong interactions that they establish with the chains that surround them, prevent the transition from occurring at the same temperature as the material in the bulk. Indeed, contrary to the chains located in the matrix, the confined ones need more energy (calorific) to break the hydrogenic bridges that they establish with the nanoparticles before starting their mobility. It takes place at staggered temperatures, which explains the appearance of the second transition zone. Nonetheless, the second transition is not observed for some of the 2%-loaded nanocomposites. The low volume fraction and large sizes did not help confine the chains, as can be seen in Figure 3.7. As observed for the Tg, we also noted a dependence of the confinement temperature Tconf on the nanoparticle size. The constancy of a volume fraction accompanied by the decrease in the nanoparticle size increases the number of nanoparticles and reduces the interparticle distances, which increases the probability of creating confinement sites. The more confinement sites there are in the material, the more confined the chains will be and the higher the Tconf value will be (Table 3.1).
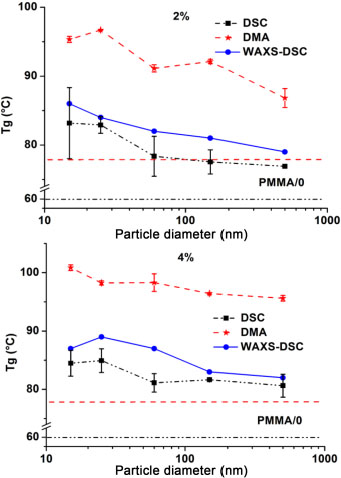
Figure 3.6. Glass transition temperature of nanocomposites as a function of the nanoparticle size for 2% and 4% volume fractions
The progressive decrease in the value of d1 at 30°C can be noted with the decrease in the nanoparticle size. Indeed, its value is 6.9 Å in the case of 500 nm nanoparticles and it decreases progressively until it reaches 6.8 Å for 15 nm nanoparticles (Wang et al. 2008). This decrease in d1 again shows the confinement of the matrix exposed in Chapter 2. In that chapter, the evolution of d1 was used to show matrix confinement. However, as explained in the same chapter, the evolution of d1 can also be used to show the same phenomenon.
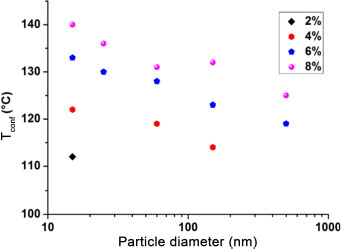
Figure 3.7. Evolution of the transition temperature of confined domains as a function of the nanoparticle size
Table 3.1. Tg and Tconf values of the different materials
| Volume fraction | Size (nm) | Tg°C) | Tconf (°C) | ||
| DSC | DMA | WAXS | WAXS | ||
| 2% | 15 | 83 ±5 | 96 ± 1 | 86 | 112 |
| 25 | 83 ±1 | 97 ±0 | 84 | – | |
| 60 | 78 ±3 | 91 ± 1 | 82 | – | |
| 150 | 77.5 ± 2 | 92 ±1 | 81 | – | |
| 500 | 77 ±0 | 87 ±1 | 79 | – | |
| 4% | 15 | 84 ±2 | 101 ±1 | 87 | 122 |
| 25 | 85 ±2 | 98 ±1 | 89 | – | |
| 60 | 81±2 | 98 ±2 | 87 | 119 | |
| 150 | 82 ±1 | 96 ±1 | 83 | 114 | |
| 500 | 81 ±2 | 96 ±1 | 82 | – | |
| 6% | 15 | 83 ±2 | 101 ±1 | 90 | 133 |
| 25 | 84 ±4 | 100 ± 3 | 82 | 130 | |
| 60 | 85 ±1 | 96 ±1 | 90 | 128 | |
| 150 | 84 ±1 | 95 ± 0 | 84 | 123 | |
| 500 | 82 ±3 | 96 ± 0 | 82 | 119 | |
| 8% | 15 | 85 ± 5 | 100 ± 1 | 103 | 140 |
| 25 | 86 ±4 | 100 ± 0 | 99 | 136 | |
| 60 | 88 ±4 | 98 ± 2 | 91 | 131 | |
| 150 | 86 ±3 | 97 ± 2 | 88 | 132 | |
| 500 | 82 ±1 | 95 ± 0 | 87 | 125 | |
Tg and uncertainty values are rounded by default or by excess.
3.2. Thermal stability
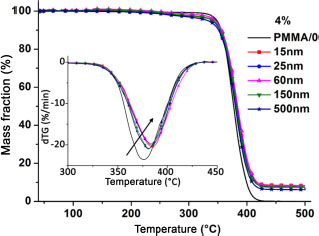
Figure 3.8. Thermogravimetric analysis and mass loss curves of PMMA/0 and its 4% loaded nanocomposites of different nanoparticles sizes
The addition of nanofillers to the polymer showed a dependence of Tg on nanoparticle size. The nanoparticle size can also affect the decomposition temperature of the matrix, which governs the polymer thermal stability. The stability study was performed by thermogravimetric analysis under controlled atmosphere (nitrogen). The study consists of studying the different stages of mass loss of the sample (TG) and noting the temperature at which the polymer loses 50% of its mass (dTG). The dTG curve is the derivative of the mass loss curve (TG) and is used for measuring the decomposition kinetics of the polymer. The thermogravimetric analysis curves and mass loss derivatives of PMMA/0 and its nanocomposites filled with 4% of different nanoparticle sizes are shown in Figure 3.8. As for PMMA/0, the thermogravimetric analysis curves of the nanocomposites show a one-step degradation, and this degradation corresponds to the scission of the main chain bonds of the polymer matrix, as shown in the work by Kashiwagi et al. (1985). These curves do not help to conclude on a possible effect of presence or size of nanoparticles on the matrix decomposition temperature. However, the derived mass loss curves showed a slight increase in temperature at 50% decomposition (Table 3.2). The temperature for 50% decomposition of the PMMA/0 matrix is 376°C. In the case of 4%/500 nm and 4%/15 nm nanocomposites, the temperatures are 380°C and 385°C, respectively, representing gains of 4°C and 9°C over the matrix. This fact gives a gain of 5°C by decreasing the size from 500 to 15 nm. The size effect, although observed for 4% and 6%, appears to be non-existent at the other volume fractions (2% and 8%). For 2%, a gain of 4°C is observed with respect to the matrix, regardless of the size of the nanoparticles. It is 11°C for 8% fillers for almost all sizes. The improvements in the thermal stability of nanocomposites are due to the fact that the nanoparticles act as a barrier by preventing the residues produced during the reaction from escaping, as observed by Kashiwagi et al. (1985).
Table 3.2. T50% decomposition temperature values of nanocomposites under nitrogen
| Size (nm) | 2% | 4% | 6% | 8% |
| 15 | 381 ± 1 | 385 ± 1 | 387 ± 1 | 387 ± 1 |
| 25 | 381 ± 1 | 384 ± 1 | 387 ± 1 | 387 ± 1 |
| 60 | 382 ± 1 | 384 ± 1 | 388 ± 1 | 390 ± 1 |
| 150 | 381 ± 2 | 381 ± 1 | 383 ± 1 | 388 ± 1 |
| 500 | 380 ± 1 | 380 ± 1 | 381 ± 1 | 387 ± 1 |
3.3. Effect of size on mechanical properties
Physicochemical characterization has shown that the size of the nanoparticles affects the vitreous transition and decomposition temperatures of the matrix. This effect occurs through the microstructural modification that the variation of the nanoparticle size implies. In the same way that size variation modifies the physicochemical properties, it could also have an effect on the mechanical properties, namely the elastic and viscoelastic properties. These size-dependent properties were measured with adapted tests. The elastic properties were measured by means of instrumented tensile tests and the viscoelastic properties by DMA tests. The testing conditions and results will be presented below.
3.3.1. Quasi-static tests: elastic properties
The effect of nanoparticle size on the elastic properties of nanocomposites was determined through an instrumented tensile test campaign following the ISO 527 standard. Dumbbell-like test specimens were utilized with an effective length of 30 mm, a width of 5 nm and a thickness of 1.5 mm. The tests were performed at room temperature (25°C) on a Zwick 4505 uniaxial tensile testing machine with a 500 N force cell (Instron 500 N). To measure the strains, we used KYOWA rosettes, model KFGS-1-120-D16-11 with a strength of 120 Ω, a factor of 2.06, and a gap length of 1 mm. The rosettes are glued and centered on the useful part of the specimens, and are connected to an acquisition chain that transforms the electrical signals into deformations. The rosettes are two-dimensional gauges that allow the measurement of longitudinal and transverse deformations, and thus the determination of the Poisson ratio of materials. The deformation accuracy of the rosettes is 10–4. The imposed speed is 1 mm/min to ensure the quasi-static character of the test. Given that the elastic zone of the polymers is difficult to observe, we used the 0.2% deformation to determine the elastic modulus of our materials. These instrumented tensile tests were performed to determine the influence of the variation of the size of our nanoparticles on the elastic moduli (Young, compressibility and shear) of the nanocomposites at constant volume fraction. The tests were performed for different volume fractions to confirm the repeatability of the size effect. The tests were performed a minimum of three times and the values shown or represented are the averages.
Figure 3.9 shows the stress–strain curves of the PMMA/0 matrix and the 4%/150 nm and 4%/500 nm nanocomposites. PMMA/0 has an average Young’s modulus of 3 ± 0.1 GPa, an average flow stress of 57.8 ± 1.4 MPa and an average strain at break of 3.4%. In the elastic region, a stiffening of the material can be noticed with the addition of nanoparticles, and even more so when the nanoparticle size decreases. Similarly, the flow stress increases with the addition of nanoparticles and the decrease in their size. At the same time, a decrease in the strain at break is observed. The Young’s moduli of the materials are determined and compared according to the particle size. Based on Poisson’s ratio, the compressibility and shear moduli are also calculated and compared according to the size of the particles.
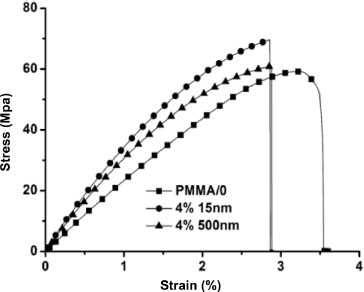
Figure 3.9. PMMA/0 and 4%/15 nm and 4%/500 nm nanocomposites stress–strain materials response
The effect of nanoparticle size on the elastic properties of the nanocomposites is clearly shown in Figure 3.9. This figure represents the evolution of Young’s moduli, compressibility moduli and shear moduli normalized to the nanoparticle size for the different volume fractions. The moduli are normalized with respect to those of the PMMA/0 matrix. The error bars represent standard deviations from the mean. The values of the Young moduli and the Poisson ratio are recorded in Table 3.3.
The evolutions of the normalized Young’s modulus of the nanocomposites are plotted in Figure 3.10 according to the nanoparticle size for the 2%, 4%, 6% and 8% volume fractions. It can be observed that the Young moduli of the nanocomposites are greater than that of the matrix, regardless of the volume fraction and the size of the nanoparticles. These observations result from two combined effects, namely the effect of the loading rate and the size effect. The effect of the loading rate has been observed and shown experimentally in works in the literature (Usuki et al. 1993; Liu et al. 2009), while the size effect, although discussed in the literature (mainly in numerical studies), has only been minimally discussed at the experimental level.
Table 3.3. Values of the Young moduli and Poisson ratio for the different materials
| Young’s moduli (GPa) | ||||
| Size (nm) | 2% | 4% | 6% | 8% |
| 15 | 3.6395 ±0.1054 | 4.0428 ±0.112 | 3.9479 ±0.0915 | 4.4666 ± 0.0671 |
| 25 | 3.58 ±0.1594 | 3.8432 ± 0.0758 | 3.9651 ± 0.0852 | 4.5268 ±0.1987 |
| 60 | 3.54 ±0.0154 | 3.6686 ±0.048 | 3.9203 ± 0.0633 | 4.4192 ±0.0951 |
| 150 | 3.48 ±0.1291 | 3.6222 ±0.0906 | 3.7318 ±0.062 | 4.091 ±0.1841 |
| 500 | 3.39 ±0.1245 | 3.5555 ±0.0623 | 3.743 ±0.196 | 3.8988 ±0.1102 |
| Poisson coefficients | ||||
| Size (nm) | 2% | 4% | 6% | |
| 15 | 0.3532 ± 0.0011 | 0.3531 ±0.0002 | 0.3535 ±0.0010 | |
| 25 | 0.3640 ± 0.0003 | 0.3611 ±0.0060 | 0.3675 ±0.0019 | |
| 60 | 0.3670 ± 0.0004 | 0.3696 ± 0.0016 | 0.3708 ±0.0015 | |
| 150 | 0.3700 ± 0.0015 | 0.3722 ± 0.0042 | 0.3732 ±0.0010 | |
| 500 | 0.3740 ± 0.0001 | 0.3750 ±0.0033 | 0.3737 ±0.0008 | |
The observation of the size effect, on the other hand, consists of fixing the loading rate and varying its size. In Figure 3.10, one can also note that the decrease in the size of nanoparticles with a fixed volume fraction is accompanied by an increase in Young’s modulus. Indeed, for a volume fraction of 2%, the gain in modulus shifts from 13% with the 500 nm nanoparticles to 21% for the 15 nm nanoparticles, which represents a gain of 9% when decreasing the size from 500 to 15 nm. The same observation is made for the other volume fractions. For example, for 4% volume, the gain in modulus is doubled by decreasing the diameter from 500 (18%) to 15 nm (34%). The size effect is, however, not a linear function of the nanoparticle size. The gain in modulus is small between large nanoparticles and increases very rapidly at small sizes. However, the difficulties related to the dispersion of nanoparticles within the matrix can attenuate the size effect, especially at low sizes where nanoparticles are more reactive with each other. They form aggregates that do not interact in the same way with the matrix as an isolated nanoparticle. In addition, the increase in volume fraction favors the aggregation of small nanoparticles that are more numerous in the matrix. In these cases, the moduli can drop or vary very little, as can be seen for the 6% volume fraction.
By fixing the volume of the nanoparticles that can be found in the matrix and by varying their size, the nanoparticle/matrix contact area is increased, which is related to the nanoparticle diameter. As a matter of fact, at a fixed volume fraction, the decrease in the size of fillers is accompanied by an increase in their total surface area. In the case of nanoparticles, a division of their size by a value α is accompanied by a multiplication of the surface/volume ratio by α. Therefore, the decrease in size increases the total charge transfer surface area between the matrix and the nanoparticles (charge transfer from the soft medium to the rigid medium). The nanocomposites with the smaller nanoparticles thus have a larger charge transfer surface area, which explains the increase in Young’s modulus at low nanoparticle sizes. With the increase of their area, small particles have more interaction sites with the matrix, which increases their number of hydrogen bonds. All of these factors improve the adhesion of the nanoparticle to the matrix chains and result in an increase of the Young modulus at low nanoparticle sizes. It is also believed that chain confinement basically modifies the modulus of the matrix. As in the case of thermal properties, where confinement causes a second transition temperature to appear at temperature values above Tg, the same effect can also modify the mechanical properties of the matrix surrounding the nanoparticles and thereby the macroscopic properties. On the other hand, it is difficult to determine the elastic mechanical properties at the scale of the confined phases in order to compare them to the macroscopic mechanical properties, as was the case for the Tg.
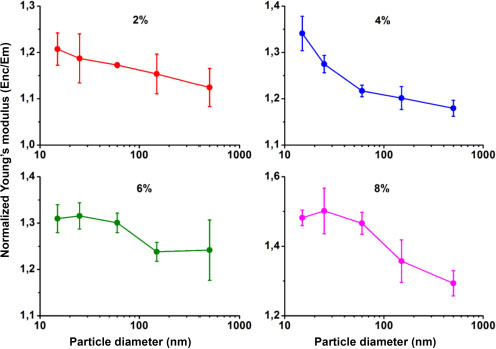
Figure 3.10. Effect of nanoparticle size on the Young moduli of 2%, 4%, 6% and 8% filled nanocomposites
By determining the Young modulus and the Poisson ratio, the shear moduli of the materials were calculated and compared for a size effect analysis. The evolution of the Poisson ratio according to nanoparticle size is presented in Table 3.3. It was also noticed that the nanocomposites Poisson’s ratios are lower than that of the matrix (Table 3.3) and that they decrease with decreasing nanoparticle size. Given that Poisson’s ratio of silica (ν = 0.17) is lower than that of PMMA (ν = 0.3733), the addition of the nanoparticles to the matrix therefore leads to slightly decreasing the Poisson ratio, as is the case with the nanocomposites.
Figure 3.11 shows the plot of the shear moduli of the nanocomposites as a function of size for 2%, 4% and 6% volume fractions. The same effect can be observed as that for the Young modulus. The modulus increases slightly at large nanoparticle sizes and then slightly more rapidly at small nanoparticle sizes. The plateau observed at 6% for low nanoparticle sizes is due to a poor dispersion of the nanoparticles in the matrix. The size effect is therefore attenuated.
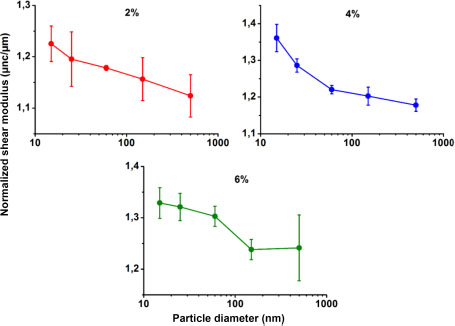
Figure 3.11. Effect of nanoparticle size on the shear moduli of 2%, 4% and 6% filled nanocomposites
3.3.2. Dynamic tests: viscoelastic properties
Dynamic mechanical analysis was used to measure the conservation modulus (E’) of the PMMA/0 matrix and the 2%, 4% and 6% filled nanocomposites according to nanoparticle size.
The static tests were done at one temperature and showed that the size of the nanoparticles affects the properties of the nanocomposites. The dynamic tests will make it possible to highlight the effect of size on the viscoelastic properties, and also to determine if the effect of size is effective at high temperatures or inhibited. The tests are done in tension-compression at a frequency of 1 Hz.
Figure 3.12 shows the changes in damping factor (tanδ) according to temperature for PMMA/0 and 4% filled nanocomposites according to nanoparticle size. As the nanocomposite becomes stiffer (increasing E’), it loses viscosity (E” decreases) and the result is a decrease in tanδ = E”/E’. The decrease in nanoparticle size results in a shift of the storage modulus curve toward higher values, which occurs independently of the temperature. As the temperature increases, a more or less rapid drop in the conservation modulus is observed for PMMA/0, while a progressive drop in the modulus is observed below the vitreous transition temperature for the nanocomposites, followed by an abrupt drop above Tg. The presence of nanoparticles in the matrix reduces the rate of fall of the storage modulus and shifts, by the same mechanism, the collapse of the curve toward higher temperatures. It can be noted, for example, that at 30°C, the storage modulus increased from 2.7 GPa for PMMA/0 to 3.17 GPa and 4.19 GPa, respectively, for the 4%/500 nm and 4%/15 nm nanocomposites, which corresponds to respective gains of 17% and 55% compared to the matrix. If we carry out a comparison between the nanocomposites, we obtain a gain of 38% when decreasing the size from 500 to 15 nm for the 4% filled nanocomposites. This improvement of the storage modulus reflects the strong interactions existing between the matrix and the nanoparticles, interactions which are all the stronger as the size of the nanoparticles decreases. It can also be noted that the size effect is maintained until the collapse of the storage modulus curves.
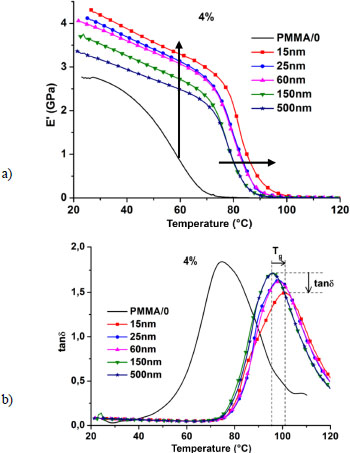
Figure 3.12. a) Evolution of storage modulus vs. temperature of PMMA/0 and 4% filled nanocomposites with different sizes of nanoparticles and at a frequency of 1 Hz. b) Evolution of the damping factor (tanδ) versus temperature of PMMA/0 and 4% filled nanocomposites with different sized nanoparticles and at a frequency of 1 Hz
3.4. Conclusion
In this chapter, we have studied the effect of nanoparticle size on the physicochemical and mechanical properties of nanocomposites, and this for different volume fractions.
This study shows, with different techniques, that these properties are dependent on the size of the nanoparticles. An improvement of the properties was observed. A minimal gain of 15°C on the Tg in DSC was obtained when 2% by volume of the 500 nm nanoparticles were added to the matrix, which is a sign of the presence of strong interactions between the nanoparticles and the matrix. This gain increases with decreasing nanoparticle size, it is 21°C at the same volume fraction for 15 nm particles. This improvement was observed for all volume fractions. Another transition zone that was not visible at the macroscopic scale (DSC and DMA) was observed at the molecular scale (WAXS-DSC). This transition zone that appears at higher temperature values than the glass transition zone is evidence of a glass transition gradient induced by the decrease in nanoparticle sizes (Papon et al. 2012). The restriction of their mobility is due to their confinement between the nanoparticles, and this confinement becomes more important with the decrease in the nanoparticle size and leads to an increase in the temperature of this transition. This temperature was called the confinement temperature and was denoted by Tconf. The value of Tconf is also dependent on the size. The confinement state of the chains is not the same from one particle size to another.
As for the mechanical properties, an improvement of the properties was observed with the decrease in the nanoparticle size. Quasi-static tensile tests have shown an increase in Young’s modulus with the decrease in the size. This increase is gradual at large nanoparticle sizes and then becomes rapid at small sizes. For 2%, 4% and 8%, the Young modulus increased with decreasing size. In contrast, for 6%, the modulus evolution reached a plateau at small sizes. The size effect is only effective if the nanoparticles are more or less well dispersed. The instrumentation of the tensile test resulted in determining the Poisson ratio and calculating the shear and compressibility moduli. On these two moduli, the size effect was also observed. While it results in an increase in shear, a decrease was observed in compressibility. On the viscoelastic properties, the size effect is summarized by an increase in the storage modulus with the decrease in the nanoparticles size. It also delays the transition zone between glassy and rubbery behavior.
3.5. References
Anoukou, K., Zaïri, F., Naït-Abdelaziz, M., Zaoui, A., Messager, T., Gloaguen, J.M. (2011). On the overall elastic moduli of polymer–clay nanocomposite materials using a self-consistent approach. Part II: Experimental verification. Compos. Sci. Technol., 71, 206–215.
Barnes, J.D., Kolb, R., Barnes, K., Nakatani, B., Hammouda, B. (2000). Microstructure analysis using temperature-induced contrast variation in small-angle scattering. J. Appl. Crystallogr., 33, 758–762.
Blivi, A.S., Benhui, F., Bai, J., Kondo, D., Bédoui, F. (2016). Experimental evidence of size effect in nano-reinforced polymers: Case of silica reinforced PMMA. Polym. Test., 56, 337–343.
Cauvin, L., Kondo, D., Brieu, M., Bhatnagar, N. (2010). Mechanical properties of polypropylene layered silicate nanocomposites: Characterization and micro-macro modelling. Polym. Test., 29, 245–250.
Fornes, T.D. and Paul, D.R. (2003). Modeling properties of nylon 6/clay nanocomposites using composite theories. Polymer (Guildf), 44, 4993–5013.
Gelineau, P. (2015). Caractérisation morphologique et homogénéisation élastique et visco-élastique de polymère. PhD Thesis, Université de technologie de Compiègne.
Kashiwagi, T., Hirata, T., Brown, J.E. (1985). Thermal and oxidative degradation of poly(methyl methacrylate) molecular weight. Macromolecules, 18, 131–138.
Kojima, Y., Usuki, A., Kawasumi, M., Okada, A., Fukushima, Y., Kurauchi, T., Kamigaito, O. (1993). Mechanical properties of nylon 6-clay hybrid. J. Mater. Res., 8, 1185–1189.
Liu, Y.Q., Cong, H.T., Wang, W., Sun, C.H., Cheng, H.M. (2009). AlN nanoparticle-reinforced nano-crystalline Al matrix composites: Fabrication and mechanical properties. Mater. Sci. Eng., 505, 151–156.
Maiti, P., Yamada, K., Okamoto, M., Ueda, K., Okamoto, K. (2002). New polylactide/layered silicate nanocomposites: Role of organoclays. Chem. Mater., 14, 4654–4661.
Nguyen, T.L. (2014). Approche multi-échelles dans les matériaux polymères : de la caractérisation nanométrique aux éffets d’echelles. PhD Thesis, Université de technologie de Compiègne.
Painter, P.C., Graf, J.F., Coleman, M.M. (1991). Effect of hydrogen bonding on the enthalpy of mixing and the composition dependence of the glass transition temperature in polymer blends. Macromolecules, 24, 5630–5638.
Papon, A., Montes, H., Hanafi, M., Lequeux, F., Guy, L., Saalwächter, K. (2012). Glass-transition temperature gradient in nanocomposites: Evidence from nuclear magnetic resonance and differential scanning calorimetry. Phys. Rev. Lett., 108, 65702.
Paul, D.R. and Robeson, L.M. (2008). Polymer nanotechnology: Nanocomposites. Polymer (Guildf), 49, 3187–3204.
Ryan, A.J., Stanford, J.L., Bras, W., Nye, T.M. (1997). A synchrotron X-ray study of melting and recrystallization in isotactic polypropylene. Polymer (Guildf), 38, 759–768.
Tripp, C.P. and Hair, M.L. (1992). An infrared study of the reaction of octadecyltrichlorosilane with silica. Langmuir, 8, 1120–1126.
Urresti, O., González, A., Fernández-Berridi, M.J., Iruin, J.J., Irusta, L. (2011). Oxygen permeability through poly(ethylene-co-vinyl acetate)/clay nanocomposites prepared by micro-wave irradiation. J. Memb. Sci., 373, 173–177.
Usuki, A., Kawasumi, M., Kojima, Y., Okada, A., Kurauchi, T., Kamigaito, O. (1993). Swelling behavior of montmorillonite cation exchanged for ω-amino acids by ∈-caprolactam. J. Mater. Res., 8, 1174–1178.
Verma, R.K., Velikov, V., Kander, R.G., Marand, H., Chu, B., Hsiao, B. (1996). SAXS studies of lamellar level morphological changes during crystallization and melting in PEEK. Polymer (Guildf), 37, 5357–5365.
Wang, L.F., Pearce, E.M., Kwei, T.K. (1991). Glass transitions in hydrogen-bonded polymer complexes. J. Polym. Sci. Part B Polym. Phys., 29, 619–626.
Wang, W.J., Murthy, N.S., Chae, H.G., Kumar, S. (2008). Structural changes during deformation in carbon nanotube-reinforced polyacrylonitrile fibers. Polymer (Guildf), 49, 2133–2145.
Yang, F. and Nelson, G.L. (2006). Polymer/silica nanocomposites prepared via extrusion. Polym. Adv. Technol., 17, 320–326.
Ying, Z., Xianggao, L., Bin, C., Fei, C., Jing, F. (2015). Highly exfoliated epoxy/clay nanocomposites: Mechanism of exfoliation and thermal/mechanical properties. Compos. Struct., 132, 44–49.
- For a color version of all the figures in this chapter, see www.iste.co.uk/bai/nanocomposites.zip.
- 1 See: www.anl.gov/com.