
5
Study of Interface and Interphase between Epoxy Matrix and Carbon-based Nanofillers in Nanocomposites
Yu LIU, Delong HE, Ann-Lenaig HAMON and Jinbo BAI
CentraleSupélec, Paris-Saclay University, Gif-sur-Yvette, France
Our study focuses on the characterization of the chemical nature and mechanical properties of the interface created by carbon micro- and nanofillers in an epoxide matrix. A direct measurement of the materials structure has been carried out on a nanometric scale using electron microscopy. Electron energy-loss spectroscopy (EELS) performed in a scanning transmission electron microscope (STEM) measured the plasmon peak position in the low-loss region, which is related to the local materials density. In situ tensile tests were carried out in a scanning electron microscope (SEM) on samples machined using a focused ion beam (FIB). These experiments were conducted on several types of fillers: oxidized or non-oxidized graphite platelets, carbon fibers (CFs) with/without their sizing layers and with/without nanotubes grown on their surfaces.
5.1. Introduction
Composite materials are known for combining a low weight with interesting properties such as mechanical strength. In this chapter, we report our investigations on composites where both the matrix and the fillers were carbon based. The matrix was a polymer (epoxide), chosen for its ease in use, whereas the different fillers we studied were also carbonaceous and either microsized (CFs) or nanosized (nanotubes, graphite nanoplatelets).
The understanding of the structure at the interface between the filler and the matrix is essential to control the properties of the homogenized, macroscopic material. Thereby near the interface, the matrix is reported to experience a modification of its structure, the interphase (Pukànszky 2005). This structural alteration can also locally modify the material properties and influence the composite behavior on a macroscopic scale such as, for instance, a decreased composite strength. Delale and Erdogan (1988) proposed a model taking into account a continuous variation in the interphase of the elastic moduli.
Besides, we seek to improve the material properties at the interface, including a modification of the filler surface using various strategies that are described below, such as filler oxidation or the synthesis of hybrid materials.
We carried out a direct measurement of the material local structure at the interface, accounting for both the presence of an interphase – whose thickness must be determined – and the surface modification. These observations were coupled to an investigation of the material strength, here again in the interface vicinity. The fact that both the matrix and the sample were carbonaceous gave rise to difficulties in such investigations, since we must use appropriate characterization techniques that can discriminate the different phases in the composite on a nanometer scale (Wu et al. 2014).
5.1.1. Surface modification of the fillers
Two strategies prevail in order to improve the cohesion at the interface, which both imply a modification of the filler/matrix surface. The first one is physical and is related to an increase in the surface roughness (Im and Kim 2012). The second one consists of oxidizing the filler in order to bridge the matrix (Sengupta et al. 2011).
The samples studied here were made alternately, using one of these methods. So, with the first method, carbon nanotubes were grown on CFs in order to increase the interacting surface (Saba et al. 2013). Otherwise, graphite nanoplatelets were oxidized – as previously carried out by Ramanathan et al. (2008), who distinguished strong interfaces from weak interfaces – or CFs were studied without the grown nanotubes mentioned above, but with their sizing layers as commercially provided, or in another case, the carbon nanotubes grown on the CFs were then oxidized. These composites obtained with modified fillers were also compared with composites with non-treated fillers, that is, non-oxidized graphite nanoplatelets and CFs after the removal of their sizing layer.
5.1.2. Experimental techniques
Given the filler treatment, it was necessary to investigate the composite structure at the scale of the filler-matrix interface, in order to access the structure modification generated by the treatment in comparison with the untreated case. Transmission electron microscopy (TEM), used in a scanning mode (STEM), provides a multitude of information which, moreover, has the advantage of being multimodal, for instance, by coupling high-resolution imaging and EELS. This characterization method gives information not only on the chemical nature of the elements, but also on their bonding states or the local valence electron density.
Besides, since the mechanical properties of the composite are at stake, tensile mechanical tests were carried out on a microsample centered on an interface between different types of a modified CF and the epoxide matrix. In order to do so, the sample was first milled with a FIB in an SEM after selecting the proper area. The tensile load was applied using the microscope nanomanipulator.
5.2. Structural analysis of the interface with electron energy-loss spectroscopy
5.2.1. Analysis technique
The TEM analyses were carried out using an FEI Titan G2 80 − 300 microscope with a high brightness field emission gun (X-FEG). In order to protect the sample from the irradiation effects, the observations and analyses were carried out with the lowest possible high tension, namely 80 kV. As a matter of fact, spectra acquired with different high tensions showed an alteration of the observed structure after 1 minute of irradiation at 200 kV, whereas the features in the spectra acquired at 80 kV remained stable after the same amount of time. At this high tension, the spatial resolution is then around 0.125 nm, and for the EELS analyses, the energy resolution is around 0.8 eV.
EEL spectra contain various information depending on the type of inelastic interactions between the probing electrons and the sample (Egerton 1986). In this study, we focused on two types of information present in two different energy-loss ranges. In the core-loss region (100 − 1500 eV), the ionization edge gives the chemical composition in the probed area. The energy-loss near-edge spectrum (ELNES) study of the carbon K-edge at 284 eV was more specifically studied: the energy resolution allows access to the fine structure, and thus the chemical bonding of the carbon atoms in the probed area. In the low-loss range (0 − 100 eV), the plasmon peak is related to the local valence electron density, as explained in Ferrari et al. (2000) and summed-up below.
The plasmon peak position in the spectra Ep is related to the local density of valence electrons nv:
where ħ stands for the reduced Planck’s constant, e is the elementary charge, ∈0 is the vacuum permittivity and m* is the electron effective mass.
As a carbon atom owns four valence electrons, one can thus infer the material density n in a pure carbon material, as a number of atoms per cubic meter:
or the density ρ, in kilograms per cubic meter:
where MC stands for the carbon molar mass and NA is the Avogadro constant.
Let us note that hydrogen and oxygen are also at least present in the epoxide structure, and contribute for, respectively, 1 and 6 valence electrons:
where xC and xO are, respectively, the fractions of carbon and oxygen, putting the hydrogen fraction to xH = 1 – xC – xO.
Although equation [5.2] is rigorous, the hydrogen and oxygen contents xH and xO in the sample are not necessarily known, but this expression is relatively stable as the composition varies, as shown in Figure 5.1. Furthermore, for a given polymer used as the matrix, we can consider that xH and xO are the same in the interphase and bulk. Thus, even when considering that the sample is purely made of carbon, the comparison between the interphase and bulk matrix using equation [5.1] remains quantitatively true.
Three types of nanofillers were tested: (i) commercially available graphite nanoplatelets (GNP) provided by KNANO Science Inc., (ii) graphite oxides (GO), and (iii) a hybrid structure made of carbon nanotubes (CNT) grown on the GNP. The graphite oxides were processed using the modified Hummers method, as described in Liu et al. (2014). The CNT were grown on the GNP surface using a chemical vapor deposition (CVD) method, with acetylene as the carbon source and ferrocene as the catalyst precursor, as described in Zhao and Bai (2015).
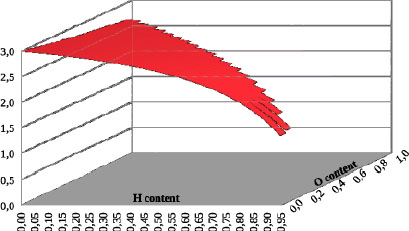
Figure 5.1. Evolution of the 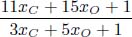 ratio used in [5.2], which takes into account the influence of the composition. It shows a great stability with the composition variation safe for a high hydrogen content (close to 1), a case which is not often met. For a color version of this figure, see www.iste.co.uk/bai/nanocomposites.zip
The three types of composites were prepared with a constant composition of 4.0 wt% fillers by mixing 0.8 g of nanofiller with 14.4 g of epoxide in a three-roll mill for 30 minutes, and then manually adding and mixing 4.8 g of a curing agent until a homogeneous suspension was obtained. The sample was then degassed for 60 minutes at room temperature in a vacuum oven, then put in a oven at 60° for 15 hours, and at last annealed at 100° for 90 minutes in order to resume the cross-linking reaction.
The TEM lamellae were ion-milled and tested in a FEI Helios 660 Dual beam, a SEM with a FIB with a Ga+ source used in order to mill the sample in the wanted area and with the desired geometry. The microscope ion beam resolution is around 4 nm. In our milling conditions, the ion beam current was progressively decreased from 21 to 2.5 nA as the following steps were performed: (i) a 2 μm thick protective layer was deposited on the targeted area where at least a filler and an interface were located, (ii) the sample section, perpendicular to the bulk surface, was milled down to a thickness of approximately 1 μm, (iii) the lamella was extracted and transferred to a TEM grid where it was soldered, (iv) the ultimate fine thinning step was carried out in the desired area of the lamella, using a 200 pA beam current, until it became semi-transparent, and (v) the amorphousized layer was removed using milling conditions from 5 kV and 23 pA to 1 kV and 28 pA (see Figure 5.2).
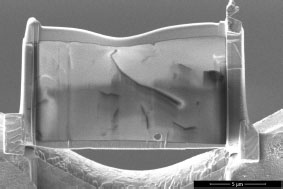
Figure 5.2. SEM image of the final TEM lamella after the final stage of ion milling
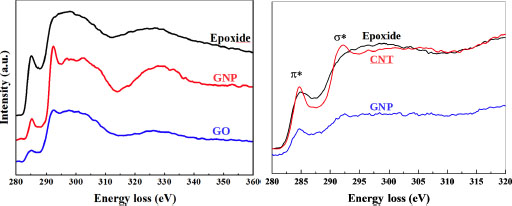
Figure 5.3. Carbon K-edge spectra of the various samples. (Left) Untreated GNP compared with GO, in epoxide. (Right) CNT grown on GNP in epoxide. For a color version of this figure, see www.iste.co.uk/bai/nanocomposites.zip
5.2.2. Results
The carbon K-edge study confirmed that the different phases observed in imaging mode had the proper chemical structure, as shown in Figure 5.3. The 1s → π* transition is observed in the first peak at 284 eV, whereas the 1s → σ* is observed at 291 eV. The difference in height between these peaks is related to the sp2/sp3 bonding ratio in the material (Hamon et al. 2004), but is also related to observation conditions and more specifically angular effects, as explained in Schattschneider et al. (2005). As suspected, the typical graphite fine structure above 291 eV is clearly visible in the untreated GNP and CNT zone, whereas the epoxide fine structure is typical of an amorphous carbon structure. Nevertheless, we observe that the fine structure in the cases of GO and GNP with grown CNT shows a noticeable alteration from the untreated GNP. A reason lies in the local thickness of the sample, since the nanofillers are much harder to ion-mill, and we observed a significant thickness difference between the epoxide domain and the nanofillers.
Low-loss spectra were also acquired in order to measure the local density of the material. In order to have a good comparability of the different phases, the spectra were acquired along a linescan, as shown in the STEM image in the corner of the graph. Two types of linescan were used. The first one was perpendicular to the interface, in order to measure the variability of the plasmon peak position and have the interphase thickness (see Figure 5.4, top). The other was parallel to the interface but in each of the phases (filler, interphase epoxide, bulk epoxide), in order to have the dispersion of the results in one given domain (see Figure 5.4, bottom).
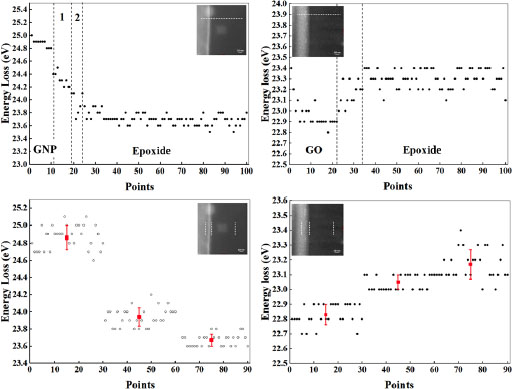
Figure 5.4. Plasmon peaks measured across different directions, as shown in the STEM image in the corner. Distance between two scanpoints: 1 nm. (Left) Untreated GNP in epoxide. (Right) GO in epoxide. For a color version of this figure, see www.iste.co.uk/bai/nanocomposites.zip
Figure 5.5 shows the plasmon peaks measured at different positions in a hybrid composite made of CNT grown on GNP. Spots 1, 3 and 4 correspond to a CNT, whereas spot 2 corresponds to the epoxide matrix, and spots 5 and 6 to the GNP. The plasmon peak positions are consistent with the spot location in the image.
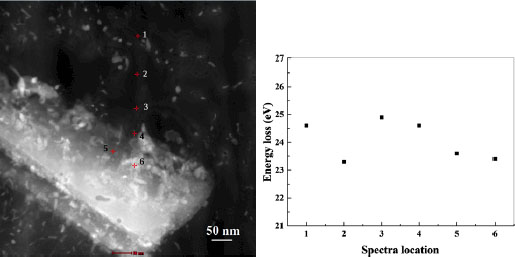
Figure 5.5. (Left) TEM view of a zone with CNT grown on GNP (light gray) in epoxide (dark gray). (Right) Plasmon peak positions in the six spots shown on the image. For a color version of this figure, see www.iste.co.uk/bai/nanocomposites.zip
5.2.3. Interpretation
The K-edge spectra confirmed that the oxidation process of the nanofillers generates a modification of the chemical structure. The plasmon peak measurement confirmed the existence of a transition layer, the interphase, where the density is neither the one of the filler nor the bulk epoxide, and whose thickness could be measured with the cross-sectional scanline: from 12 to 12.5 nm for GNP/epoxide and GO/epoxide.
In the GO/epoxide case, we observed a drop in the densities. First, the density of GO is decreased compared to GNP, due to the increase in the interplane distance of the crystal structure. Then, at the interface, the oxygen-containing groups introduced during the oxidation process react with the epoxide curing agent and the interface is blurred. Furthermore, in section 5.2.1 it was assumed that the chemical composition, if not precisely known, was constant in the bulk epoxide and in the interphase. It is certainly the case when no chemical treatment has been used, but in the case of GO/epoxide, the oxygen content is significantly increased, as confirmed by energy-dispersive X-ray (EDX) spectroscopy (see Figure 5.7). Thus, the density calculation contains a lot of uncertainty. Nevertheless, the in-depth oxidation of graphite dramatically modifies the filler properties, by suppressing C–C bonds and forming new C–O bonds. Such an alteration of the properties is not necessarily favorable in terms of mechanical properties.
We cannot discuss an interphase thickness in the case of the CNT-GNP hybrid, since the roughness of the interface prevents from any notion of a sharp change of domain.
5.3. In situ tensile test using scanning electron microscopy
Tensile tests were performed on a rectangular shaped sample of approximately 13 × 4 × 1.5 μm dimension, half in the CF zone and the other half in the epoxide matrix. The fiber part was connected to a copper massif, whereas the tensile load was externally applied on the epoxide side by the microscope nanomanipulator. Four types of CF were tested, and each was tested five to eight times. Depending on the sample, the length of the epoxide rectangular area ranged from 6.5 to 7 μm.
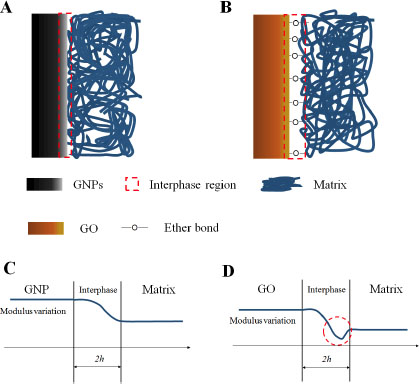
Figure 5.6. Sketch representing the composite interface and interphase, and the corresponding modulus variation using Delale and Erdogan (1988). (A,C) GNP/epoxide composite (B,D) GO/epoxide. For a color version of this figure, see www.iste.co.uk/bai/nanocomposites.zip
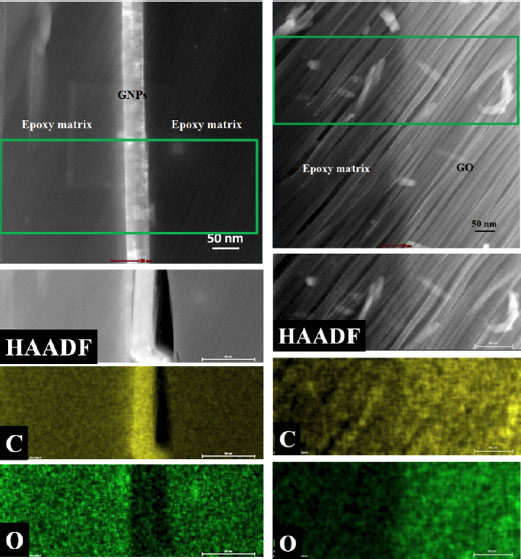
Figure 5.7. TEM imaging and EDX analysis of (right) GNP epoxide, and (left) GO/epoxide composites exhibiting the carbon and oxygen contents, which confirm the in-depth oxidation process of GO. For a color version of this figure, see www.iste.co.uk/bai/nanocomposites.zip
5.3.1. Experimental set-up
The samples were ion milled and tested in the same FEI Helios 660 Dual beam as described in section 5.2.1. The ion beam resolution is around 4 nm, and the ion beam current was progressively decreased from 21 to 2.5 nA as the following steps were performed (see Figure 5.8): (i) circular-shaped CF sections were located at the surface of the bulk material by SEM imaging; (ii) a protective platinum layer with a rectangular shape (20 × 2 × 1 μm) was deposited across the selected fiber-epoxide interface; (iii) the sample was milled down to a thickness of 1 μm and a width of 8 μm; (iv) the lamella was lifted out by the nanomanipulator and soldered to a copper grid by Pt deposition; (v) at the fiber–copper interface, two quarter-circles were milled in order to decrease the stress concentration; (vi) the nanomanipulator was soldered to the lamella by Pt deposition. It is noteworthy that the sample curvatures were designed on the part of the sample with the higher strength, so that the stress concentration appearing locally next to these discontinuities had no influence on our measurement, since it was much smaller than the rupture criterium of copper fiber or CF.
Four types of CF treatments were studied: (i) commercially available raw CF, which included a sizing layer on the surface, (ii) desized CF, obtained after the removal of the sizing layer, (iii) hybrids made up of carbon nanotubes (CNT) grown on the CF surface, (iv) oxidized hybrids made up of the previous CNT grown on the CF surface and then oxidized. For this study, we chose a T700 grade CF, with a diameter of around 7 μm, provided by Toray Carbon Fibers America, Inc. The desized CF were obtained by heating the as-received CF up to a temperature of 650° in an Ar atmosphere for several minutes (Zhang 2012). The CNT were grown on CF using a CVD method in a furnace at 650° under an Ar and H flow, with respective rates of 1.2 and 0.3 L.min–1. After a stabilization period, a xylene solution containing 0.1 g.mL–1 ferrocene was injected. After 3 minutes of growth, the furnace was cooled down to room temperature under an Ar protective atmosphere (Bai 2010). The fourth sample was obtained from the previous CNT-CF one by heating at 400° and stabilizing for 4 minutes in air.
5.3.2. Results
There was no direct indication of the load applied to the sample during the tensile test: a step-by-step displacement of 200 nm was imposed to the nanomanipulator, and the stress field was inferred from the global strain field in the sample. In particular, the transverse length in the epoxide domain was analyzed and compared with macroscopic tensile tests performed previously on a pure epoxide sample. In order to strengthen the results, observations were made using both the electron imaging mode and the ion mode, with two different viewing angles. Both curves overlapped almost everywhere, as shown in Figure 5.9.
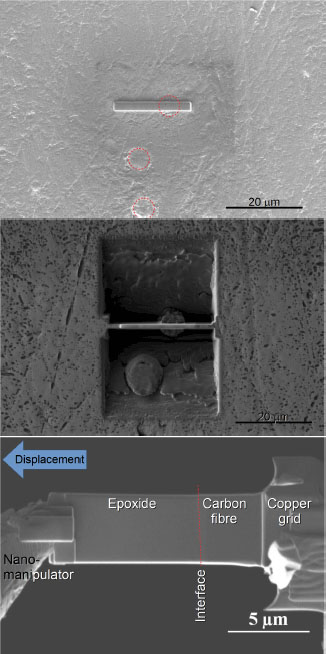
Figure 5.8. Different stages of the sample preparation. (Top) A protective platinum layer is deposited over a rectangular area where a carbon fiber (red circle) was located. (Middle) The sample – whose plane is perpendicular to the bulk surface – is ion milled. Carbon fibers, much harder than epoxide, can be spotted in the excavated zone. (Bottom) Final experimental setup
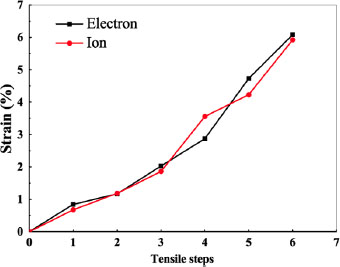
Figure 5.9. Comparison of the transverse strain–displacement curves measured in the epoxide from the electron and ion imaging modes. Example obtained on a raw, commercially available, carbon fiber. For a color version of this figure, see www.iste.co.uk/bai/nanocomposites.zip
In some samples, the rupture was observed inside the epoxide area, exhibiting a higher strength at the interface. For others, it was observed in the interface zone, emphasizing that the surface modification at the interface fulfilled its function. Figure 5.10 (left) shows the displacement–strain curves obtained with all samples, and Figure 5.10 (right) shows the ultimate strength measured during these same tensile tests.
We observe that the samples with CNT-CF hybrids give significantly better results than raw CF. Moreover, the oxidation process of the CNT-CF hybrids, which cumulates both types of surface treatment strategies mentioned in the introduction, gives a higher strength than the non-oxidized hybrids. Nevertheless, there are discrepancies in the results that must be carefully analyzed.
5.3.3. Interpretation
For the cases giving the better results, we observe that the strength compares with the ultimate strength of the bulk epoxide. Actually, for the two highest values measured in the oxidized hybrid CNT-CF, the rupture was observed in the epoxide domain, quite far from the interface. The surface treatment shows its limit: the tensile stress in the bulk epoxide cannot be decreased through a structural modification, and is the weak point in the composite.
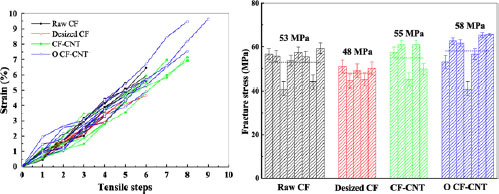
Figure 5.10. Tensile in situ tests on the four types of treated carbon fibers (CF): raw CF, CF after the removal of their sizing layers, hybrids made up of carbon nanotubes (CNT) grown on CF, oxidized CNT-CF hybrids. (Left) Strain–stress curves for all 25 tests; (right) corresponding ultimate strength. For a color version of this figure, see www.iste.co.uk/bai/nanocomposites.zip
The second point of interest concerns the measures giving the lowest results. More particularly, we observe that these results, observed with the modified CF, compare with the case of the desized CF, and lead to two notes: (i) the desized CF present the lowest values, but also the one with the smallest dispersion, with a strength around 48 GPa; (ii) for the other samples, it implies a problem of repeatability in the surface treatment. The dispersion in the results is an indirect measurement of the treatment homogeneity. For instance, concerning the raw CF, the sizing layer is probably not homogeneous along the length of the fiber, with the added fact that they have probably been bundled up before being permeated with the sizing agent, and CF positioned in the bundle center are less treated than those at the periphery.
5.3.4. Perspectives
Because of its geometry, this tensile testing gives an account of phenomena that are in the direction perpendicular to the interface. Other phenomena may occur in the plane of the interface. In that case, the choice of the surface modification could lead to different results, as the physical model behind is different: for oxidized fillers, it is not the elongation of the bond which is at stake, but its angular distortion. In situ shear tests would produce the desired data, although these results have already been tackled by the authors on macroscopic samples (Liu et al. 2016).
Another point is the result dispersion that highlights the well-known difficulty of process reproducibility, especially in a mass production perspective (relatively speaking). It is only one of the many parameters that must be controlled along with the filler distribution, and it is an endless source of improvement.
5.4. Conclusion
We carried out different local investigations on nanofiller/epoxide interfaces made possible by the latest microscopy techniques. EEL spectroscopy confirmed the existence of an interphase by measuring the local density across the filler/epoxide interface, which was around 12 nm thick, both in the case of GNP and GO fillers. It also led to the conclusion that the chemical treatment, namely the oxidation of the GNP to obtain GO, generates a modification of the chemical composition, and leads to a drop in the density, both in the filler and the interphase.
The effect of the filler treatment was also investigated through in situ tensile testing, where an isolated interface could be tested. Unremarkably, the filler that cumulated both types of surface modifications (CNT grown on the surface and oxidation) gave the best ultimate tensile strength. It also showed the limit of the process, since in that case, the fracture was observed in the bulk epoxide matrix, displacing the weak point of the composite in the bulk matrix.
These measures can be improved by a better energy resolution in the case of EEL spectroscopy supported with a consistent model, which could relate the structure modification and the local alteration of the material properties. Moreover, other in situ tensile tests with information applied on the load could strengthen the knowledge of the mechanical behavior in the interface zone, depending on the filler modification.
5.5. Acknowledgments
The results presented here were obtained from the PhD thesis of Yu Liu, who was granted a CSC scholarship. The authors wish to thank Jean-Francois Gérard, Isabelle Royaud, Gilles Lubineau, Lionel Pichon and Gilles Régnier for fruitful discussions.
This work was carried out within the MATMECA consortium and supported by the ANR under contract number ANR-10-EQPX-37. It has benefited from the facilities of the Laboratory MSSMat, CNRS, CentraleSupélec, Université Paris-Saclay, France.
5.6. References
Bai, J. (2000). Procédé de synthèse de nanotubes de carbone sur matériaux micrométriques longs et particulaires. Patent no. EP2370355A2.
Delale, F. and Erdogan, F. (1988). On the mechanical modeling of the interfacial region in bonded half-planes. Journal of Applied Mechanics, 55(2), 317–324.
Egerton, R.F. (1986). Electron Energy-loss Spectroscopy in the Electron Microscope. Plenum Press, New York.
Ferrari, A.C., Libassi, A., Tanner, B.K., Stolojan, V., Yuan, J., Brown, L.M., Rodil, S.E., Kleinsorge, B., Robertson, J. (2000). Density, sp3 fraction, and cross-sectional structure of amorphous carbon films determined by X-ray reflectivity and electron energy-loss spectroscopy. Phys. Rev. B, 62(16), 11089–11103.
Hamon, A.-L., Verbeeck, J., Schryvers, D., Benedikt, J., Van de Sanden, M.C.M. (2004). ELNES study of carbon K-edge spectra of plasma deposited carbon films. J. Mater. Chem., 14(13), 2030–2035.
Im, H. and Kim, J. (2012). Thermal conductivity of a graphene oxide-carbon nanotube hybrid/epoxy composite. Carbon, 50(15), 5429–5440.
Liu, Y., Zhang, Y., Zhang, T., Jiang, Y., Liu, X. (2014). Synthesis, characterization and cytotoxicity of phosphorylcholine oligomer grafted graphene oxide. Carbon, 71, 166–175.
Liu, Y., Hamon, A.-L., Bai, J. (2016). Directly measuring interfacial shear strength between Polymethyl methacrylate and graphene nanoplatelets. Materials Lett., 182, 244–247.
Pukànszky, B. (2005). Interfaces and interphases in multicomponent materials: Past, present, future. European Polymer Journal, 41(4), 645–662.
Ramanathan, T., Abdala, A.A., Stankovich, S., Dikin, D.A., Herrera-Alonso, M., Piner, R.D., Adamson, D.H., Schniepp, H.C., Chen, X., Ruoff, R.S., Nguyen, S.T., Aksay, I.A., Prud’Homme, R.K., Brinson, L.C. (2008). Functionalized graphene sheets for polymer nanocomposites. Nature Nanotechnology, 3, 327.
Saba, J., Magga, Y., He, D., Miomandre, F., Bai, J. (2013). Continuous electrodeposition of polypyrrole on carbon nanotube-carbon fiber hybrids as a protective treatment against nanotube dispersion. Carbon, 51, 20–26.
Schattschneider, P., Souche, C., Franco, H., Jouffrey, B. (2005). Anisotropic relativistic cross sections for inelastic electron scattering, and the magic angle. Phys. Rev. B, 72(4), 045142.
Sengupta, R., Bhattacharya, M., Bandyopadhyay, S., Bhowmick, A.K. (2011). A review on the mechanical and electrical properties of graphite and modified graphite reinforced polymer composites. Progress in Polymer Science, 36(5), 638–670.
Wu, Q., Li, M., Gu, Y., Li, Y., Zhang, Z. (2014). Nano-analysis on the structure and chemical composition of the interphase region in carbon fiber composite. Composites Part A: Applied Science and Manufacturing, 56, 143–149.
Zhang, J. (2012). Different surface treatments of carbon fibers and their influence on the interfacial properties of carbon fiber/epoxy composites. PhD Thesis, École Centrale, Paris.
Zhao, H. and Bai, J. (2015). Highly-sensitive piezo-resistive graphite nanoplatelet-carbon nanotube hybrids/polydimethylsilicone composites with improved conductive network constructions. ACS Applied Materials & Interfaces, 7(18), 9652–9659.