
7
Computational Modeling of Carbon Nanofiller Networks in Polymer Composites
Angel MORA
CICY, Mérida, Mexico
7.1. Introduction
Conductive nanofillers are typically added into polymers to improve their electrical properties. Carbon-based nanofillers such as carbon nanotubes (CNTs), graphene nanoplatelets (GNPs) or carbon black (CB) are commonly used as conductive nanofillers (Zhou and Lubineau 2013, Li and Zhong 2011, Ezquerra et al. 1986). The resulting nanocomposite material can be used in a wide range of applications. For instance, the addition of GNPs into a polymer can reduce its dielectric properties, which reduces the accumulation of electrical charge (Ge and Cosgrove 2015). This prevents electronic equipment from suffering damage due to an electric discharge. Polymers filled with conductive nanofillers possess piezoresistive properties that may be exploited for strain sensing and structural health monitoring applications (Li et al. 2008b, Nanni et al. 2012, Wernik and Meguid 2010). Table 7.1 shows some examples of the wide range of applications and the type of conductive material obtained depending on the electrical conductivity of polymer nanocomposites.
The change in behavior of a polymer from insulator to electrical conductor by the addition of conductive nanofillers is explained by the percolation theory (Stauffer and Aharony 1994). Electrical percolation is illustrated in the schematic in Figure 7.1, where the composite’s conductivity is shown as a function of nanofiller content. The insets of that figure show schematics of nanofiller networks at different volume contents, where CNTs are used as an example. When the nanofiller content is low, there is a slight increase in electrical conductivity. Then, when a critical concentration is reached, known as the percolation threshold, a sharp increase in conductivity is observed. The percolation threshold is denoted as ϕc in Figure 7.1. At a nanofiller content equal to the percolation threshold, a network of connected nanofillers that spans the whole composite is formed. This network is known as the percolated network and is shown in light gray in the middle and right insets in Figure 7.1. It is the percolated network that makes the conduction of electricity possible, as electrons mainly move along nanofillers and from one nanofiller to the other. Thus, the electrical conductivity of the composite is largely defined by the conductivity of the percolated network.
Table 7.1. Classification and applications of polymer nanocomposites according to their electrical conductivity. Table adapted from Pang et al. (2014)
| Conductivity [S/cm] | Classification | Application |
| 104–10–1 | Highly conductive | Conductors (e.g. metal replacements, resistors, thermoelectric materials) |
| 10–1–10–6 | Conductive | Sensors and EMI shielding (e.g. strain sensing, self-regulated heating elements, over-current protector) |
| 10–6–10–11 | Electrostatic, Dissipative | Anti-static materials (e.g. fuel tanks, anti-static storage containers, electronics connectors) |
| < 10–11 | Insulating | Insulator |
However, not all nanofillers are connected to the percolated network, as shown in the middle and right insets in Figure 7.1. This happens because nanofillers have to be close enough to each other so that the conduction of electricity is possible between any two of them. The maximum separation between nanofillers that allows the transfer of electrons between the two of them is in the order of a few nanometers (Li et al. 2007, Hu et al. 2008a, Simmons 1963). Thus, some nanofillers are wasted as they do not take part of the percolated network and, as a consequence, do not contribute to the conduction of electricity. Few attempts have been made in order to quantify the amount of nanofillers that actually contribute (or not) to the conduction of electricity in polymer nanocomposites.
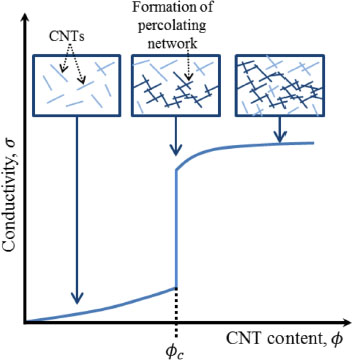
Figure 7.1. Schematic representation of the electrical conductivity, σ, of a polymer composite as a function of CNT loading. A percolating network is formed at the percolation threshold, ϕc (adapted from Wernik and Meguid 2010)
Computational models have been developed in order to study the electrical conductivity of polymers loaded with carbon-based nanofillers. Some focus on the study of the nanofiller network (Grujicic et al. 2004, Hu et al. 2008b, Mora et al. 2018b), while others use micromechanics models (Feng and Jiang 2013, Seidel and Puydupin-Jamin 2011) or the percolation theory (Foygel et al. 2005). Computational models that perform simulations of nanofiller networks are better suited to arrive at a definition of loading efficiency. Indeed, recently, a definition of loading efficiency based on the simulation of CNT networks was presented (Mora et al. 2018b). This definition can be used for other nanofillers (e.g., Mora et al. (2018a)). The study of the morphology of nanofiller networks may lead to a better understanding of the factors that affect the formation of a percolated network. In this way, guidelines can be defined such that a percolated network is formed using less nanofillers. Thus, polymer nanocomposites with higher electrical conductivity that require less nanofillers may be obtained.
Different strategies have been developed, from an experimental stand point, to improve the electrical conductivity of polymers. One such strategy involves mixing two nanofillers of different shapes, e.g., CNTs and GNPs (Al-Saleh 2016, Paszkiewicz et al. 2015, Chatterjee et al. 2012). Also, recently, hybrid particles have been developed in which CNTs are grown using another particle as a substrate, such as GNPs or silicon carbide (SiC). The use of these hybrid particles has shown promising results as hybrid particle networks are more conductive than those formed by single or mixed (non-hybrid) nanofillers (Dichiara et al. 2012, Zhao 2015). In this regard, computational models may also be used as a design tool so that the geometry of the hybrid particle that results in higher electrical conductivity is found.
In this chapter, carbon nanofiller networks will be studied to improve the conductivity of polymers using a computational approach. First, only CNT networks are studied to present a definition of loading efficiency. Then, the loading efficiency and electrical conductivity of CNT/polymer composites are studied. Later, hybrid-particle networks are studied. The definition of loading efficiency is also used for hybrid-particle networks and its relation with electrical conductivity is studied. Finally, the geometry of the hybrid particle is optimized and conclusions are presented.
7.2. Modeling and simulation of CNT/polymer nanocomposites
Different methodologies have been developed to study the material properties of polymers loaded with CNTs. Also, different methodologies have been followed to reproduce a geometric representation of a CNT network. Thus, an overview of these methodologies for geometric representation and modeling of electrical conductivity are presented in the following sections.
7.2.1. Geometrical modeling of CNT/polymer nanocomposites
Computational models have been developed to study CNT networks using, 2D and 3D models. In the case of 2D models, CNTs may be represented as straight (Rahman and Servati 2012, Zeng et al. 2011) or curved (Langley et al. 2018, Lin et al. 2010) lines, rectangles (Natsuki et al. 2005) or polygons (Li and Chou 2008). CNTs have been observed to curl inside polymer matrices, thus the usage of polygons is able to capture this experimentally observed behavior.
There are also quasi-3D models that consist of stacked layers of 2D models (Behnam et al. 2007, Jack et al. 2010). Another type of quasi-3D model consists of stacked layers of very thin 3D models. For instance, each layer of the model presented by Li et al. (2007) has a thickness of two inter-tube layers.
In the case of 3D models, some approaches have modeled CNTs as capped (Berhan and Sastry 2007a, Foygel et al. 2005, Grujicic et al. 2004) or uncapped (Bao et al. 2012, Gong et al. 2014, Hu et al. 2008a, Ounaies et al. 2003, Yu et al. 2010) straight cylinders. In order to capture the curliness of CNTs, they have been modeled using helical curves (Berhan and Sastry 2007b) or a sequence of n straight segments (Hu et al. 2008b, Lu et al. 2010, Mora et al. 2018b). However, helical CNTs are not representative of CNTs randomly dispersed in a polymer matrix. On the other hand, by allowing each of the n straight segments to have different orientations, a CNT may curl in a random manner. This type of representation has been shown to be representative of experimentally observed CNT networks (Han et al. 2014).
7.2.2. Analysis of electrical conductivity
Following the percolation theory, the electrical conductivity of a CNT/polymer composite can be calculated as:
where t is known as the critical exponent and has a universal value of t = 1.3 for 2D models and t = 2 for 3D models (Stauffer and Aharony 1994), ϕ is the CNT content, ϕc is the percolation threshold and σ0 depends on several factors, such as the CNT conductivity, contact resistance, network morphology and is sometimes considered to be the conductivity of the CNT (Foygel et al. 2005, Ounaies et al. 2003, Yu et al. 2010).
However, equation [7.1] is valid close to and above ϕc, but its range of validity has not been properly defined. Also, values of up to t ≈ 10 have been found from experiments (Bauhofer and Kovacs 2009, Mutiso and Winey 2015), which are well above the universal values. This deviation from the universal values is not well understood yet and is attributed to a non-homogeneous distribution of CNTs, their type (metallic or semiconducting) or the hopping and tunneling of electrons (Mutiso and Winey 2015, Li et al. 2010, Yazdani et al. 2016, Thakre et al. 2009).
Given the limitations of percolation theory, other approaches to study electrical conductivity of CNT/polymer composites have been followed. There are micromechanics models, in which an equivalent conductivity is found through a homogenization process. Seidel and Lagoudas (2009) developed a micromechanics model based on the Mori–Tanaka homogenization method. In that model, they consider the CNT and a surrounding interphase as an equivalent filler. Then the equivalent conductivity of a matrix with this equivalent filler is obtained. García-Macías et al. (2017) also developed a micromechanics model based on the Mori–Tanaka method, but included effects of CNT agglomeration and curliness. Micromechanics models have also been used in combination with 2D and 3D finite element simulations (Ren and Seidel 2013, Lu 2017). In these type of models, the electrical conductivity can be obtained at different points in the material.
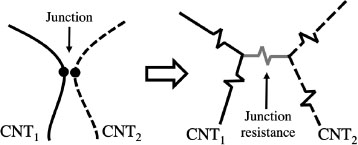
Figure 7.2. Two CNTs sharing in electrical contact (left) and their resistors network (right)
NOTE.– Lu (2017) performed simulation of GNP/polymer composites. However, their work is mentioned as the methodology can be applied to CNT/polymer composites.
Micromechanics models have resulted in good agreement with experimental results. However, they do not always consider that not all CNTs actively participate in the conduction of electricity in the composite (Seidel and Lagoudas 2009, Haj-Ali et al. 2014).
Finally, there are models that turn a CNT network into a resistor network to obtain the conductivity of the composite. In these models, two types of resistors are considered: CNT resistors and junction resistors. A CNT resistor comes from the intrinsic resistance of a CNT. A junction resistor comes from the flow of electrons between CNTs due to tunneling and hopping of electrons. Figure 7.2 shows an example of two CNTs and a junction and their corresponding resistor network. Panozzo et al. (2017) considered that CNTs form several parallel conductive paths, where each of these paths consists of several junction and CNT resistors connected in series. Thus, each parallel conductive path results in a parallel resistor. Then the conductivity of the composite is given by first calculating the equivalent resistance of such parallel resistors. However, Lubineau et al. (2017) found that, while there might be parallel paths for CNT loadings close to percolation threshold, as CNT content is increased all conductive paths tend to group into one large network. In other works, full random CNT networks are generated computationally and then turned into a random network of resistors (Hu et al. 2010, Li et al. 2007, Mora 2018). These types of models work following the same general steps:
- – generate a random network of CNTs;
- – find the percolated network. This is usually done using the Hoshen–Kopelman algorithm (Babalievski 1998, Hoshen and Kopelman 1976);
- – extract the backbone from the percolated network. The backbone is the subset of a percolated network that actually carries electrical current. That is, the network that results after removing dead branches (open loops that carry no electricity) from the percolated network (such as the ones highlighted in red in Figure 7.3). This can be done using the direct electrifying algorithm (Li and Chou 2007, 2009b);
- – turn the backbone into a network of resistors and, after applying a voltage, solve the equations associated with the resistor network to obtain the current passing through the composite;
- – using Ohm’s law, calculate the equivalent resistance of the composite. Using the composite’s geometry, calculate its electrical conductivity (or resistivity).
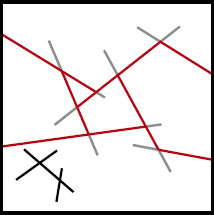
Figure 7.3. Example of a random CNT network where the percolated network is highlighted in red and dead branches (open loops that carry no electricity) are highlighted in light gray. A non-percolated network is also shown in black. For a color version of this figure, see www.iste.co.uk/bai/nanocomposites.zip
The advantage of using a resistor network approach lies in fact that the amount of non-percolated CNTs may be approximated directly from a CNT network.
7.3. Improving electrical conductivity of polymers loaded with CNTs
To provide guidelines to improve the electrical conductivity of CNT/polymer composites, first a definition of loading efficiency is presented. Then, its relationship with electrical conductivity and the parameters that affect these two quantities are studied.
7.3.1. Introducing a definition of loading efficiency
Mora et al. (2018b) introduced a definition of loading efficiency, η, as the fraction of CNTs that form part of the backbone network. In this way, loading efficiency is defined as:
where VCNT,b is the volume of CNTs in the backbone and VCNT,T is the total volume of CNTs inside a composite. Given the difficulty of measuring VCNT,b, by fitting results from their simulations, Mora et al. (2018b) presented the following approximation for loading efficiency:
where ϕred = ϕ/ϕc – 1 is the reduced CNT volume fraction.
NOTE.– Although the approximation given in equation [7.3] fits the results from Mora et al. (2018b) well, it has some limitations. First, η has a maximum at ϕred = 1.8755, after which loading efficiency starts decreasing. This is, of course, not expected to happen in actual composites. Additionally, η < 0 for ϕred > 3.8164. Thus, the approximation of η in equation [7.3] is not recommended for ϕred > 1.8755.
To overcome the limitations of approximation [7.3], Mora et al. (2020) fitted the simulation results from Mora et al. (2018b) using an exponential function as:
From equation [7.4], it is clear that as ϕred → ∞ we have that η → 1, which is the maximum value of η obtained when all CNTs belong to the backbone.
It is noted that equation [7.2] (and its approximations in equations [7.3] and [7.4]) is the first definition for loading efficiency presented in the literature. However, Deng and Zheng (2008) presented an expression for the fraction of percolated CNTs, ξ, as:
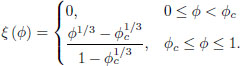
This expression has been used in several research articles (e.g. Takeda et al. (2011), Ma et al. (2015), García-Macías et al. (2018)), but in no case has it been referred to as loading efficiency. In addition, its validity and limitations have not been studied.
Given that equations [7.3]–[7.5] approximate the amount of percolated CNTs, they are compared. First, it is observed that equation [7.5] is continuous for 0 ≤ ϕ ≤ 1, while equations [7.3] and [7.4] both have a discontinuity at η (ϕc). On the one hand, equation [7.5] is continuous since ξ (ϕc) = 0, which is a non-realistic result as it implies no CNTs are in the backbone of a percolated network. On the other hand, the discontinuities of equations [7.3] and [7.4] at η (ϕc) reflect the sudden increase in electrical conductivity observed at a CNT concentration of ϕc (e.g. as suggested by the schematic in Figure 7.1).
Figure 7.4 shows ξ and η for three aspect ratios (Ar = 100, 500, 1000), where the percolation thresholds are taken from Mora et al. (2018b). Since both equations [7.3] and [7.4] approximate equation [7.2] using the same simulation results, for simplicity only one approximation of η is shown in Figure 7.4. Here, equation [7.4] is preferred as it does not have the limitations of equation [7.3]. As noted by Mora et al. (2018b), CNT aspect ratio has no effect over η and thus only one line is plotted in Figure 7.4. On the other hand, the differences in ξ become larger as the CNT aspect ratio is increased. Another important difference is that the three curves for ξ are well below the curve for η. Since approximation 7.4 is obtained from simulations of CNT networks, this suggests equation [7.5] under-estimates the fraction of percolated CNTs.

Figure 7.4. Comparison of the fraction of percolated CNTs, ξ, as given by Deng and Zheng (2008), with the approximation of loading efficiency, η, given by Mora et al. (2020). For a color version of this figure, see www.iste.co.uk/bai/nanocomposites.zip
From the observations above, the definition of loading efficiency presented by Mora et al. (2018b) is more representative of actual CNT networks and percolation behavior. Thus, the definition presented in equation [7.2] is recommended.
7.3.2. Efficiency and electrical conductivity of polymers loaded with CNTs
Now, the loading efficiency and electrical conductivity of CNT/polymer nanocomposites are compared. Figure 7.5(a) shows the loading efficiency obtained from simulations of CNT networks for three aspect ratios, Ar, of 100, 500 and 1000. It is clear from that figure that, for a given CNT content, efficiency is higher for polymers loaded with CNTs with larger aspect ratio. It is also observed that loading efficiency increases faster as the aspect ratio is increased.
Figure 7.5(b) shows the electrical conductivity corresponding to the efficiencies shown in Figure 7.5(a). First, it is observed that an increase in efficiency corresponds to an increase in electrical conductivity. Also, for a given CNT content, electrical conductivity is higher for polymers loaded with CNTs with a larger aspect ratio, which is the same behavior observed with loading efficiency. However, the differences in electrical conductivity for composites with CNTs of different aspect ratios are reduced as CNT content is increased.
Thus, in principle, the electrical conductivity of composites may be improved by using CNTs with a large aspect ratio. However, this benefit depends on the CNT concentration. For instance, Figure 7.5(b) suggests that, for CNT contents of around 0.3 % volume fraction and above, electrical conductivity does not change much if the aspect ratio of CNTs is increased above 500. In addition, CNTs with a large aspect ratio commonly form agglomerations (Brigandi et al. 2017, Mierczynska et al. 2007, Pan et al. 2010, Xin and Li 2011) that reduce the percolation effect and might even act as defects (Truong et al. 2007). This is to be taken into consideration in applications where mechanical deformation is also required (e.g. strain sensors).
7.3.3. Influence of junction resistance
An important parameter in calculating the electrical conductivity of CNT/polymer composites is the junction resistance. To approximate the junction resistance, many efforts (e.g. Bao et al. (2011), Hu et al. (2012), Li et al. (2007), Hu et al. (2008a), García-Macías et al. (2017)) have relied on the theory developed by Simmons (1963). For instance, Hu et al. (2008a) presented the following approximation for the junction resistance:
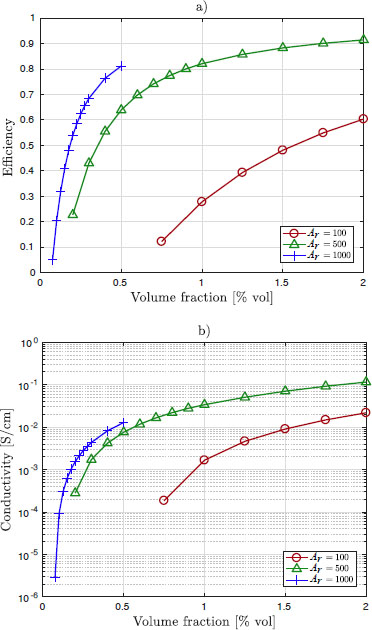
Figure 7.5. Comparison of efficiency (a) and electrical conductivity (b) as a function of volume fraction for different aspect ratios (Ar) (Mora et al. 2018b). For a color version of this figure, see www.iste.co.uk/bai/nanocomposites.zip
where h is Planck’s constant (6.62606957 × 10⁻³⁴ kg·m2/s), t is the thickness of the polymer layer separating two CNTs, A is the cross-sectional area of the tunnel, λ is the height of the barrier, and e and m are the charge (1.602176565 × 10⁻¹⁹ C) and mass of an electron (9.10938291 × 10⁻³¹ kg), respectively.
However, the actual value of the junction resistance is dependent on several factors, such as the nanotube type and diameter, junction area and electrical properties of the polymer matrix (Li and Chou 2009a, Mutiso and Winey 2015, Buldum and Lu 2001, Fuhrer 2000). In contrast, the approximation of equation [7.6] only considers the separation of the CNTs and the properties of the matrix (through the height barrier). In addition, the effect of the junction resistance on the electrical conductivity of the composite has been rarely investigated (Li et al. 2007, De Vivo et al. 2013).
A study of the effect of junction resistance on the composite’s electrical conductivity using a computational approach is presented in Figure 7.5. In this figure, each electrical conductivity curve is obtained using a constant value for the junction resistance for all junctions in the resistor network. It is observed that for values of RJ of 106 Ω or below there is little effect on further reducing the junction resistance. On the other hand, when RJ ≥ 107, reducing the junction resistance in one order of magnitude results in a similar increase in the conductivity of the composite. These results indicate the benefit that can be obtained from research dealing with reducing the effects of junction resistance (Zhou and Lubineau 2013, Hermant et al. 2009, Ventura et al. 2015). Conversely, the results in Figure 7.5 suggest that there is a limit above which reducing the effect of junction resistance does not considerably increase the conductivity of the composite.
7.4. Improving electrical conductivity of polymers loaded with hybrid particles
7.4.1. Hybrid particles
Up until this point, the focus has been on polymers loaded with CNTs to increase their electrical conductivity. However, a recent strategy to improve the electrical conductivity of polymers consists of using nanofillers of different shapes to create new (hybrid) particles (He et al. 2017, Li et al. 2014a). In this way, CNTs have been grown using other nanofillers as substrates, such as GNPs, silicon carbide (SiC) and alumina (Al2O3) (Li et al. 2014b, 2013b). An example of such particles, which consists of CNTs grown on a GNP, is shown in the schematic in Figure 7.7. For the rest of the chapter, we will focus on hybrid particles consisting of CNTs grown on GNPs as substrates (CNT-GNP hybrid particles).

Figure 7.6. Sensitivity analysis of junction resistance (Mora et al. 2018b). For a color version of this figure, see www.iste.co.uk/bai/nanocomposites.zip
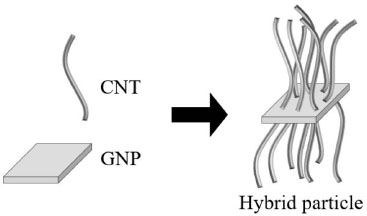
Figure 7.7. Schematic of a hybrid particle consisting of CNTs grown on a GNP
Experiments have shown that polymers loaded with CNT-GNP hybrid particles are more electrically conductive than polymers loaded with only CNTs, only GNPs, or a mixture of CNTs and GNPs (Dichiara et al. 2012, Zhao 2015). In addition, polymers loaded with CNT-GNP hybrid particles have shown potential as strain sensors due to their piezoresistive behavior (Zhao and Bai 2015). The high electrical conductivity of polymers loaded with CNT-GNP hybrid particles has been attributed to the GNPs acting as CNT concentrators (Zhao and Bai 2015). Here, the CNTs of a hybrid particle form a bundle of connected CNTs. Thus, when one CNT of the bundle is connected to a percolated network, all of the CNTs in the bundle are also connected. This description is similar to that of a segregated structure, in which nanoparticles are constrained to certain locations in a composite. Indeed, by using a computational tool, it was shown that hybrid particle networks actually form segregated structures (Mora et al. 2018a).
7.4.2. Efficiency and electrical conductivity of CNT-GNP hybrid-particle networks
Following the definition in equation [7.2], the loading efficiency of polymers loaded with CNT-GNP hybrid particles is calculated by performing simulations of the networks they form inside polymers. Loading efficiency for CNT-GNP hybrid particles is shown in Figure 7.8(a) for different volume fractions of carbon content. For comparison, the loading efficiencies of CNTs, GNPs and mixed CNTs and GNPs are also shown in the figure. For the four types of nanofillers, loading efficiency increases by increasing carbon content. The increase in efficiency is faster for low loadings and, as the carbon content is increased, efficiency increases at a lower rate. This is due to large changes in the morphology of the nanofiller network occurring at loadings close to the percolation threshold (Lubineau et al. 2017).
From Figure 7.8(a), it is also observed that hybrid particles show the highest loading efficiency for all volume fractions. The high efficiency shown by the hybrid particles is a direct result of them forming a segregated structure (Mora et al. 2018a). Since CNTs are attached at GNPs, they are close to each other and it is easier for them to be in contact with each other. Thus, the more CNTs are in the backbone, the higher the efficiency.
The increased loading efficiency of CNT-GNP hybrid particles is also reflected in increased electrical conductivity compared to the other nanofillers, as shown in Figure 7.8(b). Although the differences in electrical conductivity are not as clear as with efficiency, hybrid particles show the highest electrical conductivity for all loadings. The difference in electrical conductivity is especially clear at low loadings, that is, close to the percolation threshold. Thus, applications that require loadings close to the percolation threshold may benefit from using polymers loaded with CNT-GNP hybrid particles.
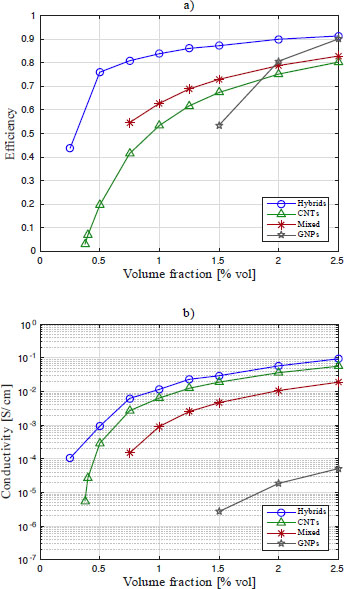
Figure 7.8. a) Nanofiller efficiencies at different volume fractions of carbon content. b) Electrical conductivities for different nanofillers at different volume fractions of carbon content (Mora et al. 2018a). For a color version of this figure, see www.iste.co.uk/bai/nanocomposites.zip
7.4.3. Optimization of the hybrid-particle geometry
Finally, the use of a computational tool to optimize the geometry of the CNT-GNP hybrid particle is shown here. Following Mora et al. (2018a), the optimization parameters are the CNT aspect ratio, Ar = lCNT/rCNT, the GNP inverse aspect ratio, Ari = tGNP/lGNP, and the number of CNTs per micron squared on GNPs, N. Here, lCNT and rCNT are the CNT length and radius, respectively, and tGNP and lGNP are the GNP thickness and side length. Here, a GNP is modeled as parallelepiped with a square base.
Based on typical geometries of hybrid particles grown experimentally (Li et al. 2013a, Zhao and Bai 2015, Zhao 2015), the search space for the optimization is defined as follows:
- – for Ar, the CNT radius is kept constant at rCNT = 5 nm, while its length varies within 3 ≤ lCNT ≤ 8 μm. Thus Ar ∈ [300, 800];
- – for Ari, the GNP side length is kept constant at lGNP = 3 μm, while its thickness varies within 10 ≤ tGNP ≤ 60 nm. Thus Ari ∈ [1/300, 6/300];
- – N varies in the range [10, 100].
NOTE.– Usually the aspect ratio is defined as the ratio of the larger dimension to the smaller dimension. This results in the GNP aspect ratio usually being defined as Ar = lGNP/tGNP (Safdari and Al-Haik 2012, Chen et al. 2003, Li and Zhong 2011). However, when studying the effect of modifying the larger dimension (e.g. lGNP for GNPs), it is more useful to take this definition. Since tGNP is the variable that is modified in the optimization process, the ratio of the smaller dimension to the larger is considered here.
The composites for the simulations are taken to be cubes of 30 μm per side, while the carbon content is kept constant at 1% volume fraction. The optimization is performed by keeping one of the three optimization parameters constant and varying the other two within their specified ranges. The results of this procedure are shown in Figures 7.9–7.11.
Figure 7.9 shows a 3D plot of the conductivity when a value of Ari = 3/300 is kept constant. The insets in Figure 7.9 illustrate the changes in the microstructure as Ar and N are increased. Since the carbon content is kept constant, increasing Ar (N) results in having less hybrid particles but with longer CNTs (more CNTs per μm2). These changes are indicated with the arrows connecting the insets in Figure 7.9. It is observed in Figure 7.9 that increasing either Ar or N results in an increase in the electrical conductivity of the composite. A similar result is observed in polymers loaded with CNTs, where increasing their aspect ratio results in composites with higher electrical conductivity (Mutiso and Winey 2015, Li et al. 2008b). It is also observed that, for N > 55 CNTs/μm2, there is no significant increase in the composite’s conductivity. Thus, this value can be used as an upper limit when synthesizing hybrid particles.
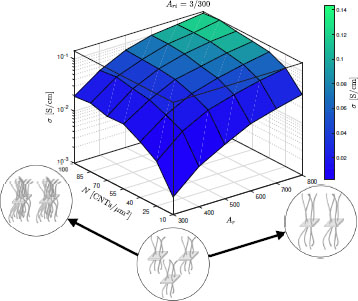
Figure 7.9. Electrical conductivity as a function of CNT aspect ratio, Ar, and CNT density, N. The GNP inverse aspect ratio is kept constant at Ari = 3/300. Insets show changes in the microstructure when varying N or Ar in the directions indicated by the arrows. For a color version of this figure, see www.iste.co.uk/bai/nanocomposites.zip
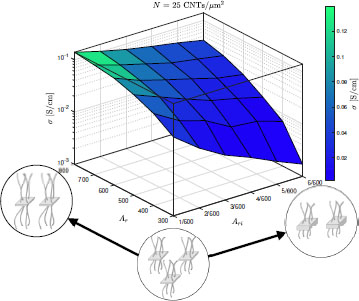
Figure 7.10. Electrical conductivity as a function of CNT aspect ratio, Ar, and GNP inverse aspect ratio, Ari. The CNT density was kept constant at N = 25 CNTs/μm2. Insets show changes in the microstructure when varying Ar or Ari in the directions indicated by the arrows. For a color version of this figure, see www.iste.co.uk/bai/nanocomposites.zip
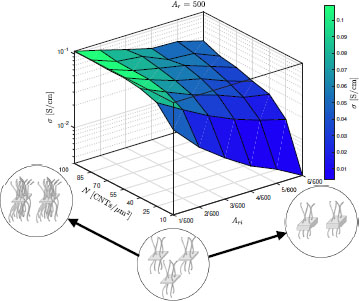
Figure 7.11. Electrical conductivity as a function of GNP inverse aspect ratio, Ari, and CNT density, N. The CNT aspect ratio was kept constant at Ar = 500. Insets show changes in the microstructure when varying N or Ari in the directions indicated by the arrows. For a color version of this figure, see www.iste.co.uk/bai/nanocomposites.zip
Figure 7.10 shows a 3D plot of the conductivity when a value of N = 25 CNTs/μm2 is kept constant. The insets in Figure 7.9 illustrate the changes in the microstructure, where increasing Ar (Ari) results in having less hybrid particles but with longer CNTs (thicker GNPs). It is observed that increasing Ar but decreasing Ari results in an increase in the electrical conductivity of the composite. That is, higher electrical conductivities can be achieved when most of the carbon content is made up of CNTs. In the limiting case, tying up a bundle of CNTs of length 2lCNT by the middle would result in the highest electrical conductivity.
NOTE.– In an experimental set up, as the GNPs get thinner, they might not be able to maintain the GNPs on their surfaces. Thus, experiments are needed to assess the minimum thickness that guarantees the integrity of the hybrid particles.
Figure 7.11 shows a 3D plot of the conductivity when a value of Ar = 500 is kept constant. The insets in Figure 7.9 illustrate the changes in the microstructure, where increasing N (Ari) results in having less hybrid particles but with more CNTs per μm2 (thicker GNPs). Results are, of course, consistent with those observed in Figures 7.9 and 7.10. In that sense, the upper limit of 55 CNTs/μm2 and thin GNPs are again drawn as recommendations to optimize the CNT-GNP hybrid particle geometry.
7.5. Conclusions
There are different strategies to study polymer composites loaded with carbon nanofillers using computational methods. Each method has its own benefits and shortcomings. In any case, computational methods can be used to provide guidelines that improve the usage of nanoparticles and further increase the electrical conductivity of polymer composites.
Computational tools can also be used to offer some insight where available tools and instruments can not. For instance, full CNT networks can be studied and their backbone extracted using computational tools. In this way, a definition of loading efficiency was proposed based on the backbone network. Given a definition of loading efficiency, its dependence on CNT geometry and content can be studied. It was found that increasing the CNT aspect ratio and content results in increasing loading efficiency. However, as the CNT content is increased, the dependence on aspect ratio is reduced. Thus, in principle, large aspect ratio CNTs are recommended to increase electrical conductivity due to their higher efficiency. However, the advantage of large aspect ratio CNTs is reduced as the CNT content is increased. It was also found that reducing the junction resistance in one order of magnitude may result in an improvement of one order of magnitude in the composite’s conductivity. In this regard, research that aims to reduce the effects of the junction resistance is highlighted.
The networks formed by recently developed CNT-GNP hybrid particles were studied using a computational tool. It was found that these networks were more conductive due to their higher efficiency. The geometry of this hybrid particle was also optimized using a computational tool. It is suggested to synthesize hybrid particles with no more than 55 CNT/μm2, as larger CNT densities do not significantly improve the electrical conductivity of the composite. It is also suggested that the majority of the carbon content in the hybrid particles is made up of CNTs.
Finally, the work presented in this chapter shows how computational tools and experiments may complement each other to further improve properties of materials.
7.6. References
Al-Saleh, M.H. (2016). Electrical, EMI shielding and tensile properties of PP/PE blends filled with GNP: CNT hybrid nanofiller. Synthetic Metals, 217, 322–330.
Babalievski, F. (1998). Cluster counting: The Hoshen-Kopelman algorithm vs. spanning tree approaches. International Journal of Modern Physics C, 9(1), 18.
Bao, W., Meguid, S., Zhu, Z., Meguid, M. (2011). Modeling electrical conductivities of nanocomposites with aligned carbon nanotubes. Nanotechnology, 22(48), 485704.
Bao, W., Meguid, S., Zhu, Z., Pan, Y., Weng, G. (2012). A novel approach to predict the electrical conductivity of multifunctional nanocomposites. Mechanics of Materials, 46, 129–138.
Bauhofer, W. and Kovacs, J.Z. (2009). A review and analysis of electrical percolation in carbon nanotube polymer composites. Composites Science and Technology, 69(10), 1486–1498.
Behnam, A., Guo, J., Ural, A. (2007). Effects of nanotube alignment and measurement direction on percolation resistivity in single-walled carbon nanotube films. Journal of Applied Physics, 102(4), 044313.
Berhan, L. and Sastry, A. (2007a). Modeling percolation in high-aspect-ratio fiber systems I. Soft-core versus hard-core models. Physical Review E, 75(4), 041120.
Berhan, L. and Sastry, A. (2007b). Modeling percolation in high-aspect-ratio fiber systems II. The effect of waviness on the percolation onset. Physical Review E, 75(4), 041121.
Brigandi, P.J., Cogen, J.M., Reffner, J.R., Wolf, C.A., Pearson, R.A. (2017). Influence of carbon black and carbon nanotubes on the conductivity, morphology, and rheology of conductive ternary polymer blends. Polymer Engineering and Science Engineering, 57(12), 1329–1339.
Buldum, A. and Lu, J.P. (2001). Contact resistance between carbon nanotubes. Physical Review B, 63(16), 161403.
Chatterjee, S., Nafezarefi, F., Tai, N.H., Schlagenhauf, L., Nüesch, F.A., Chu, B.T.T. (2012). Size and synergy effects of nanofiller hybrids including graphene nanoplatelets and carbon nanotubes in mechanical properties of epoxy composites. Carbon, 50(15), 5380–5386.
Chen, G., Weng, W., Wu, D., Wu, C. (2003). PMMA/graphite nanosheets composite and its conducting properties. European Polymer Journal, 39(12), 2329–2335.
De Vivo, B., Lamberti, P., Spinelli, G., Tucci, V. (2013). Numerical investigation on the influence factors of the electrical properties of carbon nanotubes-filled composites. Journal of Applied Physics, 113(24), 244301.
Deng, F. and Zheng, Q.-S. (2008). An analytical model of effective electrical conductivity of carbon nanotube composites. Applied Physics Letters, 92(7), 071902.
Dichiara, A., Yuan, J.K., Yao, S.H., Sylvestre, A., Bai, J.B. (2012). Chemical vapor deposition synthesis of carbon nanotube-graphene nanosheet hybrids and their application in polymer composites. Journal of Nanoscience and Nanotechnology, 12(9), 6935–6940.
Ezquerra, T., Martinez-Salazar, J., Baltá Calleja, F. (1986). Percolation threshold of conductive polycarbonate/carbon composites as revealed by electron microscopy. Journal of Materials Science Letters, 5(10), 1065–1066.
Feng, C. and Jiang, L. (2013). Micromechanics modeling of the electrical conductivity of carbon nanotube (CNT)-polymer nanocomposites. Composites Part A: Applied Science and Manufacturing, 47, 143–149.
Foygel, M., Morris, R., Anez, D., French, S., Sobolev, V. (2005). Theoretical and computational studies of carbon nanotube composites and suspensions: Electrical and thermal conductivity. Physical Review B, 71(10), 104201.
Fuhrer, M.S. (2000). Crossed nanotube junctions. Science, 288(5465), 494–497.
García-Macías, E., D’Alessandro, A., Castro-Triguero, R., Pérez-Mira, D., Ubertini, F. (2017). Micromechanics modeling of the electrical conductivity of carbon nanotube cement-matrix composites. Composites Part B: Engineering, 108, 451–469.
García-Macías, E., Rodríguez-Tembleque, L., Sáez, A., Ubertini, F. (2018). Crack detection and localization in RC beams through smart MWCNT/epoxy strip-like strain sensors. Smart Materials and Structures, 27(11), 115022.
Ge, C. and Cosgrove, K. (2015). Preparation of PVOH coatings with graphene nanoplatelets for electrostatic discharge protective packaging. Journal of Electrostatics, 77, 157–162.
Gong, S., Zhu, Z., Meguid, S. (2014). Carbon nanotube agglomeration effect on piezoresistivity of polymer nanocomposites. Polymer, 55(21), 5488–5499.
Grujicic, M., Cao, G., Roy, W. (2004). A computational analysis of the percolation threshold and the electrical conductivity of carbon nanotubes filled polymeric materials. Journal of Materials Science, 39(14), 4441–4449.
Haj-Ali, R., Zemer, H., El-Hajjar, R., Aboudi, J. (2014). Piezoresistive fiber-reinforced composites: A coupled nonlinear micromechanical-microelectrical modeling approach. International Journal of Solids and Structures, 51(2), 491–503.
Han, F., Azdoud, Y., Lubineau, G. (2014). Computational modeling of elastic properties of carbon nanotube/polymer composites with interphase regions. Part I: Micro-structural characterization and geometric modeling. Computational Materials Science, 81, 641–651.
He, D., Fan, B., Zhao, H., Yang, M., Wang, H., Bai, J., Li, W., Zhou, X., Bai, J. (2017). Multifunctional polymer composites reinforced by carbon nanotubes – Alumina hybrids with urchin-like structure. Materials Today Communications, 11, 94–102.
Hermant, M.C., Klumperman, B., Kyrylyuk, A.V., Van der Schoot, P., Koning, C.E. (2009). Lowering the percolation threshold of single-walled carbon nanotubes using polystyrene/poly(3,4-ethylenedioxythiophene): Poly(styrene sulfonate) blends. Soft Matter, 5(4), 878.
Hoshen, J. and Kopelman, R. (1976). Percolation and cluster distribution I. Cluster multiple labeling technique and critical concentration algorithm. Physical Review B, 14(8), 3438–3445.
Hu, N., Karube, Y., Yan, C., Masuda, Z., Fukunaga, H. (2008a). Tunneling effect in a polymer/carbon nanotube nanocomposite strain sensor. Acta Materialia, 56(13), 2929–2936.
Hu, N., Masuda, Z., Yan, C., Yamamoto, G., Fukunaga, H., Hashida, T. (2008b). The electrical properties of polymer nanocomposites with carbon nanotube fillers. Nanotechnology, 19(21), 215701.
Hu, N., Karube, Y., Arai, M., Watanabe, T., Yan, C., Li, Y., Liu, Y., Fukunaga, H. (2010). Investigation on sensitivity of a polymer/carbon nanotube composite strain sensor. Carbon, 48(3), 680–687.
Hu, B., Hu, N., Li, Y., Akagi, K., Yuan, W., Watanabe, T., Cai, Y. (2012). Multi-scale numerical simulations on piezoresistivity of CNT/polymer nanocomposites. Nanoscale Research Letters, 7, 402.
Jack, D.A., Yeh, C.-S., Liang, Z., Li, S., Park, J.G., Fielding, J.C. (2010). Electrical conductivity modeling and experimental study of densely packed SWCNT networks. Nanotechnology, 21(19), 195703.
Langley, D., Lagrange, M., Nguyen, N., Bellet, D. (2018). Percolation in networks of 1-dimensional objects: Comparison between Monte Carlo simulations and experimental observations. Nanoscale Horizons, 3(5), 545–550.
Li, C. and Chou, T.-W. (2007). A direct electrifying algorithm for backbone identification. Journal of Physics A: Mathematical and Theoretical, 40(49), 14679–14686.
Li, C. and Chou, T.-W. (2008). Modeling of damage sensing in fiber composites using carbon nanotube networks. Composites Science and Technology, 68(15/16), 3373–3379.
Li, C. and Chou, T.-W. (2009a). Electrical conductivities of composites with aligned carbon nanotubes. Journal of Nanoscience and Nanotechnology, 9(4), 2518–2524.
Li, C. and Chou, T.-W. (2009b). Precise determination of backbone structure and conductivity of 3D percolation networks by the direct electrifying algorithm. International Journal of Modern Physics C, 20(800), 422–433.
Li, B. and Zhong, W.H. (2011). Review on polymer/graphite nanoplatelet nanocomposites. Journal of Materials Science, 46(17), 5595–5614.
Li, C., Thostenson, E.T., Chou, T.-W. (2007). Dominant role of tunneling resistance in the electrical conductivity of carbon nanotube-based composites. Applied Physics Letters, 91(22), 223114.
Li, C., Thostenson, E.T., Chou, T.-W. (2008a). Effect of nanotube waviness on the electrical conductivity of carbon nanotube-based composites. Composites Science and Technology, 68(6), 1445–1452.
Li, C., Thostenson, E.T., Chou, T.-W. (2008b). Sensors and actuators based on carbon nanotubes and their composites: A review. Composites Science and Technology, 68(6), 1227–1249.
Li, C., Thostenson, E.T., Chou, T.-W. (2010). Carbon-nanotube-based composites and damage sensing. In Multifunctional Polymer Nanocomposites, Jinsong, L., Lau, A.K.T. (eds). CRC Press, Boca Raton.
Li, W., Dichiara, A., Bai, J. (2013a). Carbon nanotube-graphene nanoplatelet hybrids as high-performance multifunctional reinforcements in epoxy composites. Composites Science and Technology, 74, 221–227.
Li, W., He, D., Bai, J. (2013b). The influence of nano/micro hybrid structure on the mechanical and self-sensing properties of carbon nanotube-microparticle reinforced epoxy matrix composite. Composites Part A: Applied Science and Manufacturing, 54, 28–36.
Li, W., Dichiara, A., Zha, J., Su, Z., Bai, J. (2014a). On improvement of mechanical and thermo-mechanical properties of glass fabric/epoxy composites by incorporating CNT-Al2O3 hybrids. Composites Science and Technology, 103, 36–43.
Li, W., He, D., Dang, Z., Bai, J. (2014b). In situ damage sensing in the glass fabric reinforced epoxy composites containing CNT-Al2O3 hybrids. Composites Science and Technology, 99, 8–14.
Lin, C., Wang, H., Yang, W. (2010). Variable percolation threshold of composites with fiber fillers under compression. Journal of Applied Physics, 108(1), 013509-1–013509-5.
Lu, X. (2017). Multiscale electro-mechanical modeling of graphene/polymer nanocomposites. PhD Thesis, Université Paris-Saclay, Gif-sur-Yvette.
Lu, W., Chou, T.-W., Thostenson, E.T. (2010). A three-dimensional model of electrical percolation thresholds in carbon nanotube-based composites. Applied Physics Letters, 96(22), 223106.
Lubineau, G., Mora, A., Han, F., Odeh, I.N., Yaldiz, R. (2017). A morphological investigation of conductive networks in polymers loaded with carbon nanotubes. Computational Materials Science, 130, 21–38.
Ma, X., Scarpa, F., Peng, H.X., Allegri, G., Yuan, J., Ciobanu, R. (2015). Design of a hybrid carbon fibre/carbon nanotube composite for enhanced lightning strike resistance. Aerospace Science and Technology, 47, 367–377.
Mierczynska, A., Mayne-L’Hermite, M., Boiteux, G., Jeszka, J.K. (2007). Electrical and mechanical properties of carbon nanotube/ultrahigh-molecular-weight polyethylene composites prepared by a filler prelocalization method. Journal of Applied Polymer Science, 105, 158–168.
Mora, A. (2018). A morphology study of nanofiller networks in polymer nano-composites: Improving their electrical conductivity through better doping strategies. PhD Thesis, Université des sciences et technologies du roi Abdallah, Djeddah.
Mora, A., Han, F., Lubineau, G. (2018a). Computational modeling of electrically conductive networks formed by graphene nanoplatelet-carbon nanotube hybrid particles. Modelling and Simulation in Materials Science and Engineering, 26(3), 035010.
Mora, A., Han, F., Lubineau, G. (2018b). Estimating and understanding the efficiency of nanoparticles in enhancing the conductivity of carbon nanotube/polymer composites. Results in Physics, 10, 81–90.
Mora, A., Verma, P., Kumar, S. (2020). Electrical conductivity of CNT/polymer composites: 3D printing, measurements and modeling. Composites Part B: Engineering, 183, 107600.
Mutiso, R.M. and Winey, K.I. (2015). Electrical properties of polymer nanocomposites containing rod-like nanofillers. Progress in Polymer Science, 40, 63–84.
Nanni, F., Mayoral, B.L., Madau, F., Montesperelli, G., McNally, T. (2012). Effect of MWCNT alignment on mechanical and self-monitoring properties of extruded PET-MWCNT nanocomposites. Composites Science and Technology, 72(10), 1140–1146.
Natsuki, T., Endo, M., Takahashi, T. (2005). Percolation study of orientated short-fiber composites by a continuum model. Physica A: Statistical Mechanics and its Applications, 352(2–4), 498–508.
Ounaies, Z., Park, C., Wise, K., Siochi, E., Harrison, J. (2003). Electrical properties of single wall carbon nanotube reinforced polyimide composites. Composites Science and Technology, 63(11), 1637–1646.
Pan, Y., Li, L., Chan, S.H., Zhao, J. (2010). Correlation between dispersion state and electrical conductivity of MWCNTs/PP composites prepared by melt blending. Composites Part A: Applied Science and Manufacturing, 41(3), 419–426.
Pang, H., Xu, L., Yan, D.X., Li, Z.M. (2014). Conductive polymer composites with segregated structures. Progress in Polymer Science, 39(11), 1908–1933.
Panozzo, F., Zappalorto, M., Quaresimin, M. (2017). Analytical model for the prediction of the piezoresistive behavior of CNT modified polymers. Composites Part B: Engineering, 109, 53–63.
Paszkiewicz, S., Szymczyk, A., Sui, X.M., Wagner, H.D., Linares, A., Ezquerra, T.A., Rosaniec, Z. (2015). Synergetic effect of single-walled carbon nanotubes (SWCNT) and graphene nanoplatelets (GNP) in electrically conductive PTT-block-PTMO hybrid nanocomposites prepared by in situ polymerization. Composites Science and Technology, 118, 72–77.
Rahman, R. and Servati, P. (2012). Effects of inter-tube distance and alignment on tunnelling resistance and strain sensitivity of nanotube/polymer composite films. Nanotechnology, 23(5), 055703.
Ren, X. and Seidel, G. (2013). Computational micromechanics modeling of piezoresistivity in carbon nanotube-polymer nanocomposites. Composite Interfaces, 20(9), 693–720.
Safdari, M. and Al-Haik, M. (2012). Electrical conductivity of synergistically hybridized nanocomposites based on graphite nanoplatelets and carbon nanotubes. Nanotechnology, 23(40), 405202.
Seidel, G. and Lagoudas, D. (2009). A micromechanics model for the electrical conductivity of nanotube-polymer nanocomposites. Journal of Composite Materials, 43(9), 917–941.
Seidel, G. and Puydupin-Jamin, A. (2011). Analysis of clustering, interphase region, and orientation effects on the electrical conductivity of carbon nanotube-polymer nanocomposites via computational micromechanics. Mechanics of Materials, 43(12), 755–774.
Simmons, J.G. (1963). Generalized formula for the electric tunnel effect between similar electrodes separated by a thin insulating film. Journal of Applied Physics, 34(1963), 1793–1803.
Stauffer, D. and Aharony, A. (1994). Introduction to Percolation Theory, 2nd edition. Taylor & Francis, Abingdon-on-Thames.
Takeda, T., Shindo, Y., Kuronuma, Y., Narita, F. (2011). Modeling and characterization of the electrical conductivity of carbon nanotube-based polymer composites. Polymer, 52(17), 3852–3856.
Thakre, P.R., Bisrat, Y., Lagoudas, D.C. (2009). Electrical and mechanical properties of carbon nanotube-epoxy nanocomposites. Journal of Applied Polymer Science, 116, 191–202.
Truong, V.T., Tsang, K.M.C., Keough, S.J., St John, N.A. (2006). Effect of sonication on the mechanical properties of poly (vinyl alcohol)/carbon nanotube composites. Micro- and Nanotechnology: Materials, Processes, Packaging, and Systems III, Proc. SPIE 6415, 641503.
Ventura, I.A., Zhou, J., Lubineau, G. (2015). Investigating the inter-tube conduction mechanism in polycarbonate nanocomposites prepared with conductive polymer-coated carbon nanotubes. Nanoscale Research Letters, 10(1), 485.
Wernik, J.M. and Meguid, S.A. (2010). Recent developments in multifunctional nanocomposites using carbon nanotubes. Applied Mechanics Reviews, 63(5), 050801.
Xin, F. and Li, L. (2011). Decoration of carbon nanotubes with silver nanoparticles for advanced CNT/polymer nanocomposites. Composites Part A: Applied Science and Manufacturing, 42(8), 961–967.
Yazdani, H., Smith, B.E., Hatami, K. (2016). Electrical conductivity and mechanical performance of multiwalled CNT-filled polyvinyl chloride composites subjected to tensile load. Journal of Applied Polymer Science, 133(29), 1–12.
Yu, Y., Song, G., Sun, L. (2010). Determinant role of tunneling resistance in electrical conductivity of polymer composites reinforced by well dispersed carbon nanotubes. Journal of Applied Physics, 108(8), 084319.
Zeng, X., Xu, X., Shenai, P.M., Kovalev, E., Baudot, C., Mathews, N., Zhao, Y. (2011). Characteristics of the electrical percolation in carbon nanotubes/polymer nanocomposites. The Journal of Physical Chemistry C, 115(44), 21685–21690.
Zhao, H. (2015). Preparation and characterization of carbon micro/nano hybrids and their functional composites. PhD Thesis, Université Paris-Saclay, Gif-sur-Yvette.
Zhao, H. and Bai, J. (2015). Highly sensitive piezo-resistive graphite nanoplatelet-carbon nanotube hybrids/polydimethylsilicone composites with improved conductive network construction. ACS Applied Materials and Interfaces, 7(18), 9652–9659.
Zhou, J. and Lubineau, G. (2013). Improving electrical conductivity in polycarbonate nanocomposites using highly conductive PEDOT/PSS coated MWCNTs. ACS Applied Materials & Interfaces, 5(13), 6189–6200.