
Chapter 10: MacOS Memory Acquisition
The last part of our book is devoted to an important topic – the memory investigation of systems running macOS. In the international desktop operating system market, macOS comes in at a deserved second. Despite the fact that Apple devices were originally considered individual devices for personal use, more and more users adopt them for work purposes every year. Recently, the use of macOS for work has reached a new level, with this operating system beginning to be used enterprise-wide (although this practice is currently more common in the United States). By 2021, Macintosh achieved a 23% share in US enterprises: https://www.computerworld.com/article/3604601/macs-reach-23-share-in-us-enterprises-idc-confirms.html.
With the growing number of macOS users and adoption by enterprises, the interest from threat actors in this operating system has also increased. The number of attacks on macOS has grown significantly in recent years. New tools specializing in attacks on this operating system have appeared, which means that the time has come to expand our arsenal with techniques and tools for macOS investigation. But before we can analyze the data, we need to collect it. That is why, as always, we begin with an overview of macOS memory acquisition techniques.
The following topics will be covered:
- Understanding macOS memory acquisition issues
- Preparing for macOS memory acquisition
- Acquiring memory with osxpmem
- Creating a Volatility profile
Understanding macOS memory acquisition issues
In the previous chapters, we discussed hardware and software methods of memory extraction. In the case of OS X and macOS, these methods will also be relevant, but there are a couple of extremely important things to consider. Let's start with the hardware-based solutions.
Recall that hardware-based acquisition tools rely on direct memory access and use technology such as FireWire or Thunderbolt. For now, almost every Macintosh offers a FireWire or Thunderbolt port, and acquiring memory content in this case does not require an administrator's password and unlocked computer. However, it obviously cannot be that simple. First, this technology only permits the acquisition of the first 4 GB of RAM, which will not be enough to thoroughly examine systems having more than 4 GB of RAM. Second, since 2013, Intel Virtualization Technology (VT-d) for directed input/output was enabled. This technology works as a remapper and effectively blocks Direct Memory Access requests. Another issue is that if FileVault is enabled, OS X and newer versions of macOS will automatically turn off Direct Memory Access when the computer is locked. The result is that using software solutions remains a priority.
Software acquisition tools, as with other operating systems, must be run from a user interface on an unlocked system. However, there are not many of these tools for OS X and macOS, especially those that work correctly on the latest versions of the operating system. Prior to OS X version 10.6, physical memory was accessible through the /dev/mem device file or through /dev/kmem, which points to the kernel's virtual address space. If these device files were available, the dd utility could be used to read the contents of memory through the device files. However, in recent versions of the operating system, this method is no longer available, and specialized acquisition tools are required. Since memory protection prevents a normal user from accessing memory directly, most memory acquisition tools rely on loading the BSD kernel extension or simply kext, which allows read-only access to physical memory. Once kext is loaded into the kernel, physical memory can be read from the /dev/pmem/ device file. However, to load kext into the kernel, administrator privileges and minor security configuration changes are needed. Let's take a look at all the steps that need to be taken before running the tools.
Preparing for macOS memory acquisition
There are not many macOS memory acquisition tools, and they all support only certain versions of the operating system. Therefore, before choosing and testing the right tool, we need to find out the version of the operating system we plan to work with. To see the macOS version installed, click the Apple menu icon in the top-left corner of your screen, and then select About This Mac:
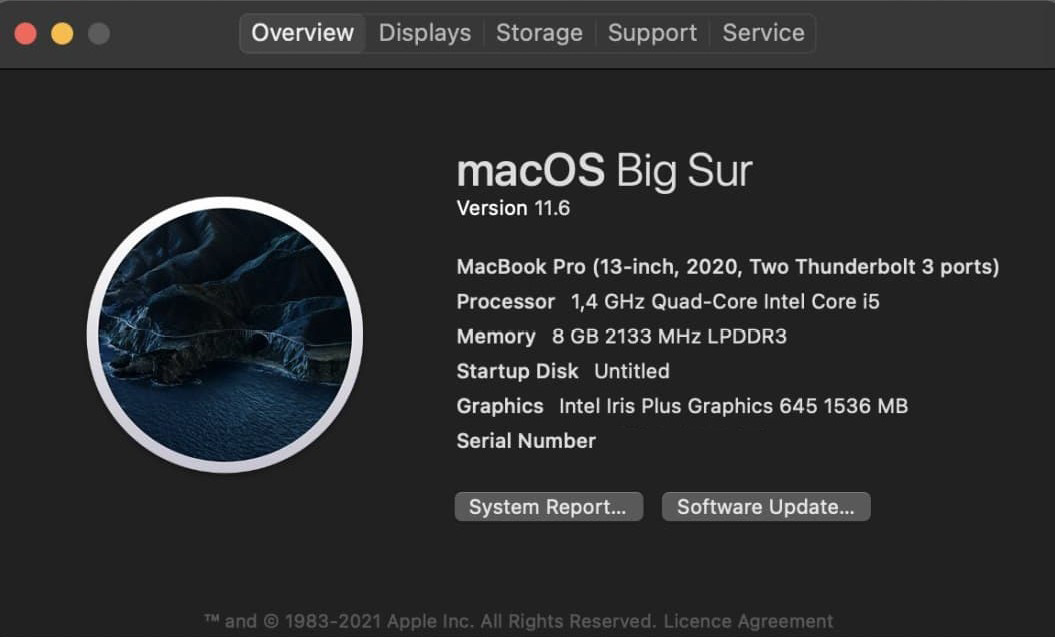
Figure 10.1 – About This Mac
In the window that appears, you will see the version of the operating system; in our case, it is macOS Big Sur version 11.6. Using the information about the OS version, you can find tools that support memory dumping from this OS.
At the time of writing, the following tools are publicly available:
- osxpmem – supports 64-bit versions of OS X Mountain Lion (10.8), OS X Mavericks (10.9), OS X Yosemite (10.10), OS X El Capitan (10.11), macOS Sierra (10.11), macOS High Sierra (10.13), macOS Mojave (10.14), and macOS Catalina (10.15)
- MandiantMemoryzeforMac – supports Mac OS X Snow Leopard (10.6) 32/64-bit, Mac OS X Lion (10.7) 32/64-bit, and OS X Mountain Lion (10.8) 64-bit
Although these tools cover a fairly wide range of OSes, they do not allow you to get memory dumps of the latest macOS versions. In addition to these tools, there are proprietary solutions, such as Cellebrite Digital Collector, SUMURI RECON ITR, or Volexity Surge Collect, which try to update their products and add support for newer versions of macOS. For example, SUMURI recently announced that RECON now supports macOS Monterey, while Volexity added support for new Macintoshes on the M1 to Surge.
Important Note
Do not forget that to work with the target host, you need to prepare removable media or a network share where you will put all the necessary tools and files, as well as the resulting memory dump.
Once you have selected the appropriate tool, you can start testing it. To do this, you will need a virtual machine with configurations similar to those of the target host. Unlike Windows and Linux, macOS is not so easy to install as a guest system. The thing is to create a macOS virtual machine; you will have to do a little trick with the configuration files. Luckily, deployment guides are not too hard to find. Here, for example, is a pretty good guide on how to deploy macOS virtual machines on Windows using VirtualBox and VMware: https://www.makeuseof.com/tag/macos-windows-10-virtual-machine/.
After creating the virtual machine, you can move on to testing the tools. Since macOS has better protection against launching third-party files than Windows and Linux, we will have to use some tricks, which we will go over later.
Acquiring memory with osxpmem
This time, we will look at just one tool for creating memory dumps – osxpmem. This tool was chosen because it is freely distributed and supports the largest number of OS X and macOS versions.
You can download this tool from the official GitHub repository: https://github.com/Velocidex/c-aff4/releases. In the Releases tab, find the latest release containing osxpmem. At the time of writing, this is Release 3.2:
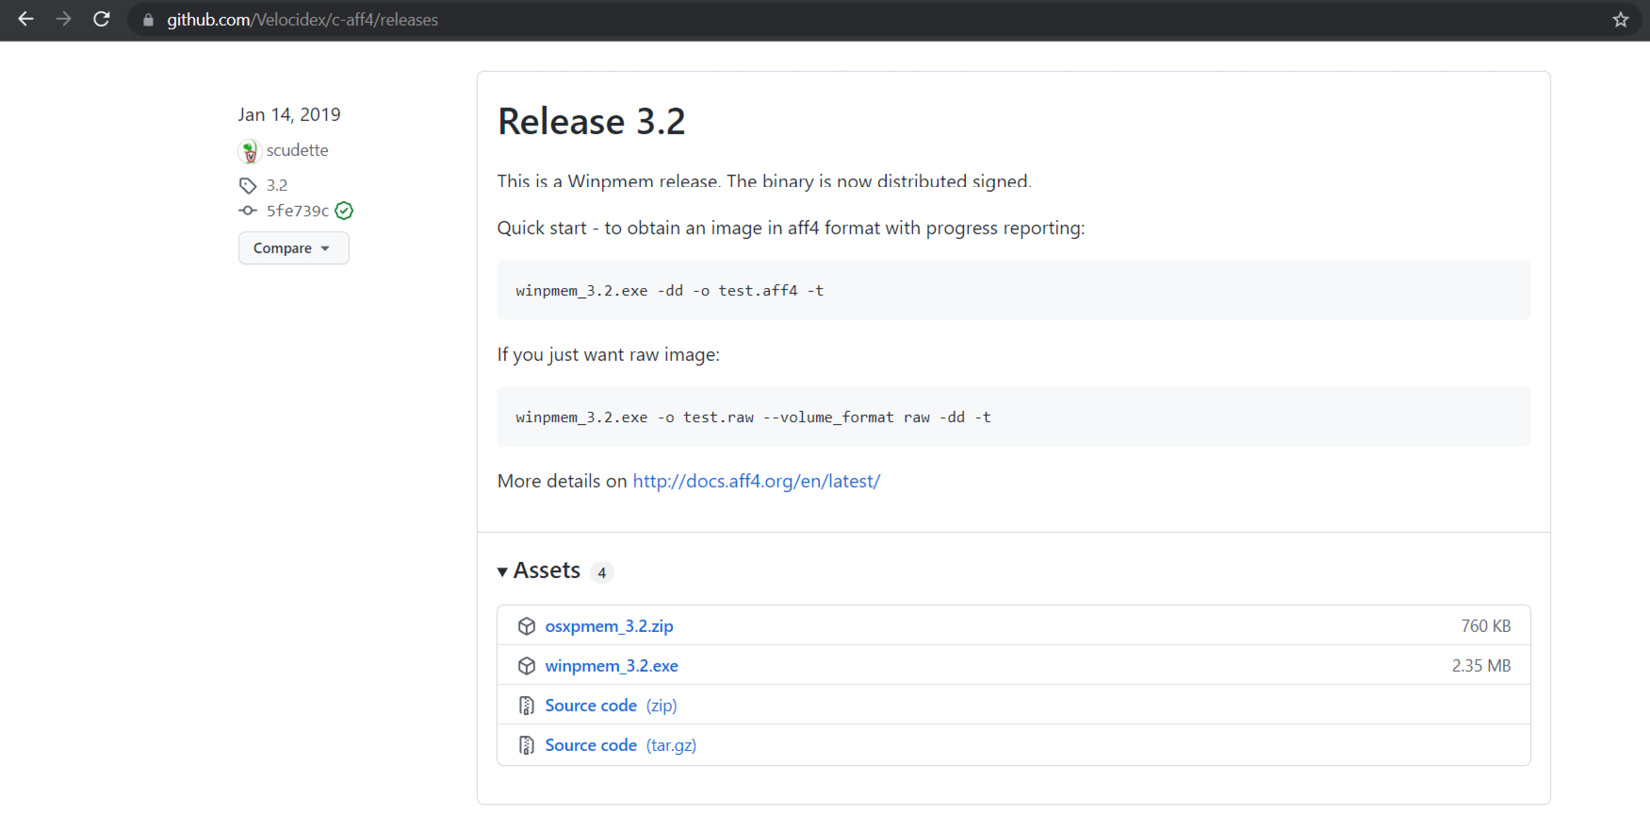
Figure 10.2 – The latest release with osxpmem
Download the osxpmem archive and unzip it. Inside, you will find osxpmem.app, our tool for creating memory dumps. This is a command-line tool and is run through the terminal. First of all, we need to open the terminal and go to osxpmem.app. From this location, we need to load kext with kextutil, which looks like this:
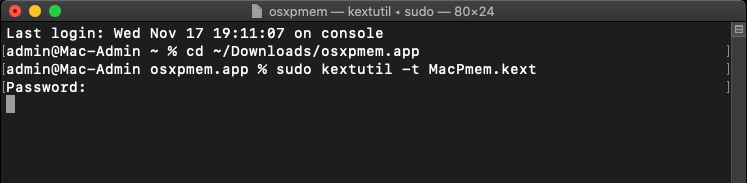
Figure 10.3 – MacPmem.kext loading
The main difficulty in using tools such as osxpmem is macOS security policies. So, if we try to run this tool without doing any extra steps, we first get a series of File owner/permissions are incorrect errors and, secondly, a message saying that the software has been blocked.
To solve the first problem, we need to change the owner and permissions of our files. To do that, run the chown and chmod commands in the terminal. To check the changes applied, you can use the ls -lah command, as shown next:
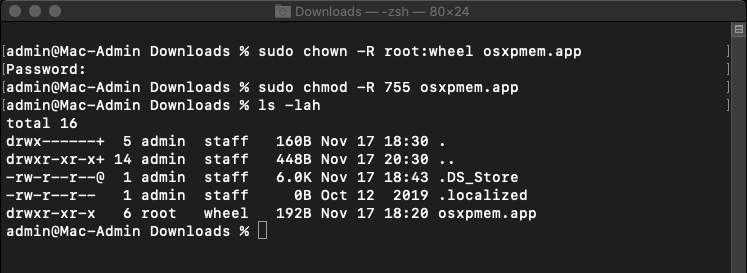
Figure 10.4 – Owner and permissions change
To solve the second problem, open Settings and go to Security & Privacy. Here, in the General tab, we will see information about blocking our program:
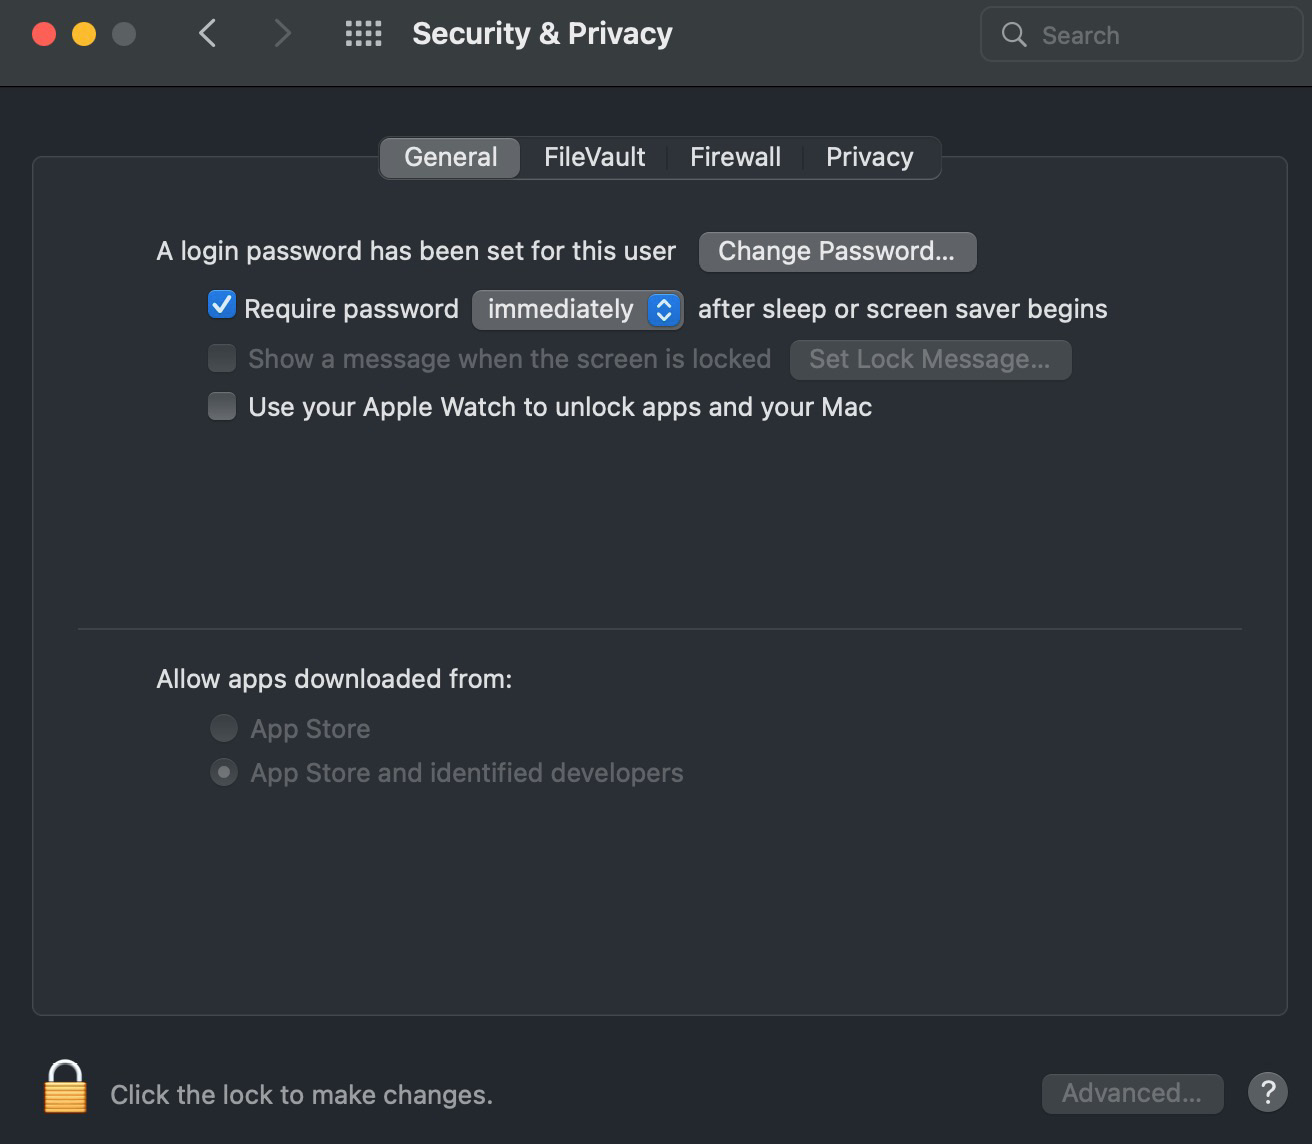
Figure 10.5 – The Security & Privacy General tab
To unlock our program, we need to click on the lock at the bottom and agree to unlock it.
In addition, you may need to disable system integrity protection. To do this, run the following command in the terminal:
csrutil disable
In newer versions – for example, in macOS Catalina – you may need to do more global actions, as you can only disable system integrity protection in Recovery mode.
Important Note
Naturally, when changing configurations in Recovery mode, we will need to reboot the host, which means that most data will be lost. Nevertheless, in cases where we are dealing with persistent malware or a reverse shell listening to a certain port and waiting for attackers to connect, the analysis of the memory dump obtained after a reboot can still give us useful information.
To disable system integrity protection, go to Recovery mode. To do this, reboot the system and press command + R (if you are using a virtual machine and use Windows as a host OS, press Win + R). This will put you in the correct mode. In the window that appears, select Utilities and Terminal:
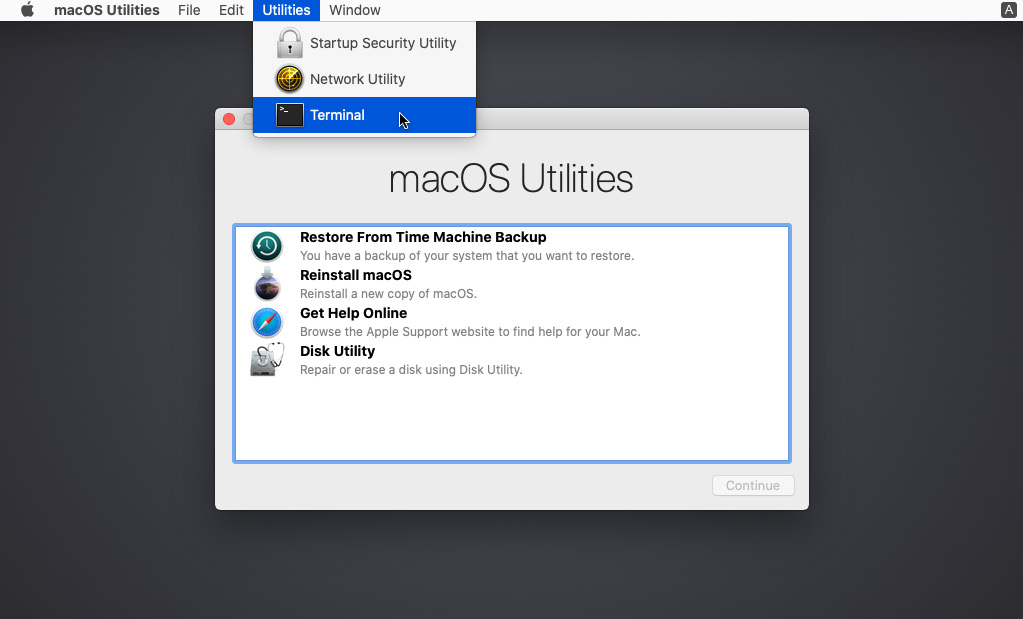
Figure 10.6 – Recovery mode
In the terminal, we need to run the command mentioned earlier:
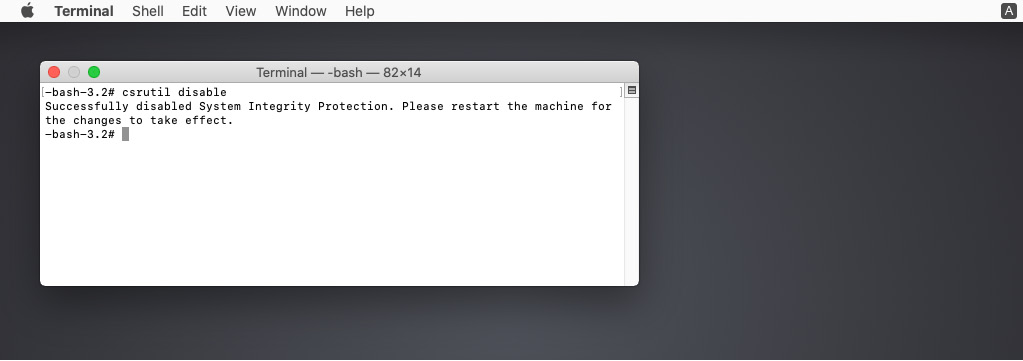
Figure 10.7 – Disabling system integrity protection
As you can see, you have to reboot the system again to apply the changes successfully. After the reboot, you can open the main terminal and load kext again. This should work without errors.
After loading kext, you need to run a command that will collect the memory dump. The command will look like this:
sudo osxpmem.app/osxpmem --format raw -o mem.raw
The --format option is used to specify the format of the memory dump, and the -o option is needed to specify the path to the output file.
You will end up with a mem.raw file containing the raw memory dump. In our case, performing the preceding steps looks like this:
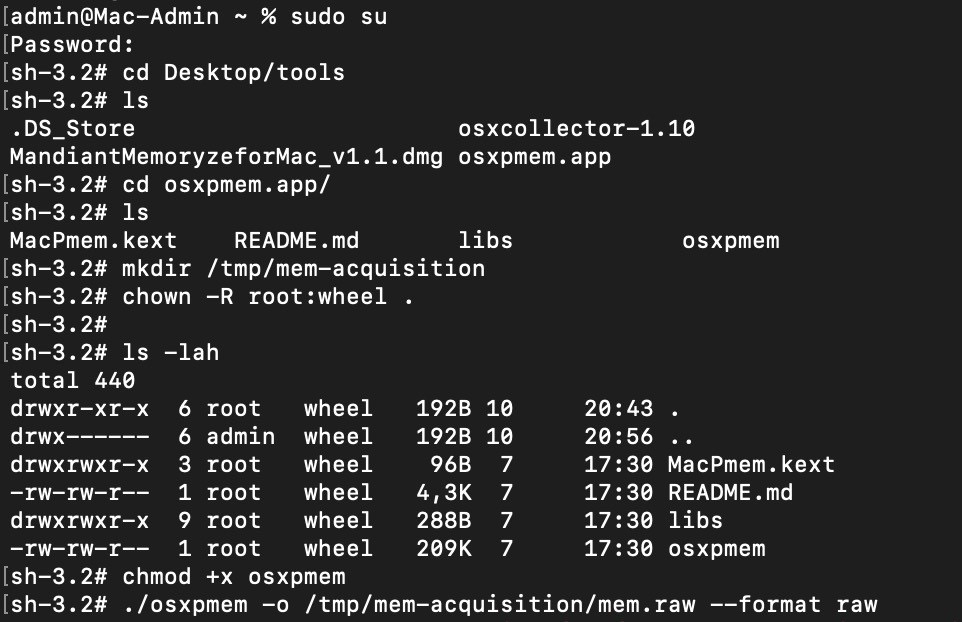
Figure 10.8 – Memory acquisition
If you run ls -lah, you will see the resulting file:
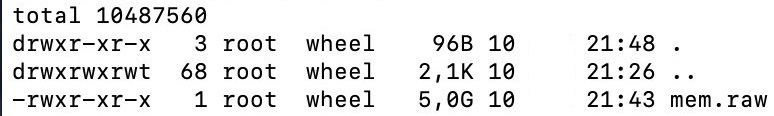
Figure 10.9 – The created memory dump
After that, you can unload the kernel extension using the following command:
$ sudo osxpmem.app/osxpmem -u
This way, we can get a memory dump, but this is only the beginning of the journey. To be able to work with this file using Volatility, we need to create an appropriate profile. This is what we will talk about in the next section.
Creating a Volatility profile
To create a macOS profile, we will need to install a few additional tools. First of all, we will need the Brew package manager, which can be installed by following the instructions from the official website: https://docs.brew.sh/Installation.
Basically, the only thing you need to do is to run the command located on the home page:
$ /bin/bash -c "$(curl -fsSL https://raw.githubusercontent.com/Homebrew/install/HEAD/install.sh)"
The Brew manager is needed to install the dwarfdump that we already know, so once brew is installed, feel free to run the following command in the terminal:
$ brew install dwarf
The last thing to download is KernelDebugKit. To do this, use this link: https://developer.apple.com/download/all/?q=debug. Note that in order to gain access, you will need an Apple ID, which you can create by clicking on the Create yours now link. After entering your ID, you will see the Downloads page:

Figure 10.10 – Apple Developer Downloads page
On this page, you need to find the KDK that corresponds to the version of your OS. For example, KDK 12.1 shown in the screenshot corresponds to the latest macOS Monterey. After downloading the KDK, you need to install it. This can be done in a standard way. A double-click will mount the file and open the installer, which will guide you through the installation process.
You can verify that everything is installed by using the ls command, as after installation, your version of the KDK should appear in /Library/Developer/KDKs.
If the KDK is there, you can start getting debug info from the kernel. To do this, we use dwarfdump, which should get the following parameters:
- -arch: Architecture – we specify i386 for 32-bit systems and x86_64 for 64-bit systems
- -i: The path to the kernel.dSYM file, located in KDK
We also need to redirect the output to a file with the dwarfdump extension.
Thus, if we work with the 64-bit macOS Mojave, the command will look like this:
$ dwarfdump -arch x86_64 -i /Library/Developer/KDKs/KDK_10.14.6_18G2016.kdk/System/Library/Kernels/kernel.dSYM > 10.14.6_x64.dwarfdump
In our case, the preceding steps look like this:

Figure 10.11 – Getting the dwarf debug info from the kernel
As a result, we get the 10.14.6_x64.dwarfdump file, which we place in the dwarf directory. Next, we will need Volatility. In the terminal, go to volatility/tools/mac and execute the convert.py script, passing it the path to the created dwarfdump and the path to the output file as arguments. In our case, the command will look like this:
$ python convert.py 10.14.6_x64.dwarfdump converted_10.14.6_x64.dwarfdump
This will create a Linux-style output readable by Volatility. After that, we need to create the types from the converted file:
$ python convert.py converted_10.14.6_x64.dwarfdump > 10.14.6_x64.vtypes
Next, we need to generate symbol information using dsymutil:
$ dsymutil -s -arch x86_64 /Library/Developer/KDKs/KDK_10.14.6_18G2016.kdk/System/Library/Kernels/kernel > 10.14.6_x64.symbol.dsymutil
Once again, we pass the information about the architecture used and the path to the kernel file from the KDK as arguments. The output is redirected to a file with the .dsymutil extension.
Our last step is to create a ZIP file of the .dsymutil and .vtypes files. For this purpose, we can use the following command:
$ zip 10.14.6_x64.zip 10.14.6_x64.symbol.dsymutil 10.14.6_x64.vtypes
Finally, you will get your profile. To use the newly created profile, simply put it in the volatility/plugins/overlays/mac directory.
Important Note
The convert.py script works fine with versions prior to High Sierra. With newer versions, you may have some problems because the structure of dwarf has changed slightly. To solve this problem, you will need to modify the convert.py script.
Creating a macOS profile is not an easy task. However, if you need to analyze a version of macOS up to and including High Sierra, you can use a ready-to-use profile from GitHub: https://github.com/volatilityfoundation/profiles/tree/master/Mac. In contrast, if you use proprietary solutions such as Volexity Surge Collect, you will have profiles ready for even the newest versions of macOS. If your target host runs on Intel, then profiles from Volexity can be used immediately for analysis with Volatility. With the M1, the situation is a bit different. Since this is an ARM architecture chip, there are additional arguments that should be passed in the Volatility command line. These arguments are the Kernel Address Space Layout Randomization (KASLR) shift and the Directory Table Base (DTB) address. The first one is for specifying the exact location of the variables in the memory dump, and the second one is for address translation. At the time of writing this book, the support for automatic extraction of these parameters for ARM is not implemented. So, you need to specify these values manually. Fortunately, you can find them in the meta.json file created by Surge Collect. In this case, when you run Volatility, in addition to the standard options and profile, you also add the following:
- --shift – value, which corresponds to the KaslrSlide parameter in meta.json
- --dtb – value, which corresponds to the dtb parameter in meta.json
Thus, running Volatility will look like this:
$ ./vol.py -f <path to memory dump> --profile=<profile>
--shift=< KaslrSlide value> --dtb=<dtb value> <plugin>
Another important point is that to analyze memory dumps taken from Macintoshes on M1 in Volatility, you need ARM64 support. In this case, you can use the Volatility fork: https://github.com/tsahee/volatility/tree/arm64.
Summary
Compared to the OSes discussed earlier, macOS is the most difficult to work with. Most of the tools that support creating memory dumps on newer versions of macOS are paid, and the freeware tools support dumping only for macOS versions up to Catalina.
A further difficulty is launching the tools themselves. Due to macOS security features, it is necessary to change a number of settings in order to run programs from third-party sources. This is especially true for tools that use kext loading.
Another difficulty is the creation of Volatility profiles for newer versions of macOS. This is due to the fact that creating a profile requires converting a dwarf file into a format recognized by Volatility, and the scripts provided by Volatility developers and found in the official GitHub repository do not work with the latest versions of macOS.
Given all the difficulties that can be encountered when creating a macOS memory dump in a form suitable for analysis, before starting this process, we recommend that you assess the situation, consider the pros and cons, and weigh up the need to create a memory dump very carefully.
In this chapter, we have covered the process of creating memory dumps on macOS systems. The next topic to be covered is an equally fascinating one – examining the obtained memory dumps.