
Chapter 9: Malicious Activity Detection
Under most circumstances, the main goal of a memory forensic investigation is to look for malicious activity. According to recent TrendMicro (https://www.trendmicro.com/vinfo/us/security/news/cybercrime-and-digital-threats/a-look-at-linux-threats-risks-and-recommendations) and Group-IB (https://www.group-ib.com/media/ransomware-empire-2021/, https://blog.group-ib.com/blackmatter) research, attacks on Linux-based systems are on the rise, and many threat actors have added specialized software targeting Linux-based systems to their arsenal. For example, ransomware operators such as BlackMatter, RansomExx, and Hive have added corresponding versions to their arsenal. Furthermore, post-exploitation frameworks and individual scripts are also used to attack Linux-based systems. At the same time, exploitation of vulnerabilities and the use of security misconfigurations remain the most widespread initial access techniques, especially when we are talking about web applications.
The main activity we are going to look at is almost the same – network connections, injections into processes, and access to atypical resources. This is what we will try to focus on, but this time we will try to break down different analysis techniques with concrete examples.
In this chapter, we will discuss the following topics:
- Investigating network activity
- Analyzing malicious activity
- Examining kernel objects
Investigating network activity
Since most malware needs to communicate with a command-and-control server, download additional modules, or send some data, the appearance of network connections is unavoidable. However, before going on to investigate network connections, it would be a good idea to find out which network interfaces were used on our host and how they were configured. To do this, we can use the Volatility linux_ifconfig plugin, which provides all the necessary information in the following way:

Figure 9.1 – Information about network interfaces
In the output, we can see that there are three interfaces used on the investigated host:
- lo – A loopback interface with the standard 127.0.0.1 IP address
- ens33 – A network interface with the 192.168.168.144 IP address
- ens38 – A network interface with the 192.168.3.133 IP address
We can now start investigating active network connections. For this purpose, Volatility has the linux_netstat plugin, which can be run as follows:
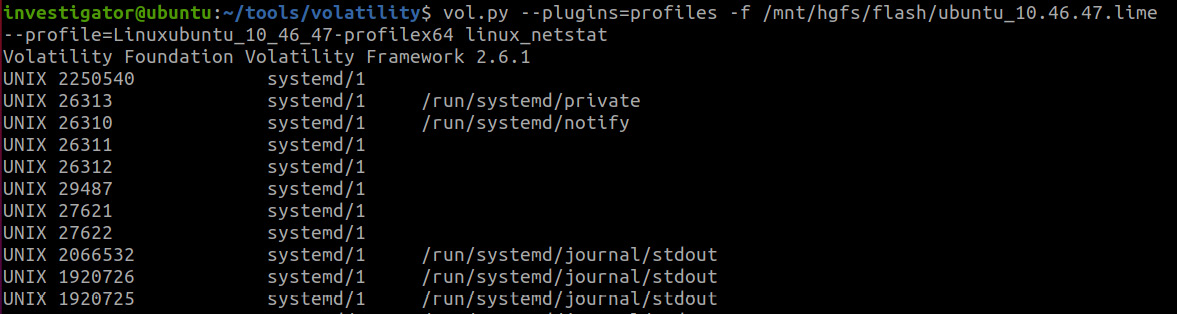
Figure 9.2 – Volatility linux_netstat plugin
As you can see, in this case, we will also have quite an extensive output, and it won't only be associated with the network connections we are directly interested in, so it is better to redirect the output to a text file:

Figure 9.3 – Active network connections
In this case, we see a connection established by the Firefox browser, as well as multiple connections established by Postgres and Ruby. This activity can be observed in various situations, one of which is the use of the Metasploit post-exploitation framework on the attacker's host. Also note the connection to the 192.168.3.132 IP address, which was set up using port 22, which is typical for SSH. It is likely that this was the victim's host, which was connected through SSH.
Another way to check the network activity is to use Bulk Extractor, as it allows us to extract leftover network traffic from memory dumps. In this case, we use the net scanner, as shown here:

Figure 9.4 – Bulk Extractor net scanner
The output will contain the packets.pcap file, which is a dump of network traffic. This file can be opened with Wireshark, one of the most widely used network protocol analyzers. To get this tool, simply go to the official website (https://www.wireshark.org/), click on the Download icon, and choose the installer version suitable for your system.
After installation, you can run Wireshark and simply drag and drop the packets.pcap file inside:

Figure 9.5 – Dump of the network traffic opened with Wireshark
Here, you can see the endpoints statistics and find out what IP addresses were connected to. To do this, open the Statistics tab and search for Endpoints:

Figure 9.6 – Endpoints
Similarly, you can see statistics on the protocols used:

Figure 9.7 – Protocol hierarchy
We can examine individual packets or try to extract transmitted objects, and it is also possible to configure filters and check communication with individual IP addresses. In our case, for example, you can check whether an SSH connection was actually established with a specific IP address by using the simple ip.addr==192.168.3.133 && ssh filter:

Figure 9.8 – Wireshark filter for SSH
In the figure, we see a large number of packets passing between our IP and the 192.168.3.132 IP. Such communication will naturally attract our attention.
Here is another example of how analysis of network connections or network traffic from the memory dump can be useful:

Figure 9.9 – Meterpreter activity
Here, we can see active use of port 4444. Remember in Chapter 5, Malware Detection and Analysis with Windows Memory Forensics, when we talked about how some ports are used by default by different software? This is exactly the case, and port 4444 is used by default by the Meterpreter reverse shell. So, we can already tell from one traffic analysis that there are processes on the examined host that are related to Meterpreter.
Let's look at one more example:

Figure 9.10 – Nginx activity
In the output of linux_netstat, we can see that the investigated host is used as a web server because on port 80, the nginx process is listening:

Figure 9.11 – SSH connections
In addition, we can see several SSH connections with different IP addresses. In this case, we can conclude that one of those IP addresses could potentially be used by an attacker.
Since the output of the plugin contains information on the processes that initiated the connections, naturally, sooner or later, we will get to investigating those processes.
In all these examples, we see traces of potentially malicious activity. Let's talk about how to analyze this kind of activity.
Analyzing malicious activity
Let's take a closer look at the last example. We saw that we had several SSH connections. We can analyze the processes that might be related to that. To do that, let's use the linux_pstree plugin and add sshd process identifiers – 29897 and 23251:

Figure 9.12 – Volatility linux_pstree
In Figure 9.12, we can see that the child processes of sshd are bash as well as sudo, which means that elevated privileges were used. In this case, we can search the bash history as well as dump and analyze the memory of these processes.
We start with the bash history. For this, we will use the linux_bash plugin:
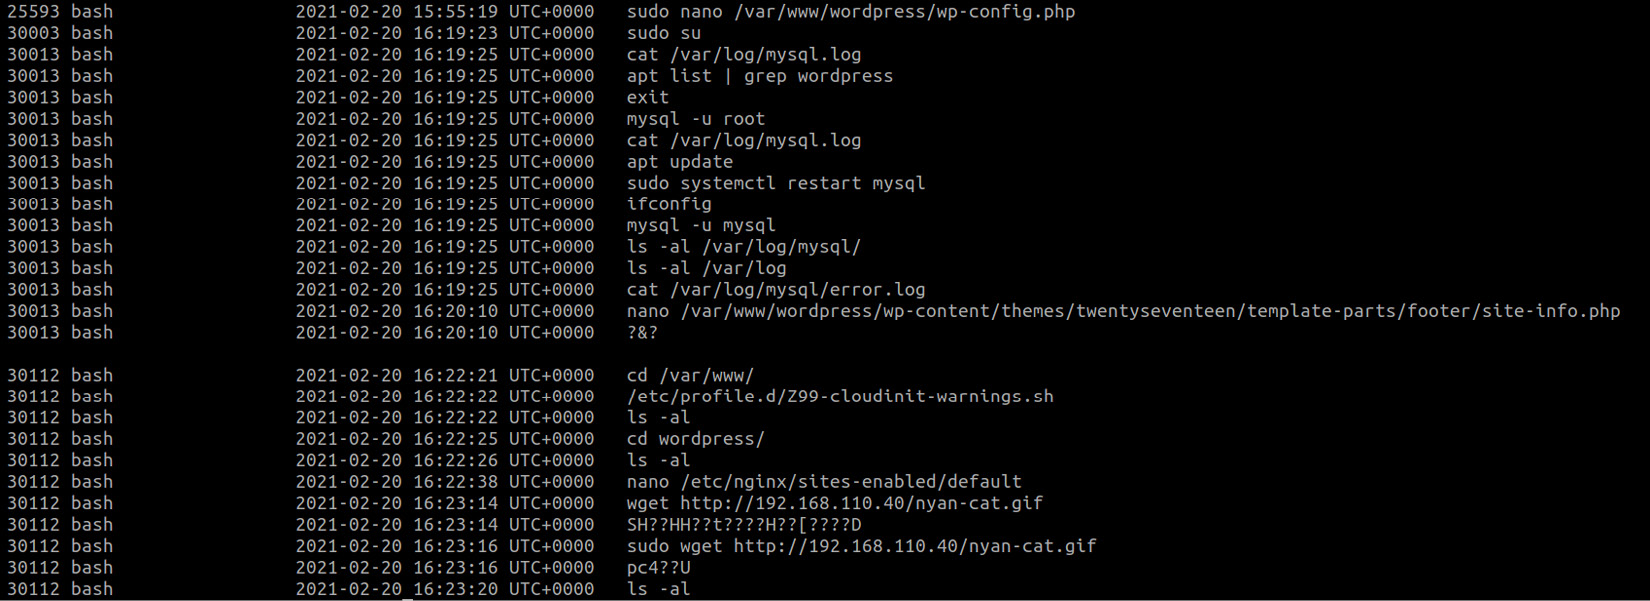
Figure 9.13 – Bash history
Here, we can see that someone was working with MySQL and WordPress, and we can see the interaction with the site-info.php file, as well as the nyan-cat.gif download associated with the bash process with the 30112 PID.
We can check which user ran bash in this case. To do this, we will use the already known linux_psenv Volatility plugin:

Figure 9.14 – Bash process's environment
The output of this plugin allows us to determine that this activity was performed within the SSH connection from the 192.168.110.40 IP address by the user admin. We can search for information about this user. In the previous chapter, we already mentioned that this information can be found in the /etc/passwd file, so let's use the linux_recover_filesystem plugin and try to recover the filesystem from memory. To do that, we will use the following command:
$ vol.py --plugins=profiles -f /mnt/hgfs/flash/ubuntu-server.vmem --profile=Linuxubuntu-server_17_47_52-profilex64 linux_recover_filesystem -D /mnt/hgfs/flash/recovered/
In our case, the restored filesystem will be placed in the recovered folder:

Figure 9.15 – Recovered folder content
As you can see in the figure, the /etc directory failed to recover; nevertheless, we have /var/log where we can find the auth.log file:
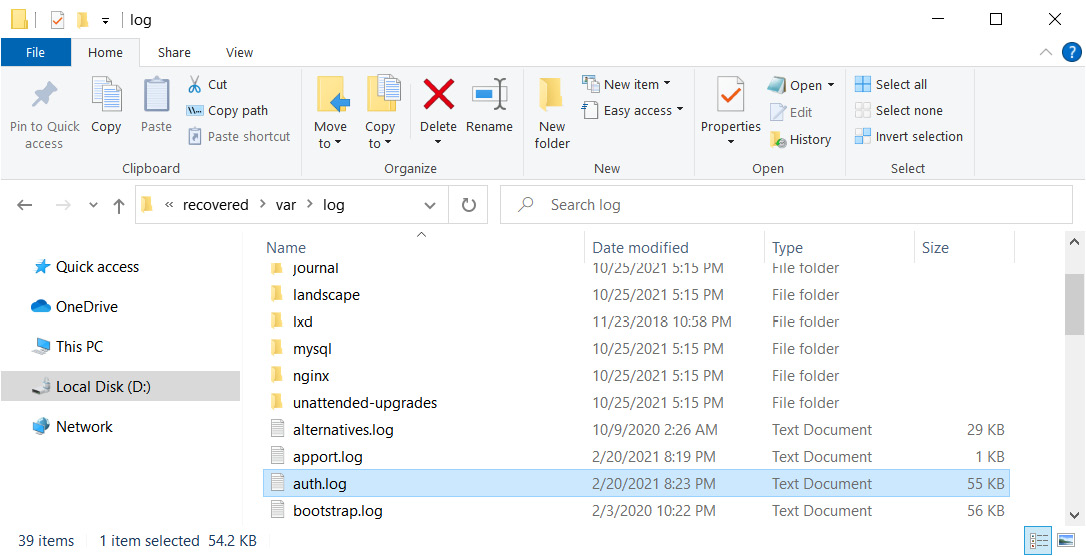
Figure 9.16 – Recovered auth.log file
This file logs all authentication attempts, and we can find the following:

Figure 9.17 – The content of auth.log file
Note that from here we get the information that the admin user was created at the time of the attack, and we also have a specific timestamp for its creation. After that, we can also see several logins from this user and its use of root, on behalf of which our picture was downloaded. We also see that the picture was uploaded to /var/www/wordpress. Fortunately, the linux_recover_filesystem plugin was able to partially recover this folder:
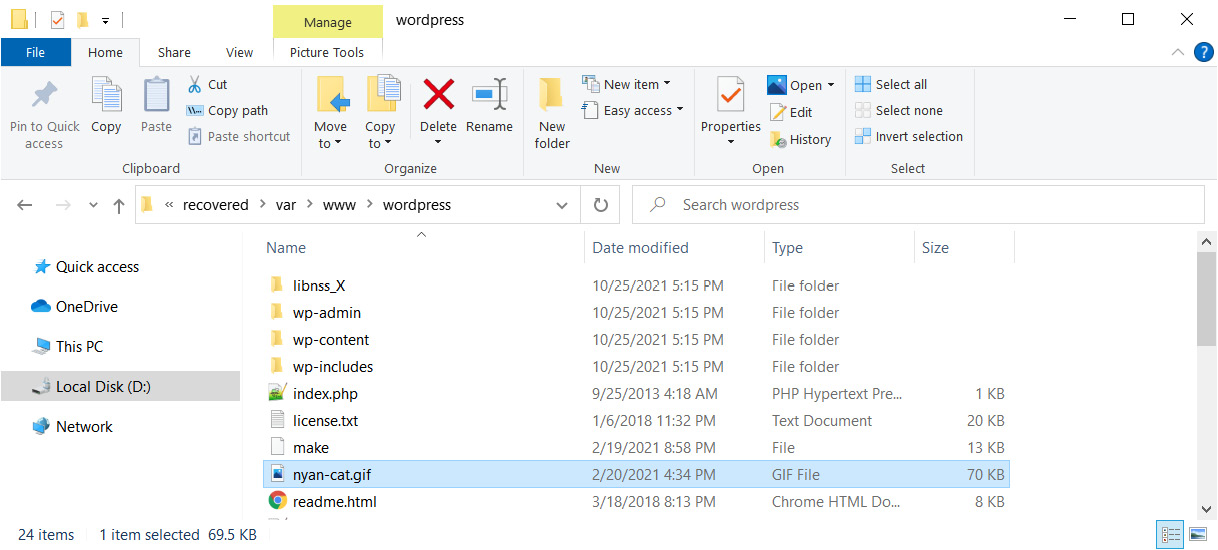
Figure 9.18 – Recovered WordPress folder
Here, we can see our picture. So, we need to find out what role it plays here and how exactly the attacker gained access to the system.
Let's add the network traffic dump extracted from the memory dump to our investigation. To extract the traffic, we run Bulk Extractor:
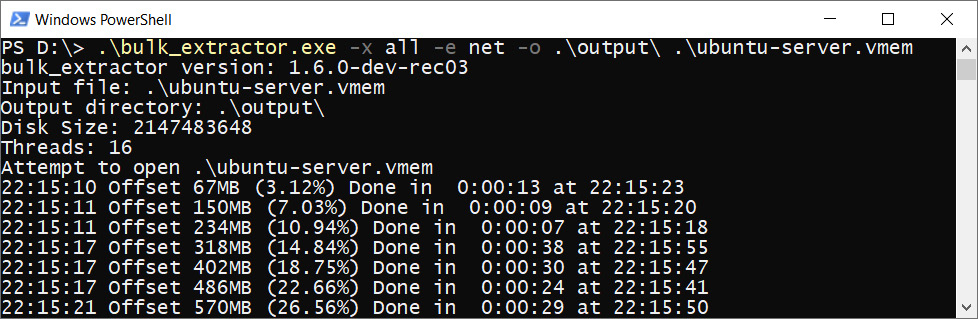
Figure 9.19 – Network traffic extraction
Now, we open the packets.pcap file in Wireshark. Examining the packets, you may come across the following:

Figure 9.20 – Wireshark packet analysis
We see a GET request with interesting parameters. As you can see, the user agent listed here is WPScan v.3.8.7. This means that this request was made using the WPScan tool, used to search for vulnerabilities in the content management system WordPress. Similar information should be logged in the nginx access log. This log was also recovered using linux_recover_filesystem and can be found in /var/log/nginx:

Figure 9.21 – Recovered access log
In access.log, we can see a huge number of requests sent by WPScan from an IP address we already know. If we go further, we can also see the following:
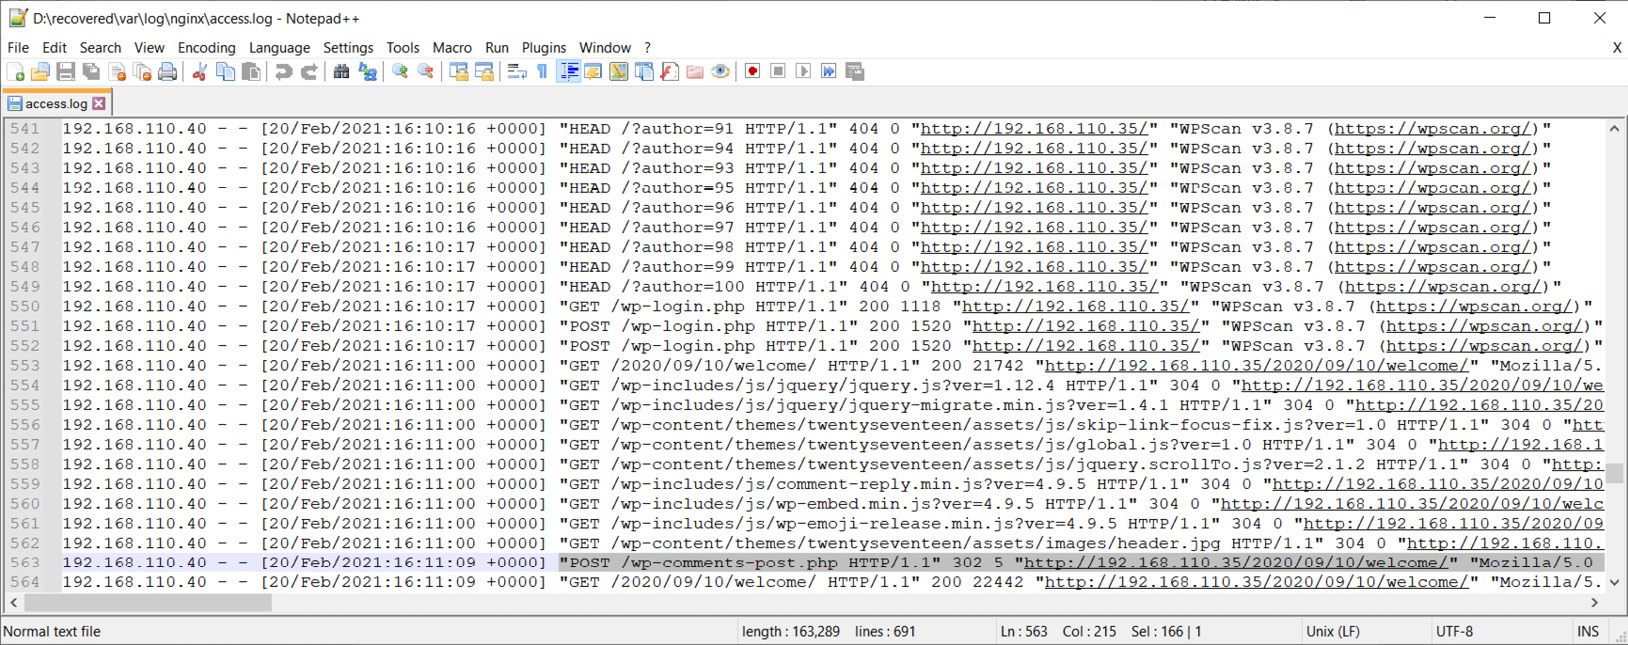
Figure 9.22 – Comment post
After the scan was completed, a POST request was sent with a comment; possibly, a vulnerability related to comment sending was used for the initial access.
Continuing the analysis, we can try to extract objects transmitted during the network session using Wireshark's Export Objects feature:

Figure 9.23 – Objects export in Wireshark
As you can see in the preceding figure, in our case several objects have been found that we can try to extract. This includes some comments. Let's check them out:
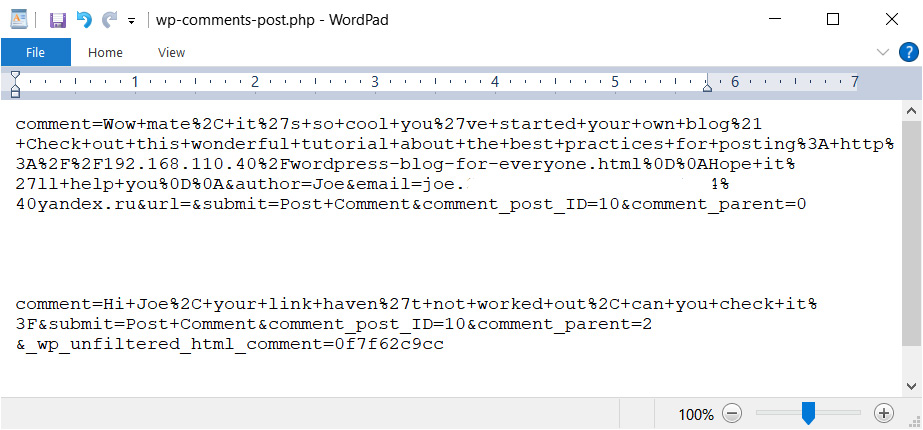
Figure 9.24 – Exported comments
As we can see, one of the users left a comment on the blog with a link accessing the same 192.168.110.40 IP address. You can also see in the traffic dump that the same SSH connections started to appear sometime after the attempt to open the link.
If we consider the situation from the point of view of WordPress, the comments sent by users must be saved in the database. Accordingly, you can look for information about them in the MySQL logs or in the memory of this process. From the list of processes, we can say that our mysqld process related to mysql deamon has the identifier 29602:

Figure 9.25 – Process ID of mysqld
Now, we can dump the mapping of this process with the linux_dump_map plugin:

Figure 9.26 – Volatility linux_dump_map
Now, it is the turn of the strings utility:
$ for file in /mnt/hgfs/flash/mysql/*; do strings "$file" >> /mnt/hgfs/flash/mysql_strings.txt; done
We can now explore the strings output and look for information about our comments:
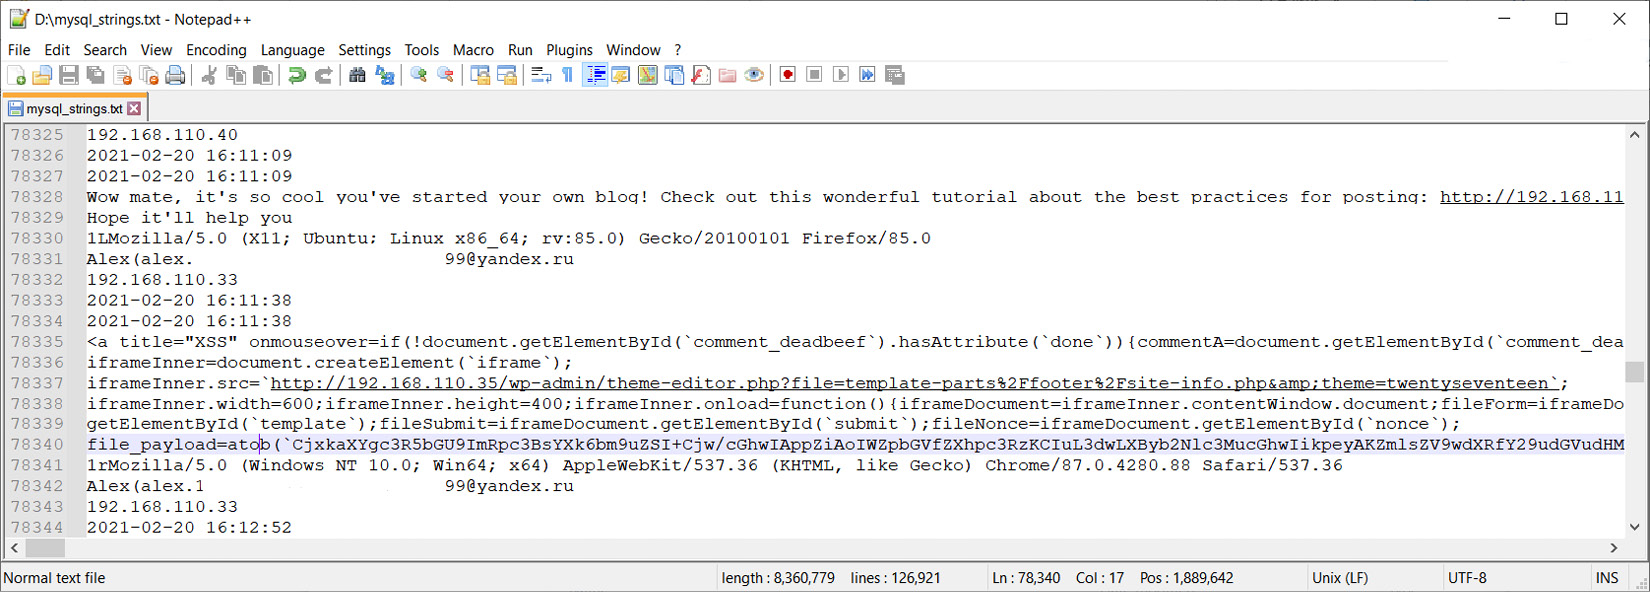
Figure 9.27 – Comments in the mysqld process memory
Bingo! Here, we can see not only the comment that was sent but also the actual payload that was used. Now, we know for sure that the attackers used exploitation of vulnerabilities for the initial access. That's one mystery solved.
In Figure 9.27, we can also note the interaction with the site-info.php file in the footer. Since we managed to extract the WordPress folder along with the filesystem, let's find this file:

Figure 9.28 – WordPress-related files
The content of this file looks as follows:

Figure 9.29 – The content of the site-info.php file
Based on all the information obtained, we can conclude that after accessing the host, the attacker changed the source code of the site so that now when users visit the compromised resource, they will see a picture instead of a blog.
Let's consider in a similar way the Meterpreter example we mentioned earlier. This is an example worthy of special attention because this type of payload is most often found on Linux-based systems involved in incidents. So, we have information that some connections were made using port 4444. Let's try to find out which process the Meterpreter is associated with. The most logical thing to do here would be to check the network connections and look for connections to ports and addresses we know, and then look for the process that established the connection. However, you may come across a situation where there is no information about network connections or no information about the exact connections you are looking for. In this case, you can use YARA rules with the linux_yarascan plugin to try to find a process with our IP address in its memory. Also, injections into processes are often related to Meterpreter, as attackers need to somehow put the payload into memory. In this case, Volatility has the linux_malfind plugin, which is an analog of the Windows plugin with the same name. Let's run it:

Figure 9.30 – Volatility linux_malfind
In the output of the plugin, we can find something similar. We have a rules_for_emplo process, associated with the rules_for_employees file, which is located in the it-sec user downloads. The inject found there starts with ELF, so we are dealing with something executable.
Important Note
Executable and Linkable Format (ELF) is a binary file format used in many modern UNIX-like operating systems, such as Ubuntu, FreeBSD, Linux, and Solaris.
First of all, we can try to analyze the rules_for_emplo process. For this purpose, we can extract the executable itself using the linux_procdump plugin:

Figure 9.31 – Executable extraction
After extraction, we can either calculate the hash of the executable and check it in cyber threat intelligence platforms or try to run the file in a controlled environment and find out what it does. Of course, if you have reverse engineering skills or have a dedicated malware analysis team, they are good options as well. Another way is to extract the memory of this process with the linux_dump_map plugin:

Figure 9.32 – Process memory extraction
Then, we can use our script again to get readable strings:
for file in /mnt/hgfs/flash/rules_for_employees/*; do strings "$file" >> /mnt/hgfs/flash/rules_strings.txt; done
The result will be the following:

Figure 9.33 – IP addresses in the rules_for_emplo process memory
In the strings extracted from the memory of our process, we can find the 192.168.168.144 IP address with which we saw many connections and the tcp://192.168.168.153:4444 string. From that, we can conclude that reverse_tcp was used.
Let's look a little bit more into what happened after the rules_for_emplo process started. We will use the linux_pstree plugin to get a list of active processes and display their parent and child relationships:

Figure 9.34 – Child processes of rules_for_emplo
Here, we see the rules_for_emplo process, which spawns shells, including ones with elevated privileges, Python and systemctl. Let's see how these processes were started. To do this, we will use the linux_psaux plugin:

Figure 9.35 – Starting arguments of child processes
Here, we see that Python was used to spawn a tty shell and get sudo. To understand what was going on here, we can use the linux_bash plugin to see what commands were executed:

Figure 9.36 – Bash history
From the output of this plugin, we can see that the attacker was trying to install a cron job to get persistence, while systemctl was used to reload the cron service and check its status. We can also notice that the /tmp directory was used as a working directory for creating and storing temporary files. It would be nice to know what cron job was created in the end. On Linux-based systems, such activity should be logged to /var/log/cron.log, from which you can get information about the job that was created.
By the way, if you are interested in resources used by a certain process, you can still use the linux_lsof plugin. The point is that, in Linux philosophy, everything is a file. That is to say, if the process used text files, sockets, or pipes, all of those things can be found in the output of linux_lsof. For example, if we run linux_lsof for rules_for_emplo and all the processes it spawns and redirect the output to a text file, we will see the following:

Figure 9.37 – Volatility linux_lsof output
Here, we see descriptors for the following resources:
- /dev/null is a special file, which is a so-called empty device. Writing to it is successful, regardless of the amount of information, and reading is equivalent to reading the end of the file.
- /dev/ptmx is a character file used to create a pseudo-terminal master and slave pair.
- /dev/pts is a special directory that is created dynamically by the Linux kernel. The entries in /dev/pts correspond to pseudo-terminals (pseudo-TTYs or PTYs).
- /dev/tty stands for the controlling terminal for the current process.
As you can see, in general, the initial malicious activity detection and analysis process on Linux-based systems is not very different from that on Windows. We concentrate on looking for suspicious connections, processes with weird names, atypical child processes or behavior, and afterward, we untwist the chain based on our findings. However, there are some peculiarities. For example, rootkits were previously often used in attacks against Linux.
Historically, the term rootkit was used to refer to loadable kernel modules, which threat actors install immediately after gaining root privileges. A rootkit allows them to gain persistence in a compromised system and hide activities by hiding files, processes, and the presence of the rootkit in the system itself. Despite the fact that rootkits are now almost non-existent, we believe it is necessary to discuss the main analysis techniques that can help you detect the manipulation of kernel objects and their associated interfaces.
Examining kernel objects
To begin with, rootkits are loaded kernel modules. Accordingly, we need methods to detect loaded modules. For this case, Volatility has a couple of nice plugins: linux_lsmod, which enumerates kernel modules, and linux_hidden_modules, which carves memory to find hidden kernel modules.
The first plugin enumerates kernel modules by walking the global list stored within the modules variable. The output looks as follows:

Figure 9.38 – List of loaded kernel modules
Here, we can see the names of the loaded modules and their size. Note that if you used tools that require the kernel module to be loaded when dumping, the loaded module will also be on this list. For example, in our case, in the first line, you can see the lime module.
The linux_hidden_modules plugin scans memory for instances of a module structure and then compares the results with the list of modules reported by linux_lsmod. It looks like this:

Figure 9.39 – List of hidden kernel modules
As we can see, there are two hidden modules in our case. In order to analyze them, we can try to extract them with the Volatility linux_moddump plugin. To do this, we have to use the -b option to set the base address and the -D option to set the directory to save the result. For example, if we want to try to extract the RG24XR24AR24 module, we will need to run the following command:
$ vol.py --plugins=profiles -f /mnt/hgfs/flash/it-sec.lime --profile=Linuxubuntu_it-secx64 linux_moddump -b 0xffffffffc0521970 -D /mnt/hgfs/flash/
Of course, rootkits will not always try to hide their module; instead, they may use masquerading and try to look like legitimate modules. In this case, to find the rootkit, it is possible to extract all modules found with linux_lsmod and compare them with their legitimate counterparts.
Another important point is that rootkits often use hooking to perform their activities.
Important Note
Hooking is the process of modifying or augmenting the behavior of the operating system, applications, or other software components by intercepting function calls, messages, or events passed between those components.
There are many hooking techniques, but the most common are IDT and syscall hooks.
Important Note
An Interrupt Descriptor Table (IDT) stores pointers to interrupt service routines. When an interrupt occurs, the processor stops its activity and calls the interrupt service routine, which handles the interrupt. Such interrupts can be triggered by button presses, mouse movements, or other events.
Syscalls or system calls are calls from an application program to the operating system kernel to perform some operation. The Linux kernel header file has a syscall function that allows such calls to be made directly, and the Linux system call table itself is part of that operating system's API.
Volatility provides the linux_check_idt and linux_check_syscall plugins to detect IDT and syscall hooks.
Running the first plugin is as follows:

Figure 9.40 – IDT hooks
In our case, no IDT hooks were detected because we would have seen the word HOOKED in the output.
The second plugin runs the same way:
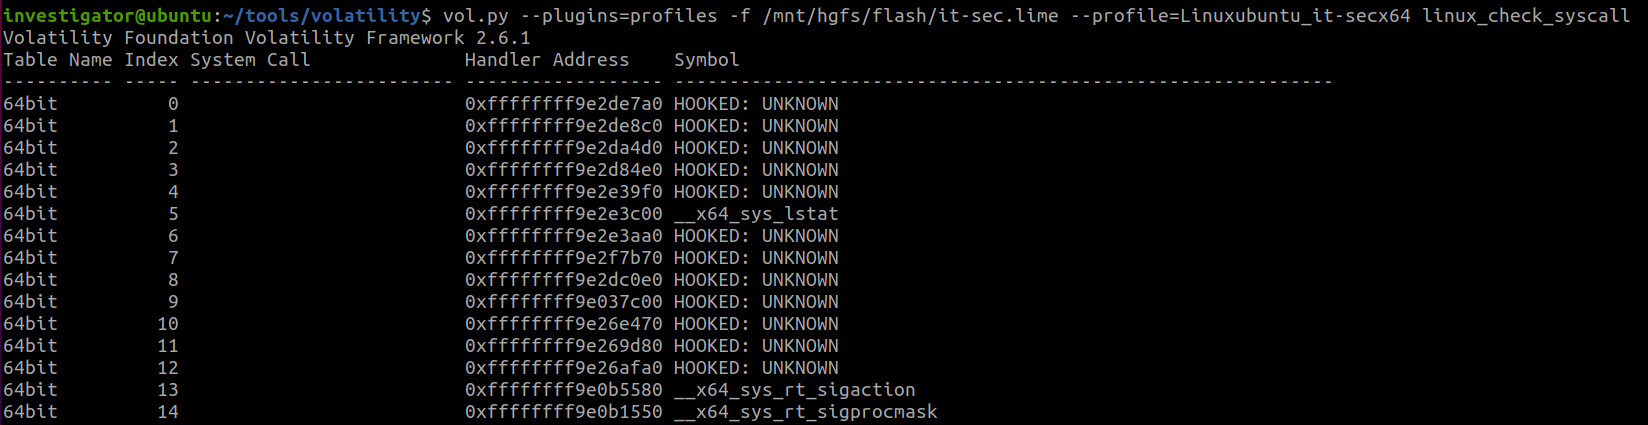
Figure 9.41 – Syscall hooks
Here, the situation is more interesting. We see a lot of system call hooks, but unfortunately, there is no additional information about these hooks, so we will have to analyze them manually.
Among other things, Volatility provides a few more plugins for analyzing other types of hooks:
- linux_apihooks – Checks for userland apihooks
- linux_check_evt_arm – Checks the exception vector table to look for syscall table hooking
- linux_check_inline_kernel – Checks for inline kernel hooks
- linux_check_tty – Checks the tty devices for hooks
In some situations, rootkits can also interact with different files. Volatility allows us to find files that are opened from within the kernel with the linux_kernel_opened_files plugin and to check file operation structures for rootkit modifications with the linux_check_fop plugin.
This is how we can do an initial examination of kernel objects and search for rootkits. But again, at the time of writing this book, rootkits are almost obsolete. They have been replaced by the use of post-exploitation frameworks and dedicated malware.
Summary
The techniques used to detect and analyze malicious activity on Linux-based systems are similar to those used on Windows operating systems. We concentrate on the investigation of active network connections and various anomalies in the processes and their behavior. However, analysis of such activity often comes down to examining network traffic dumps, which can also be extracted from memory; investigating the memory of individual processes; or examining the filesystem in memory. In most cases, it is these three elements that allow us to find the necessary evidence and reconstruct the actions of the threat actors.
Undoubtedly, knowledge of the filesystem structure, the location, and the contents of the major files play an important role in the investigation of Linux-based systems. Thus, knowing what software is being used on the system under investigation, and knowing where its logs and configuration files are stored, will allow you to easily find the information you need and fill in the missing details of the incident.
This concludes our examination of Linux-based systems memory. Our last stop on this difficult but fascinating journey will be devoted to macOS. We will discuss the process of obtaining memory dumps from macOS and actually investigating them. So, we cannot wait to see you in the next part.