
Chapter 8: User Activity Reconstruction
During forensic investigations and incident responses, reconstructing user activity is an essential part of collecting important data from the hosts of both victims and attackers. Linux-based systems have an important role to play here as they are often used by attackers to carry out their activities. This is because many different network and vulnerability scanners, web application security testing tools, and post-exploitation frameworks are implemented under Linux. Thus, investigating the host used by the attackers reveals to us detailed information about the tools and techniques used in the attack. Furthermore, by examining user activity, we can learn more about the stages of preparation for the attack, possible affiliates, activity on different forums, and more.
Based on the preceding lines, we must consider the following topics:
- Investigating launched programs
- Analyzing Bash history
- Searching for recent files
- Recovering filesystem from memory
- Checking browsing history
- Investigating communication applications
- Looking for mounted devices
- Detecting crypto containers
Technical requirements
This time, we will use both Linux and Windows systems to work with the tools described in the next two chapters and to carry out Linux memory forensics. In our case, Volatility 2.6.1 together with some built-in utilities will run on Ubuntu 21.04 (Hirsute Hippo) and programs such as Bulk Extractor or PhotoRec will run on Windows.
Investigating launched programs
In the previous chapter, we already discussed the process of profile creation for Linux-based systems, so now we'll restrict ourselves to checking which profiles you have available.
Let's assume that you have created a profile and placed it in the profiles folder. Don't forget that you need to pass the path to this folder using the --plugins option. To check that your profiles are available for use you can run --info. In order to get only the necessary output, we use grep, a command-line utility that allows us to find lines that match a given regular expression in the input and print them out:

Figure 8.1 – Linux profiles in Volatility
As you can see, we have several Ubuntu profiles at our disposal, as well as a Debian profile. Similarly, we can see a list of all plugins available for use with these profiles:

Figure 8.2 – Linux plugins in Volatility
Now that we have ensured that we have everything we need, we can start analyzing. As in the case of Windows, we will start by investigating the active processes, which will tell us what programs the user is running.
Volatility has a pslist and pstree equivalent for Linux-based systems. These plugins also work with the list of active processes and allow us to view this information. Let's use the linux_pslist plugin:

Figure 8.3 – List of active processes
The output of this plugin will be quite lengthy. This is because Linux systems use the same kernel structure to store information about processes as they do for kernel threads. Therefore, the output of this plugin will contain both processes and kernel threads. The latter can be identified by the absence of DTB.
Important Note
DTB is the physical offset of the process directory table base used to read from the process address space. Since kernel threads use the kernel address space, they do not have a DTB.
Note that there is also a Uid column that corresponds to the user ID. Using this column, you can filter the information for a particular user. Let's look at the processes that were started by the 1000 user ID. To do this, we will simply use the grep utility:

Figure 8.4 – Processes started by a specific user
We can now see that all rows with a value of 1000 in the Uid column belong to the same user. We can take a closer look at this output:

Figure 8.5 – User processes
Here, we already see some familiar names. For example, we can infer that the user with the 1000 ID had a terminal open, nano, Thunderbird, LibreOffice, and so on. It would also be nice to have a bit more information about the user.
Usually, user information can be found in the /etc/passwd file, but if we only have a memory dump at our disposal, getting access to this file can be problematic. However, we may be able to see information about the environment in which the processes in question were started. To do this, we can use the linux_psenv plugin. Let's run this plugin and specify one of the bash processes with the 23639 identifier:
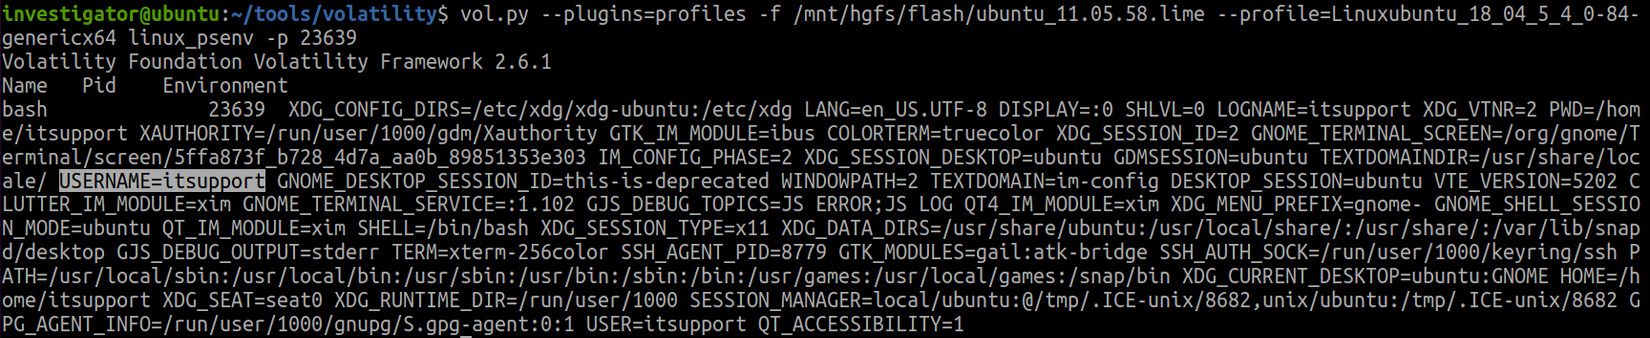
Figure 8.6 – Process environment variables
Note that the username is among the environment variables of this process. We now know that the programs we detected were started by the itsupport user.
But let's go back to the running processes. Apart from the standard pslist and pstree plugins, we have another interesting plugin at our disposal, which allows us to view not only the names of the running programs but also their locations and the arguments passed to them at startup. This plugin is called linux_psaux. Let's check it:
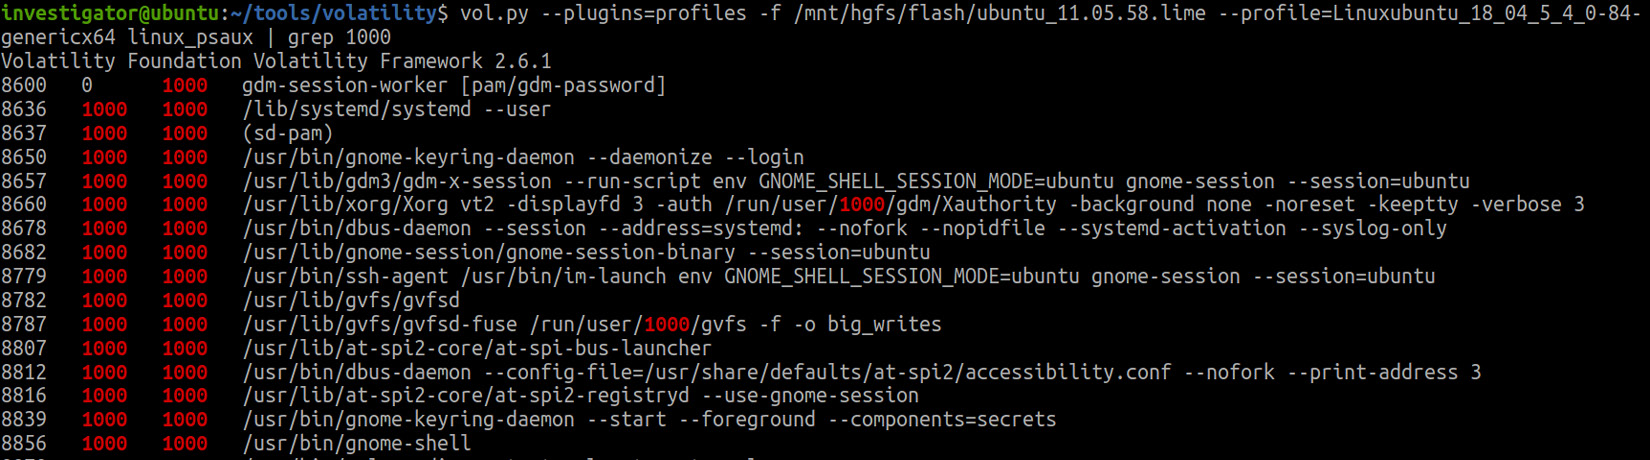
Figure 8.7 – Volatility linux_psaux
As you can see, we have once again used grep to get information about the processes associated with a particular user. We now have all the data about the location of the running programs and the arguments passed to them. Why might this be useful? Let's look at the following figure:

Figure 8.8 – File names in command lines
Here we can see not only the programs that the user has run but also the files opened with them. For example, we now know that the user was not just running Libre Office, but was running calc, an Excel analogue for Linux, and had clients.xls open with it. We can also see that nano was used to work with the passwords.txt text file, located on the desktop.
Important Note
Since linux_psaux shows the arguments at startup, you may not be able to get all the information about the files opened by a program from here. You can use another method to retrieve this information, which will be discussed later.
You have probably noticed that our user actively uses not only GUI programs, but also works with the terminal. This is a common story for users of Linux systems, so analysis of the executed commands becomes an integral part of user activity investigation.
Analyzing Bash history
The most commonly used shell on Linux systems is Bash, one of the most popular Unix shells. One of the reasons for this popularity is that it is preinstalled on the vast majority of Linux distributions. At the same time, it is quite functional, as it allows you to interactively execute many commands and scripts, work with the filesystem, redirect the input and output of commands, and much more.
Typically, if Bash history logging is enabled, it is stored in the user's home directory, in the .bash_history file. Naturally, attackers may perform various manipulations on both this file and the history-logging process in order to hide their traces. Nevertheless, we can try to recover this information from memory. Volatility has a specific plugin for this, linux_bash. Running this plugin looks like this:

Figure 8.9 – Bash history
As you can see, in our case, the user first tried to output the contents of the passwords file with cat, then opened it with nano, but apparently the file was not on the desktop, so the user created it with the touch command. Then, there was a network check, using ping and installing Git via apt. Obviously, with a threat actor working on the host, a Bash history analysis is of special value. Let's look at the following example:
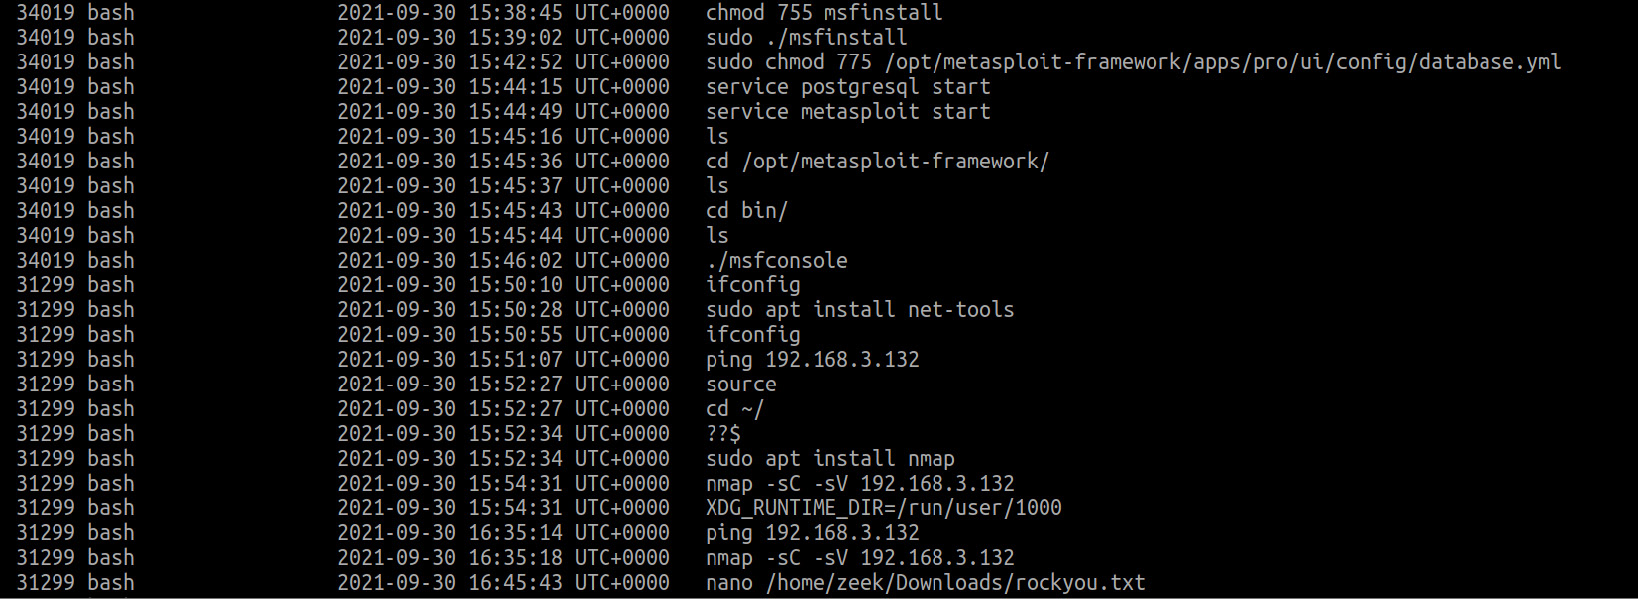
Figure 8.10 – Bash history on the attacker's host
Here, on the attacker's host, we see the post-exploitation framework, Metasploit, installed and running, as well as the network scanning tool Nmap. We also see the rockyou.txt file and can assume that this is one of the popular password dictionaries used for brute-forcing.
Thus, examining the Bash history on the attacker's host can reveal to us information about the tools used and the techniques applied, while Bash on the victim's host will tell us not only the tools used in the attack but also the individual files or systems the attacker was interested in.
Note that this is not the first time we have encountered the opening of certain files. Let's take a closer look at how to obtain information about the files a user was working with.
Searching for opened documents
Unfortunately, Linux-based systems do not have the same level of information logging as Windows. Nevertheless, it is still possible to find information about a particular file or even try to recover its content from memory. But first things first.
You already know that the files opened at the start of a program can be seen with the linux_psaux or linux_bash plugins. If you are interested in the files opened while a program is running, you can use the linux_lsof plugin by passing it the ID of the process you are interested in via the -p option. Let's try to find information about xls files opened by the soffice.bin process of the itupport user. To search for files of a certain type, we will use grep:

Figure 8.11 – Files opened in LibreOffice
The output shows that, in our case, LibreOffice connected to only one file, cliens.xls. It would be nice to know the contents of this file as well. Volatility provides a mechanism to find out which files have recently been used and export them. The fact is that Linux-based systems cache file data that is read from and written to disk. Volatility allows you to list and recover such files using the linux_find_file plugin. Let's start by listing the files cached in memory. To do this, the -L option should be used. As the list is quite long, we recommend saving it to a file, as shown in Figure 8.12:
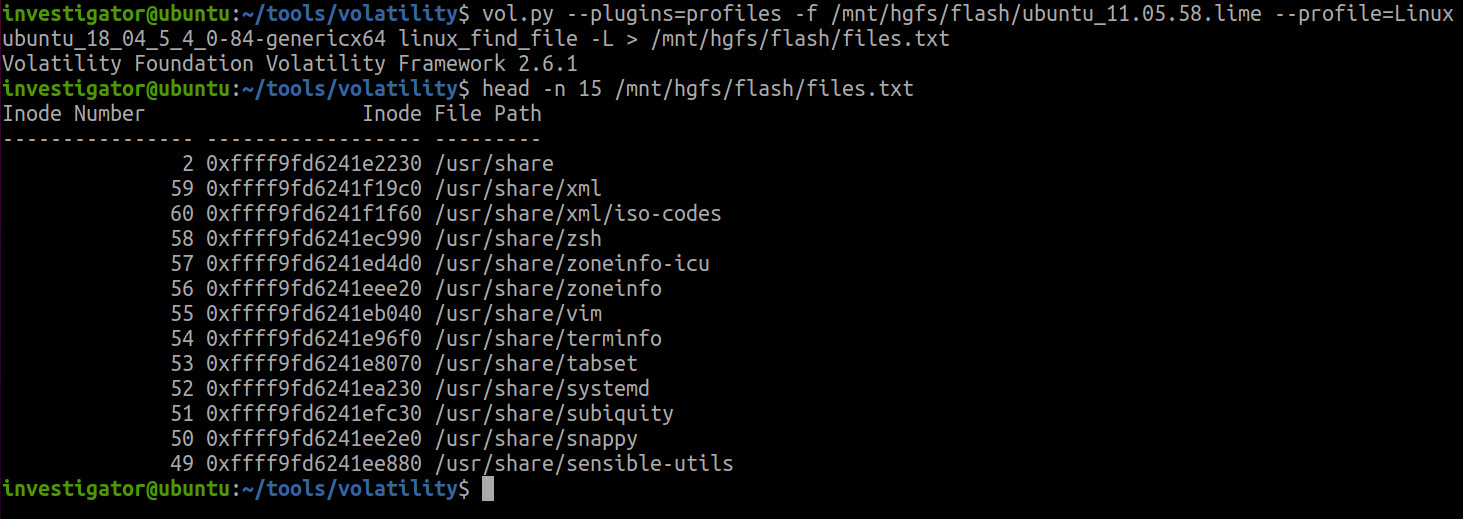
Figure 8.12 – List of cached files
From the output, you can see that here you can find information about the directories and files used, as well as their inode number and address.
Important Note
An inode or index descriptor is a data structure that stores metadata about standard files, directories, or other filesystem objects, apart from the data and name itself.
Alternatively, if you want to quickly check for a file in memory, you can use the -F option, followed by the name or location of the file you are looking for. If the file is found, you will see its location and inode information.
Using this information, we can try to extract any file found. To do this, we can use option -i, after which we should specify the desired inode. Here, we should also use the -O option to specify the path to the output file. The file search and extraction will look like this:

Figure 8.13 – File extraction
As you can see, we first found the file of interest and then used its inode to extract the data file to disk. But this is not all the possibilities that inode gives us. Let's get to the bottom of it.
Recovering the filesystem
In addition to retrieving individual files, Volatility provides the ability to recover a portion of the filesystem that was in memory at the time the dump was created. This is made possible precisely because of the large number of metadata stored in the inode. Filesystem recovery can be done using the linux_recover_filesystem plugin:
$ vol.py --plugins=profiles -f /mnt/hgfs/flash/ubuntu_11.05.58.lime
--profile=Linuxubuntu_18_04_5_4_0-84-genericx64 linux_recover_filesystem -D /mnt/hgfs/flash/recover_fs/
Note that here we add the -D option, specifying the directory where we want to save the filesystem to be recovered. In our case, it will be saved in the recover_fs folder. The result of the plugin will look like this:

Figure 8.14 – Recovered FS
Here, you can see the standard directories that have been recovered and also a swapfile, which is the Linux equivalent of Windows' pagefile. You can analyze this file in a similar way, using tools such as strings or Bulk Extractor.
In general, the filesystems used in Linux distributions have a similar hierarchy. The root directory is /, followed by the /bin/, /boot/, and /etc/ standard directories, and others:

Figure 8.15 – Linux directory hierarchy
The fact is that most Linux distributions follow the general rules described by the Filesystem Hierarchy Standard.
Important Note
The Filesystem Hierarchy Standard (FHS) is maintained by the Linux Foundation. It defines the directory structure and directory contents in Linux distributions.
Therefore, each directory has its own purpose and stores specific content. The following is a list of the key directories:

Figure 8.16 – Standard directories
Thus, using the recovered filesystem, you can try to find user files of interest or work with system files such as ~/.bash_history and /etc/passwd, or system logs. The following are a few files you might be interested in while conducting a forensic investigation or responding to an incident:
- /etc/os-release – information about the operating system
- /etc/passwd – information about users, their uid, guid, home directory, and login shell
- /etc/group – information about groups and their members
- /etc/sudoers – information about privilege separation
- /var/log/syslog – messages from different programs and services, including the kernel mode, excluding authentication messages
- /var/log/auth.log – authentication messages
- /var/log/error.log – error messages
- /var/log/dmesg – general messages about operating system events
- /home/<user>/.bash_history – bash history
- Application log files
Examining the previous files can help you learn more about the users, launched programs, executed commands, and so on.
Important Note
When extracting a filesystem from memory, Volatility tries to retain existing file timestamps. However, filesystems prior to ext4 do not store file creation information. Therefore, the linux_recover_filesystem plugin does not replicate these timestamps.
Volatility also allows tmpfs to be extracted. The linux_tmpfs plugin can be used for this purpose:

Figure 8.17 – Linux tmpfs information
Running it with the -L option will list all superblocks available for extraction, and with the -S and -D options, you can save them to disk.
Important Note
Tmpfs is a temporary file storage facility in many Unix-like operating systems that resides in RAM. In Linux, tmpfs has been supported since version 2.4. It is used to store directories containing temporary data that is deleted upon system reboot: /var/lock, /var/run, /tmp, and so on. Tmpfs can also host directories that store data between reboots, such as /var/tmp, or cache directories for specific programs, such as browsers.
Another way to recover files from memory is to use the already familiar PhotoRec tool. Let's take a look at how to do this. First of all, you need to run PhotoRec via PowerShell using a command:
PS D:> . estdisk-7.2-WIPphotorec_win.exe .ubuntu_11.05.58.lime
Next, confirm that we want to work with the specified file:

Figure 8.18 – Input file confirmation
In the next window, select the desired partition and press Enter:
Figure 8.19 – Partition selection
Since Linux-based systems typically use ext as the filesystem, we need to specify this type for correct file carving:

Figure 8.20 – Filesystem selection
In the next window, select the directory in which you want to save the recovered files. In our case, this is the photorec output directory:

Figure 8.21 – Output directory
In the last window, press Shift + C to start the recovery process:
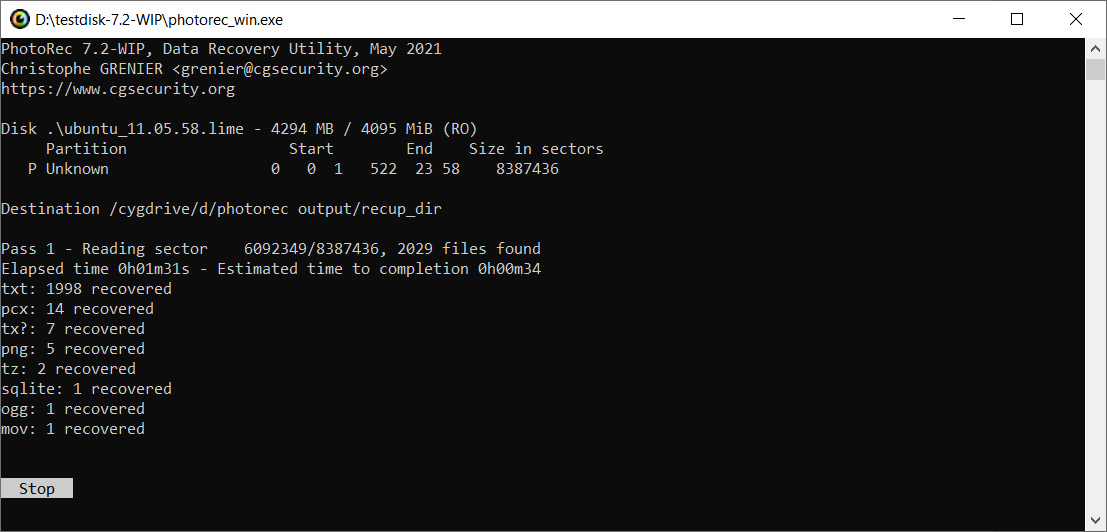
Figure 8.22 – Recovery process
When the process is complete, you will see the total number of files recovered and be able to locate the files themselves in the directory you specified earlier:

Figure 8.23 – PhotoRec recovery results
Here, you can search for files with the extensions you are interested in and analyze them.
If this method doesn't give you the results you want either, you can search for content in the memory of the process itself. This is what we will discuss in the next part, using browser history investigation as an example.
Checking browsing history
On Linux-based systems, as on Windows, most popular browsers store their data in SQLite databases. For example, Firefox stores its history in the places.sqlite file located in /home/user/.mozilla/firefox/*.default-release, and Chrome stores its history in the history file from /home/user/.config/google-chrome/Default. If you've managed to retrieve these files from memory during the filesystem recovery process, that's fine. But of course, this will not always be the case. If you do not have the standard history files at your disposal, you will have to search for information about the visited resources in process memory. In some ways, this approach is even more versatile in that it allows you to obtain data on the visited websites regardless of the browser and history storage formats that are used.
The process of accessing an individual process's memory will not be as straightforward as it is in Windows. To give you an example, let's take another look at the list of processes running on our host:
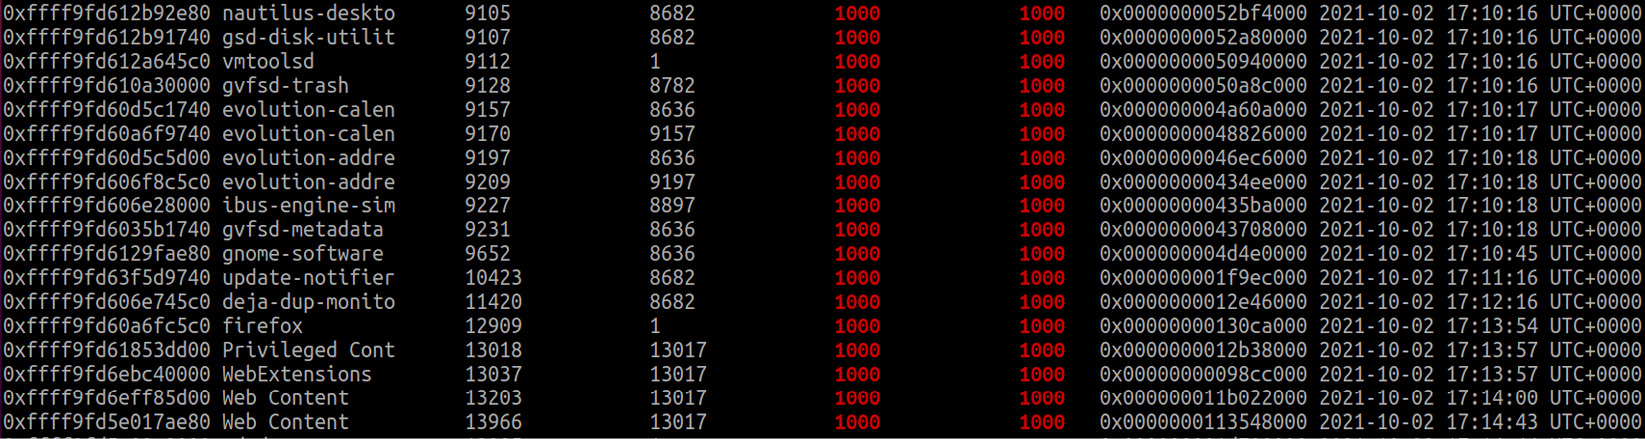
Figure 8.24 – Firefox in the list of active processes
Here is the Firefox process with the 12909 ID. Prior to Kernel version 3.6, information about sites visited via browsers could be retrieved using the linux_route_cache plugin, but in newer versions, routing cache was disabled, so we will break down a more general method to find the information we are interested in. More specifically, we will try to look into the memory of our Firefox process.
Unlike Windows, we can't export the whole process memory. During the runtime loader maps all needed thigs such as executable file, shared libraries, stack, heap, and others into the different regions of process address space. We can extract these mappings using the linux_dump_map plugin:

Figure 8.25 – Firefox memory
As you can see, when using this plugin, each mapping is saved to a separate file. But we can still use tools such as strings to search for this or that information. To avoid handling each file individually, we can use the following simple script:
for file in <dir>
do
strings "$file" >> <output>
done
In our case, it will look like this:

Figure 8.26 – Script to run strings on multiple files
This will run strings for each file in /mnt/hgfs/flash/firefox and add the results to firefox_strings.txt:

Figure 8.27 – Strings output
Searching by regular expressions, it is easy to find our visited URLs and a user's search queries.
Another way to find such information is to use the already familiar Bulk Extractor. We will use Windows to run it, but first we will merge all the files into one so that Bulk Extractor can handle them. To do this, we will use a PowerShell script:
> Get-ChildItem -Path D:firefox -File -Recurse | ForEach-Object -Process {Get-Content -Path $_.FullName | Out-File -FilePath D:firefox-result.vma -Append}
This script takes the content of each file in the firefox directory and adds it to the firefox-result.vma shared file. When the shared file is received, we can start parsing. We use the usual options:
- -o – to specify the output folder
- -x – to disable all plugins
- -e – to enable the email scanner to search for the URL
The resulting startup looks like the one shown next:

Figure 8.28 – Bulk Extractor execution
When the parsing is finished, you can search for the results in the output folder. For example, from the url_histogram.txt file, we can pull out the links of interest:

Figure 8.29 – Parsing results
Note that even information from search engines such as DuckDuckGo, which is very focused on the anonymity and privacy of its users, is captured here thanks to memory analysis.
This type of analysis can be applied to any process. Specifically, you can use process memory analysis on applications related to communications to find the data you are interested in – conversations, publications, and so on. This is what we will talk about.
Investigating communication applications
In addition to various browsers, Linux-based desktop operating systems also support a large number of communication applications – messengers, mail agents, chat rooms, and so on. Naturally, the information these applications carry may be of interest to us, especially if they are hosted by an attacker.
As we mentioned before, analysis of such applications will not differ much from analysis of browsers, as we will be working with process memory. Let's take a look at an example. We have already seen that we have a Thunderbird application with the 51825 ID on the target host. Let's dump its memory, as we did before with Firefox:

Figure 8.30 – Thunderbird memory
We can now use the preceding script to get all the readable lines from the dumped files:
$ for file in /mnt/hgfs/flash/thunderbird/*; do strings "$file" >> /mnt/hgfs/flash/thunderbird_strings.txt; done
Once executed, we get one big text file. It can be explored manually, searched by keywords or regular expressions. Either way, you will be able to find, for example, different notifications from social networks and services, which will give you an idea of what accounts and services the user has, what he or she is interested in:

Figure 8.31 – Emails from social networks
And, of course, you can find parts of normal conversations, attachment names, sender addresses, and so on:
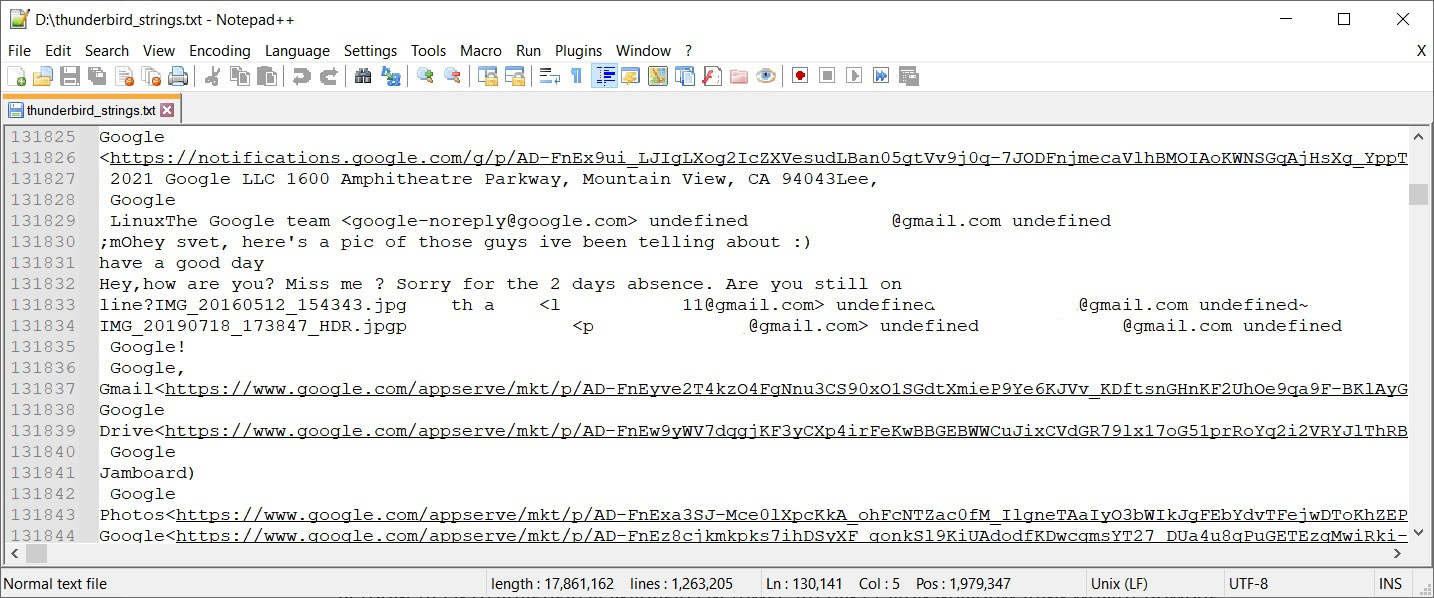
Figure 8.32 – Conversation parts
With this simple method, you can find out a lot of interesting things about the user. But now, let's move on. Our next topic of discussion is mounted devices.
Looking for mounted devices
On Linux operating systems, users have the ability to mount devices as well as specific filesystems. Analysis of such information can help us identify not only the individual devices and filesystems mounted to the host but also recover the relative timelines of their mounts.
The Volatility linux_mount plugin can be used to find information about attached devices and filesystems:

Figure 8.33 – Mounted filesystems
As you can see from the screenshot, this plugin displays information about all mounted devices and filesystems, including their location, mount point, type, and access rights. The attentive reader may have already noticed that we also talked about the timeline, but this information is missing here. So, what can we do?
In this case, the kernel debug buffer will help us. The kernel debug buffer contains information about the connected USB devices and their serial numbers, network activity in promiscuous mode, and a timeline of events. To access this buffer, we can use the Volatility linux_dmesg plugin. For convenience, the output of the plugin is redirected to a text file:
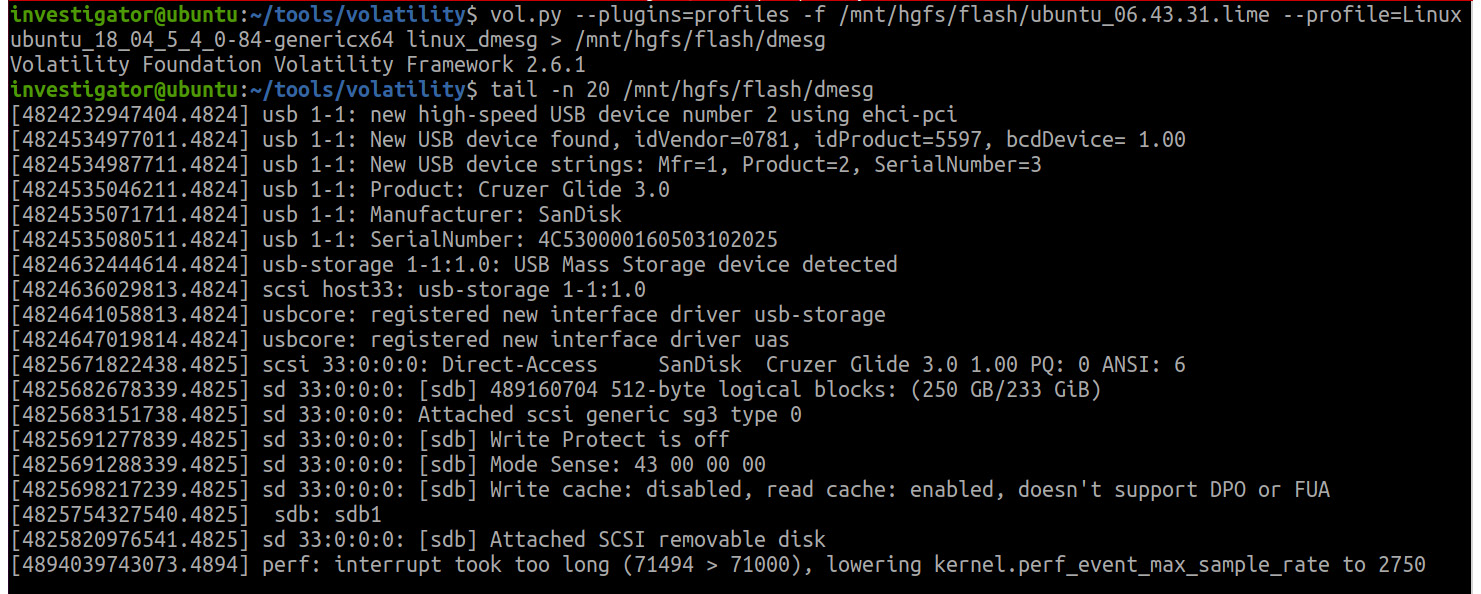
Figure 8.34 – Volatility linux_dmesg output
If you still want to try to calculate at least an approximate connection time, you can perform the following calculations:
- In Figure 8.34, you can see that the SanDisk Cruzer Glide 3.0 USB device was connected to the examined host. Here, you can see the details of its connection, such as the absence of write protection. The timestamps you see on the left are relative timestamps and can help you analyze the sequence of events, but there is a problem with interpreting these timestamps. These kernel timestamps are derived from an uptime value kept by individual CPUs. Over time, this gets out of sync with the real-time clock, so reliably reconstructing the time of an event from the memory dump is problematic.

Figure 8.35 – Systemd start time
- We see that the start time of the systemd process is 2021-10-02 17:05:54 UTC. We need to convert this time to seconds. Any epoch converter can do this for us. We will use the online converter at https://www.unixtimestamp.com:

Figure 8.36 – Start time conversion
- This results in a value of 1633442754 seconds. The value displayed in dmesg is in nanoseconds and must therefore be converted to seconds. The connection timestamp of our USB device is 4824232947404.4824 nanoseconds, which is rounded to 4824 seconds. This value is added to the Unix timestamp you calculated earlier. We get 1633447578 seconds.
- Our final step is to convert the resulting timestamp into a readable format. To do this, we can again use the converter:

Figure 8.37 – Unix timestamp conversion
Now, we know the approximate time of USB device connection – October 5th, 2021, 15:26:18.
Naturally, if we have access to a live host, the task of timing a particular event is easier. However, please keep in mind that after being written to disk, dmesg logs can be changed by attackers, and the events you are interested in may not be present at all. You can, however, use cross-checking to detect these manipulations.
To output the dmesg timestamps in a readable format, the -T option has been introduced in many Linux distributions. Its use is as follows. We run the dmesg -T command and get the exact time of the events logged by dmesg:

Figure 8.38 – Output of dmesg on a live host
The command output shows that the connection of the USB device in question was made on October 5, 2021 at 8:25:13 in the host's local time. The time zone in which the host is located is PDT, so the connection time is 15:25:13 UTC. As you can see, the timestamp we calculated has a relatively small deviation, so in the absence of access to a live host, the above method of calculating timestamps can be used.
The last thing we need to consider is the detection of crypto containers, so that is what we will move on to.
Detecting crypto containers
An important step in the investigation of user activity on Linux systems is to look for crypto containers, especially when it comes to investigating hosts used by potential threat actors. The fact is that, for their own safety, they can put important data related to the preparation for an attack, developed malicious tools, or stolen information into the crypto containers.
Linux-based systems have various encryption options ranging from dm-Crypt to the more standard TrueCrypt and VeraCrypt. In fact, the process of detecting crypto containers and recovering encryption keys is almost the same as in Windows. Therefore, we will only discuss the main points.
Firstly, you can still use analysis of running processes to detect encryption containers because if a crypto container was opened on the system, you will still find the corresponding process in the list.
Second, for the most popular TrueCrypt solution, Volatility has a separate plugin to recover the cached passphrase – linux_truecrypt_passphrase.
Third, you can always use the Bulk Extractor AES scanner to search for AES keys potentially used for encryption. This will look the same as in case of Windows:

Figure 8.39 – AES keys search with Bulk Extractor
The output is the same aes_keys file in which all AES keys extracted by Bulk Extractor can be found:

Figure 8.40 – AES keys found
Knowing the crypto container running on the system and using AES, and its key length, you can try to recover the master key from the available data.
Summary
User activity analysis plays an important role regardless of the operating system under investigation, as it can reconstruct the context in which the incident occurred and reveal important details about the actions taken by the user. On the other hand, Linux operating systems are often used by attackers, so investigating user activity on such systems takes on a special meaning.
Due to the way Linux systems are designed, investigating them is not as easy as it is with Windows. Nevertheless, we can obtain data about running programs, documents opened, devices connected, crypto containers used, and so on.
An important aid in analyzing user activity on Linux is the examination of process memory, which is done in several steps. Despite the relative difficulty of extracting mappings and their further processing, the process memory may contain valuable data – visited links, conversations, publications, email addresses, filenames, and so on.
Thus, we have covered the general methods of analyzing user activity. Now it is time to talk about something malicious. This is what we will talk about in the next chapter.