
Chapter 4: Reconstructing User Activity with Windows Memory Forensics
User activity reconstruction is essential for many use cases since it gives us a better understanding of what is going on. In the first chapter, we discussed that if you receive a device participating in the incident, the victim or suspect probably owned this device. If we analyze the victim's device, user activity can tell us how the infection occurred or how the attacker acted while remotely accessing the computer. If we are talking about the attacker's device, such analysis allows us to understand how the preparation for the attack took place, what actions the threat actor performed, and how to find evidence of illegitimate activity. Also, if you are dealing with criminal cases that are not related to hacking but more traditional crimes, such as child pornography, human trafficking, and drug dealing, memory images may contain key sources of evidence. Here, you may be able to recover private communications and browser history, as well as the encryption keys of the containers that were used by the suspect to hide the data.
This chapter will provide some insights into user action recovery techniques, based not only on running processes but also on analyzing Windows Registry and the filesystem in memory.
The following topics will be covered in this chapter:
- Analyzing launched applications
- Searching for opened documents
- Investigating browser history
- Examining communication applications
- Recovering user passwords
- Detecting crypto containers
- Extracting recent activity from the registry
Technical requirements
To work with the tools described in the next three chapters and conduct Windows memory forensics, you do not need to meet certain technical requirements. It is sufficient to have a Windows operating system installed on the main host or a virtual machine.
Analyzing launched applications
Applications analysis may help an investigator to build the suspect's profile. The analysis of running processes may help us to understand whether the suspect is using some messengers or web browsers with high anonymity levels or if any encrypted containers are currently mounted. Such data sources may be full of valuable forensic artifacts and, what's more, be unavailable during post-mortem analysis.
Each time the user starts a program, the corresponding process is created in memory and added to the list of active processes. By analyzing this list, we can get information about the programs running at the moment the dump is taken. That's what we'll do once we get to know our analysis tools.
Introducing Volatility
The Volatility framework is the most popular free tool for memory dump analysis. Many vendors have included support for this tool in their solutions, including Autopsy and Magnet AXIOM. The source code for this tool is written in Python, so Volatility can be used on different operating systems. Moreover, Volatility allows you to analyze various operating systems, ranging from Windows XP to Linux and macOS. Naturally, we also decided to take Volatility as a basis, but we will not limit ourselves to it either.
To run Volatility, you can use one of the following options:
- Volatility Standalone: This version is a separate executable file. The last version that was released in this format was Volatility 2.6. You can get it from the official site: https://www.volatilityfoundation.org/26. Just download the version that suits your operating system and copy the executable file to a convenient location.
- Python scripts: Using scripts has its advantages as they are updated more frequently and support a larger number of profiles. To get them, you can simply go to the Volatility GitHub repository and clone the project: https://github.com/volatilityfoundation/volatility.
- Volatility Workbench: This option is suitable for those who prefer to work with tools that have a graphical interface. The developers of the Workbench periodically update it, so this tool also supports the latest versions of Volatility, including Volatility 3. However, it also has disadvantages, such as incomplete support for all the parameters available in Volatility. You can download Workbench for free from the official website: https://www.osforensics.com/tools/volatility-workbench.html.
The Volatility project is actively supported, so you can always find detailed installation instructions, official plugin descriptions, plugins from the community, and more information from the appropriate public sources. This includes the official web page, Volatility's GitHub repository, and various forums.
At the time of writing, the latest version of Volatility is Volatility 3. However, this version is still under development, and some of the plugins we need are underdeveloped or missing altogether. In addition, the output processing in Volatility 3 is not as easy as in version 2.6, so we gave preference to the previous version of Volatility.
At the time of writing, the latest version of Volatility is Volatility 3. However, this version is still under development, and some of the plugins we need are underdeveloped or missing altogether. In addition, the output processing in Volatility 3 is not as easy as in version 2.6, so we gave preference to the previous version of Volatility.
We will take the easy route and choose the standalone version. If you are running Windows, then after downloading Volatility from the official website, you will get the volatility_2.6_win64_standalone.exe executable file. Volatility is a command-line tool, so you need Windows PowerShell or Windows Command Prompt to run it. To check that everything works correctly, you can open PowerShell, go to the folder that contains the tool (in our case, this is the D: drive), and run Volatility with the --info option. This option opens the help menu, as shown in the following screenshot:
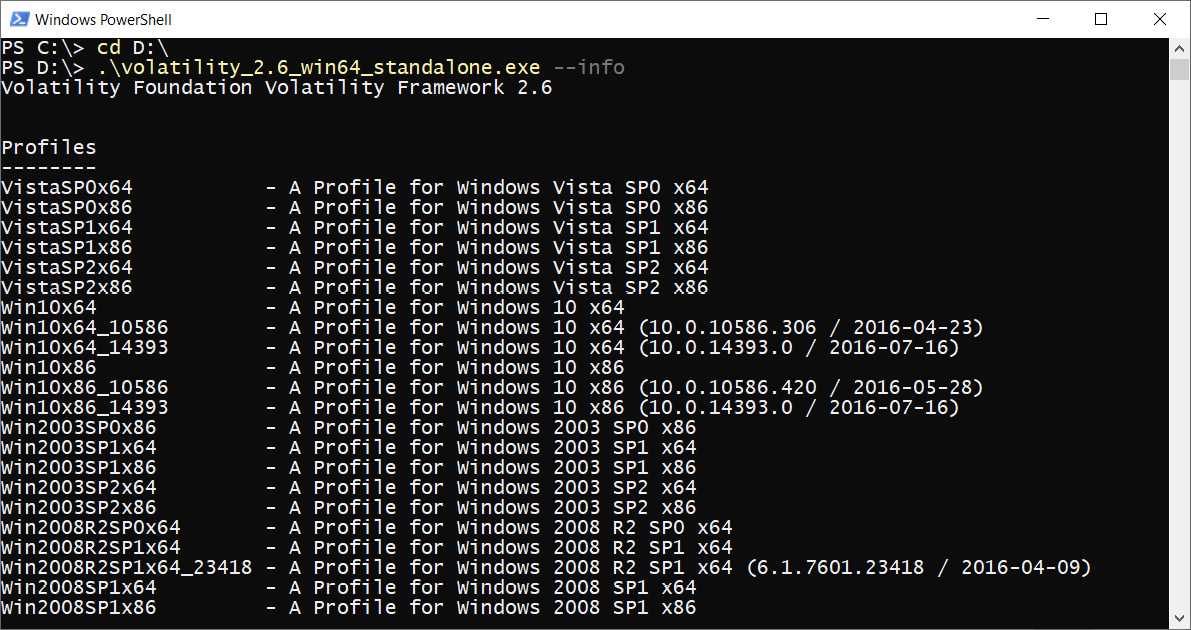
Figure 4.1 – Volatility information
Pay attention to the Profiles section since it lists all the versions of the operating systems supported by your version of Volatility. Without a correctly specified profile, the tool will not work as expected.
Profile identification
Each profile in the Profiles section corresponds to a specific version of the operating system. If you do not know which profile is needed to analyze your memory dump, you can always use the imageinfo plugin, which will try to find the most suitable profiles for you. To run this plugin, you will also need to use the -f option, after which you must specify the path to the memory dump you want to analyze. We used the memory dump named Win10Mem.vmem, located in the D:user activity folder. The whole command should look as follows:
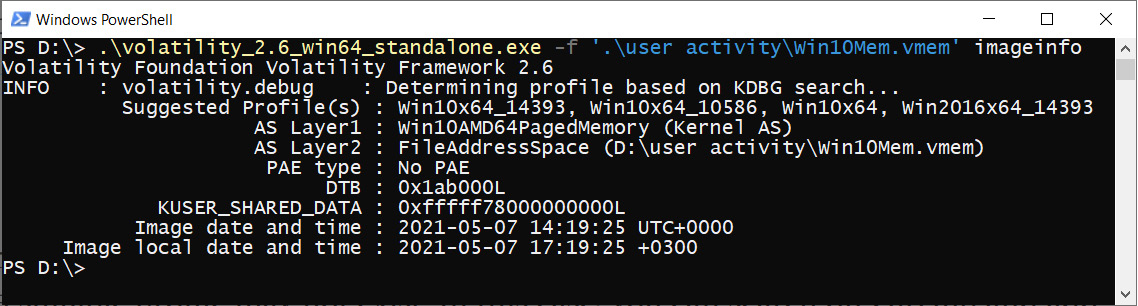
Figure 4.2 – Volatility imageinfo
If you run the command successfully, the Suggested profiles line will show a list of profiles that Volatility considers suitable for the analysis. In most cases, the first profile on the list will be the most suitable, but if you notice that some plugins do not work (which may be a lack of output, incorrect output, or an error message) with that profile, just try to change it.
Another important point is that if the operating system that the dump was taken from is quite new, a suitable profile may not exist. In this case, you can search on GitHub and add a new profile to Volatility, look at the next version of Volatility – in this case, Volatility 3 – or use another tool. Of course, if you cannot find a proper profile, you can write one yourself, but you will need a deeper knowledge of programming and operating systems to do so.
In our case, we will use the Win10x64_14393 profile for the Win10Mem.vmem dump.
At this point, we have a tool and a suitable profile. Now, we can analyze the list of active processes.
Searching for active processes
Volatility has several plugins for listing the processes running on the system at the time of dump creation. The first one, pslist, allows you to get a list sorted by time. If we are mostly interested not in creation time but the relationship between the parent and child processes, the better option is to use pstree. Both plugins work with a list of active processes in memory and display data that, on a live system, can be obtained with Task Manager.
The universal command for getting started with any of the plugins is as follows:
volatility_2.6_win64_standalone.exe -f <memory dump location> --profile <suitable profile from profile list> <plugin to run>
Let's try to get the list of active processes, sorted by time:
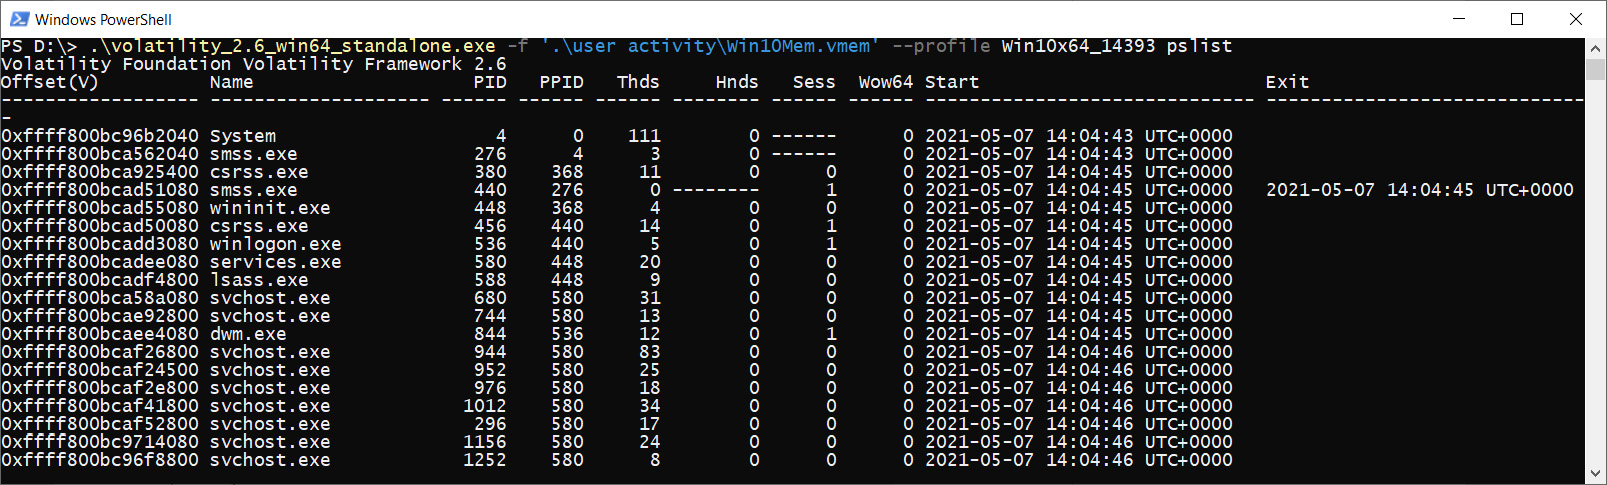
Figure 4.3 – Volatility pslist
Take a look at the preceding screenshot. In the output of the plugin, we can find not only the name of the running process but also its unique identifier, the identifier of its parent process, the number of associated handles and threads, the time the process was created, and, if the process was terminated, the time it was exited.
Important note
There are many different kernel objects. When a process needs to open a particular object, a reference, called handle, is opened for it. Since every active process must have at least one thread (an object that represents the smallest sequence of programmed instructions), there is always a handle for that type of object. In addition to that, handles are often created for objects such as files, registry keys, and even other processes.
However, what if the process was terminated recently and information about it has been removed from the list of active processes?
Searching for finished processes
From the operating system's point of view, all processes are objects of a certain _EPROCESS structure. When a process finishes its work, its data is still stored in memory for some time until the space occupied by the process is overwritten. Volatility allows you to search for such processes using a search for objects, similar in structure to _EPROCESS.
To find such processes, you can use the psscan plugin. Its execution will look as follows:
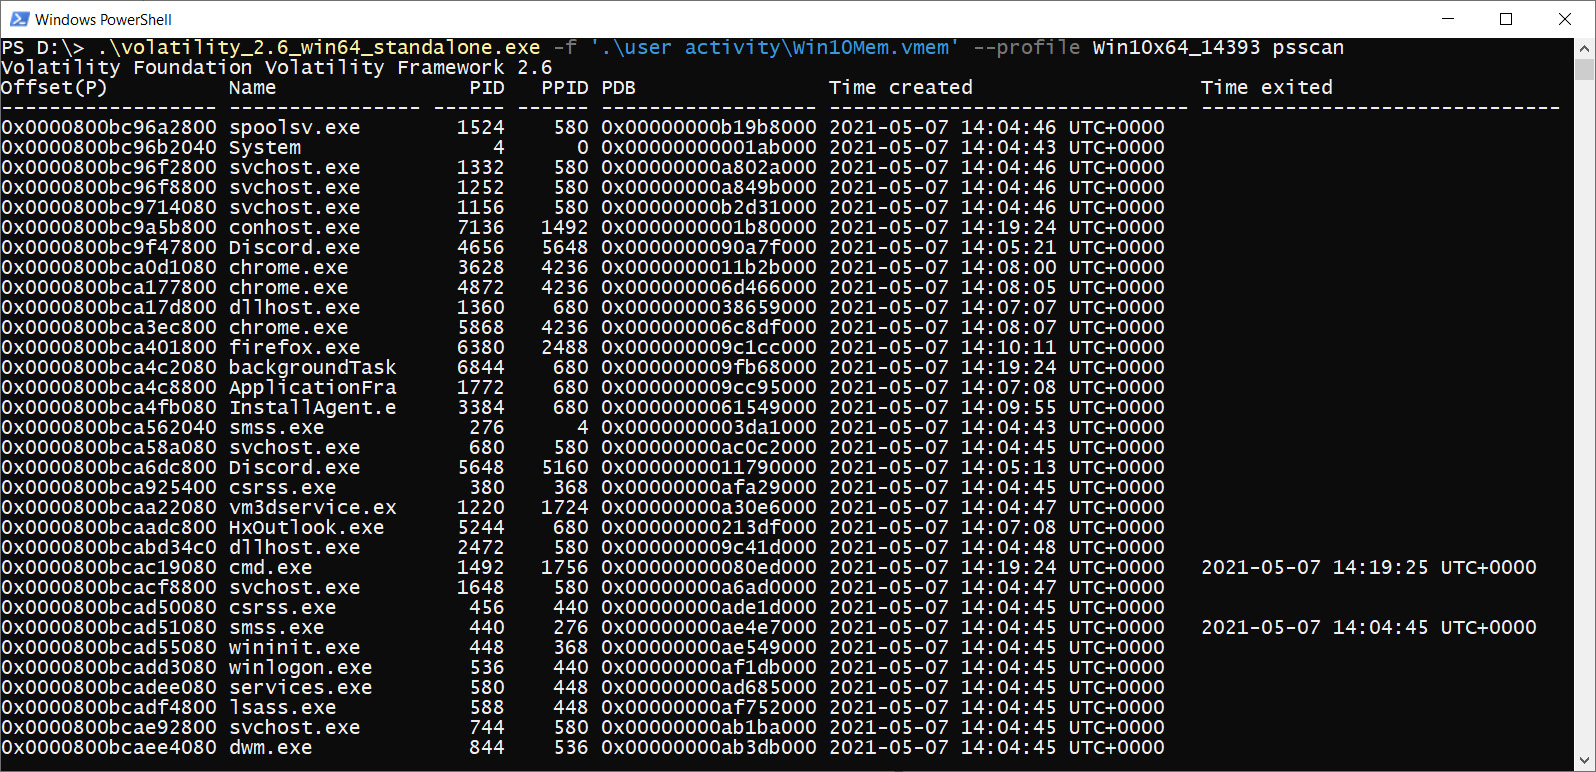
Figure 4.4 – Volatility psscan
As you can see, the information that's displayed is quite similar to the pslist result, but now, we have more information about the terminated processes.
Now, we can search for programs that were running by the user when the dump was created or were recently terminated. However, what if we need to look even further and search for programs that terminated earlier?
In this case, Volatility has a userassist plugin, which retrieves information about the programs that the user frequently runs. This can also include programs that the user has recently worked with.
We can obtain such data as the application name, run count, and last run time of the applications that were launched via Windows Explorer:

Figure 4.5 – Volatility userassist
First of all, after execution, you will be able to see information about specific locations where this information was found. For example, ??C:UsersBen tuser.dat means that the shown subkeys and values are related to the user Ben.
The following screenshot shows separate entries related to each application:

Figure 4.6 – Userassist entries
As you can see, userassist shows the full path to the executable, run count, time focused, and the date and time of the key update that is related to the last run time of the application. Here, you can find not only programs running at the moment of memory dump creation but also programs that were launched earlier.
Now, imagine that, in the list of running or recently completed processes, we have WINWORD.exe (such a process is created when you start MS Word):
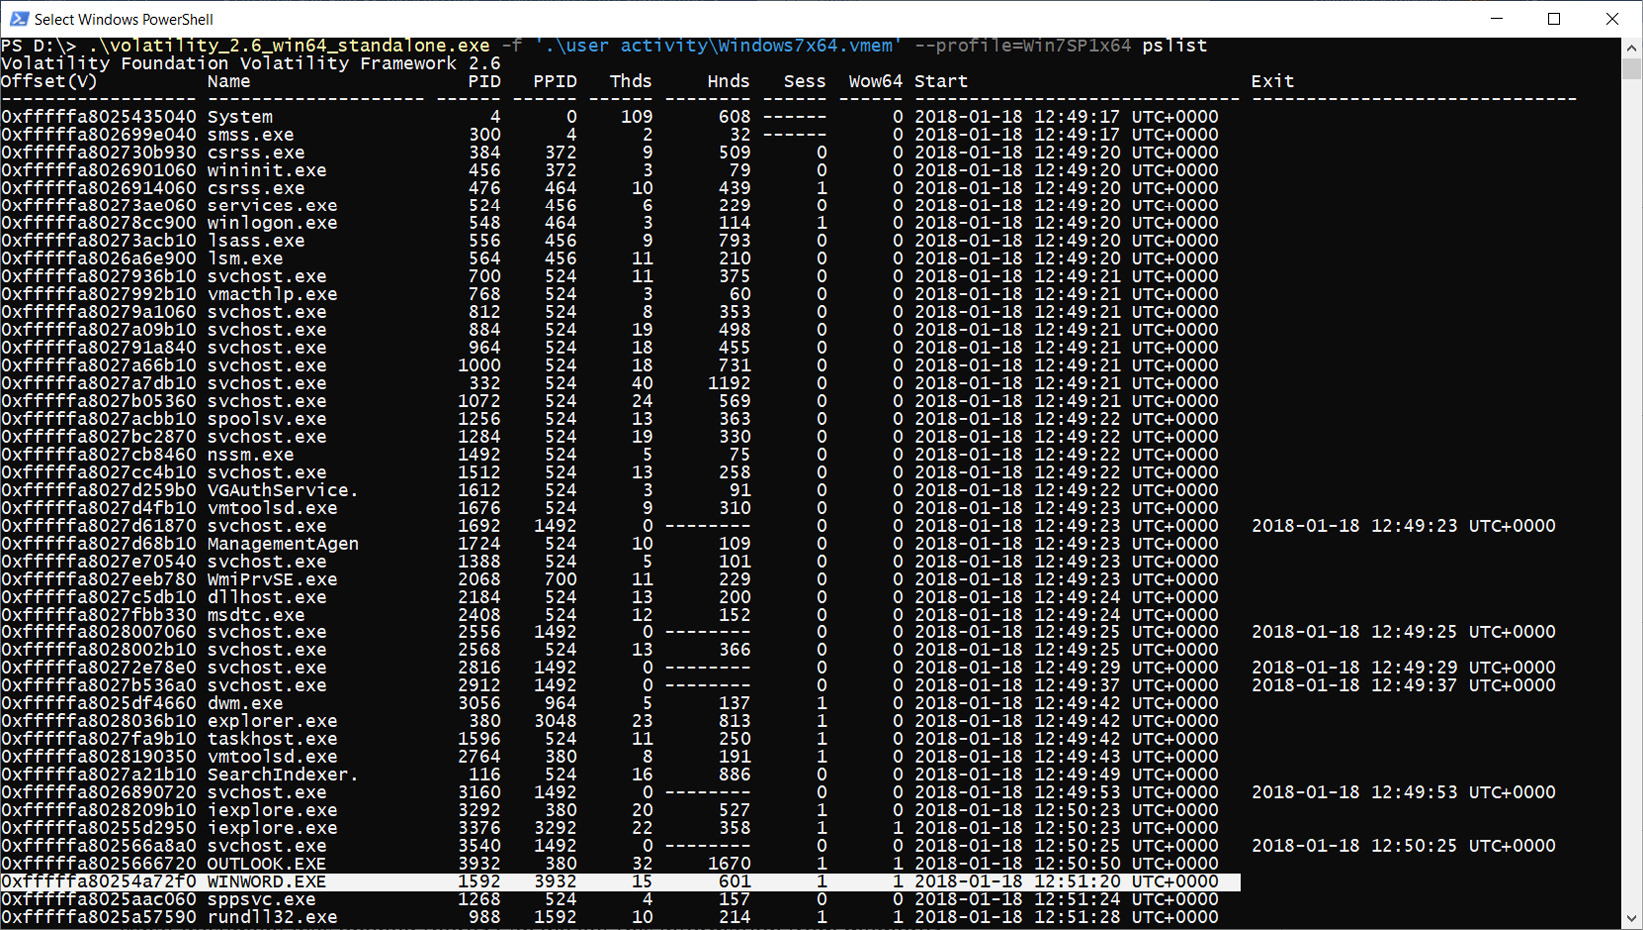
Figure 4.7 – Active MS Word process
What document was opened there? Can we get this information from memory?
Searching for opened documents
In some cases, you may want to understand if any Microsoft Office files or just text files were opened by corresponding applications. Why? They may contain passwords or some data that's valuable from an investigative perspective. Volatility has several plugins that allow you to work with files in memory. For example, the filescan plugin allows you to get information about all the files that were encountered in the memory dump, and dumpfiles allows you to try to extract these files (remember that some files may be unloaded at the time the dump is created). So, how do we find a file that's been opened in MS Word?
Documents in process memory
If we pay attention to the Process ID (PID) column, we will see that our WINWORD.exe process has an ID of 1592. We can use this ID with the -p option to run Volatility plugins only for this process. If we want to see what resources our process used, the handles plugin can help us. Let's use this with the -p option and the -t File option, which will help us display only those resources that are related to files.
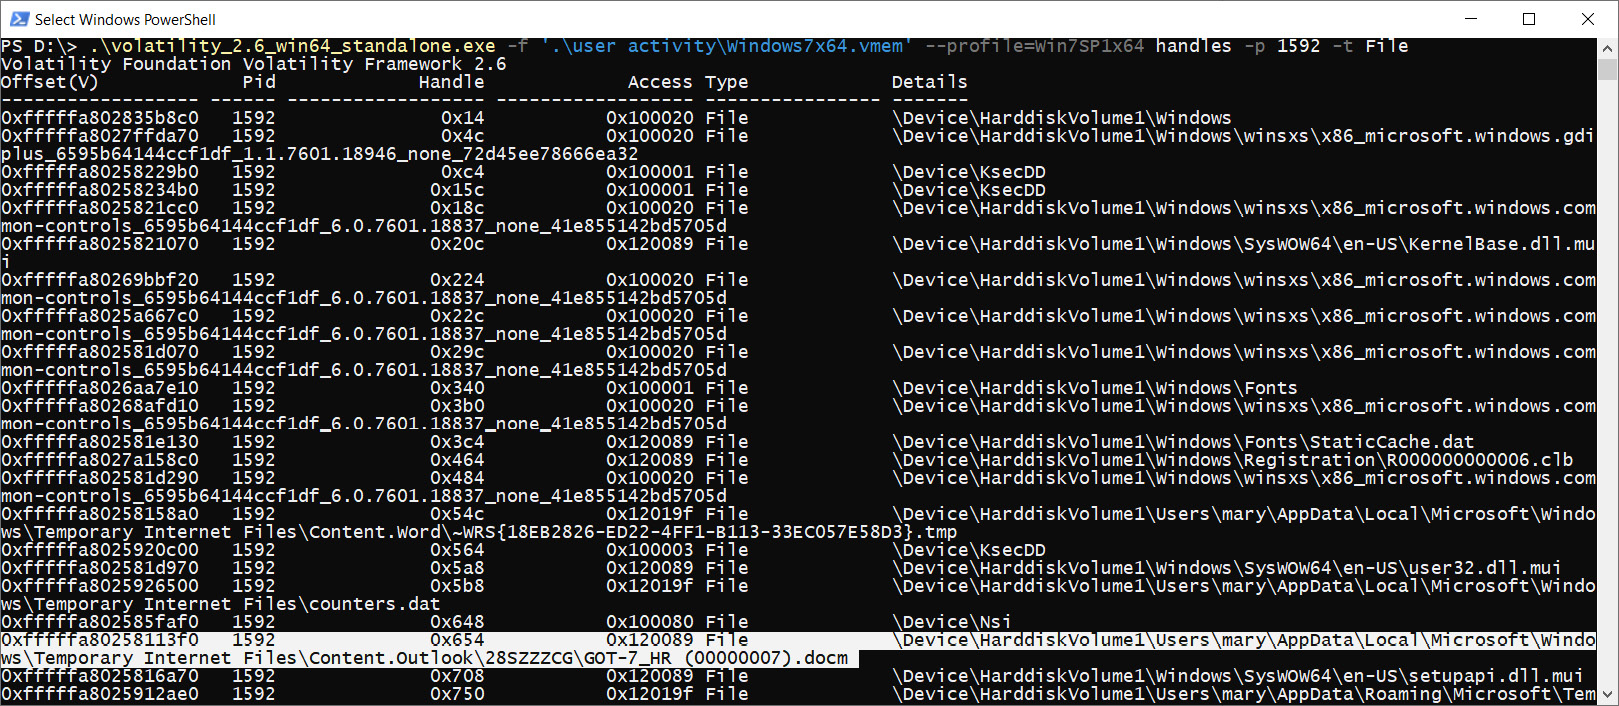
Figure 4.8 – Volatility handles
In the preceding screenshot, we can see that our process resources mention a file called GOT-7_HR. Let's find the location of this file in memory. To do that, we need to run the filescan plugin and redirect its output to a text file, as shown here:
PS D:> .volatility_2.6_win64_standalone.exe -f '.user activityWindows7x64.vmem' --profile Win7SP1x64 filescan > D:filescan.txt
When the plugin finishes running, we can find a text file called filescan.txt that contains the following contents on the specified path:
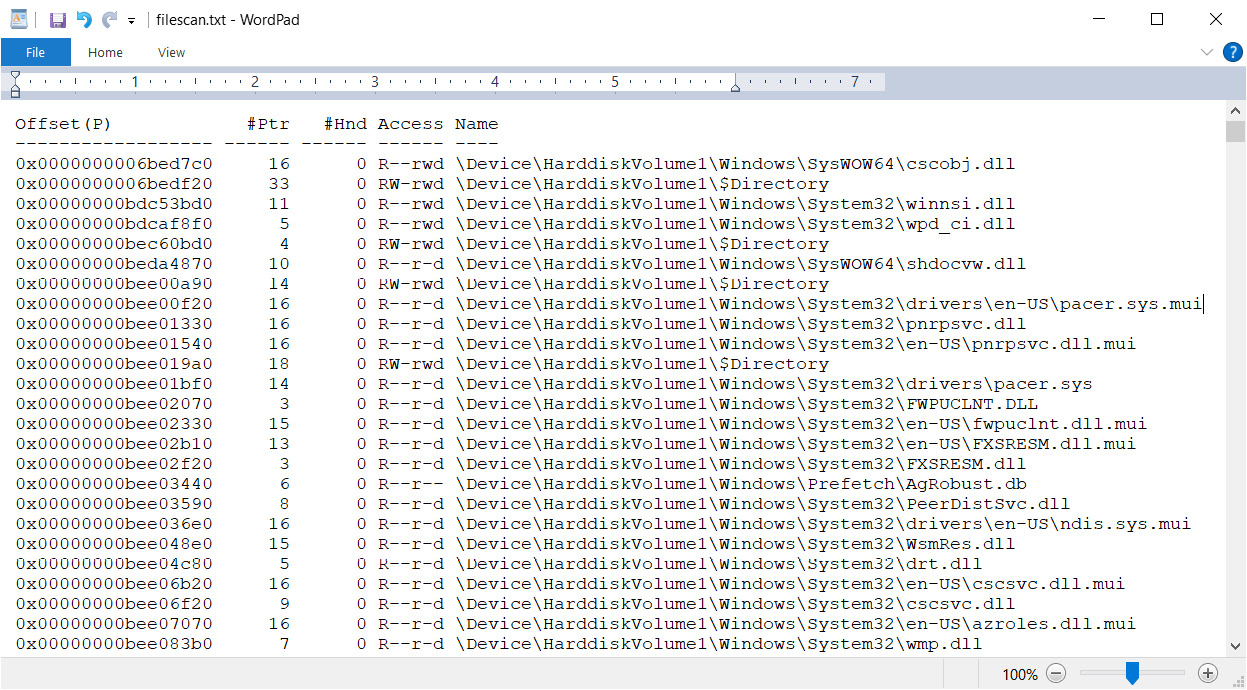
Figure 4.9 – Volatility filescan output
Here, we can see the physical offset where the file was found, some related attributes, and the full path to the file on disk. Let's find our file:
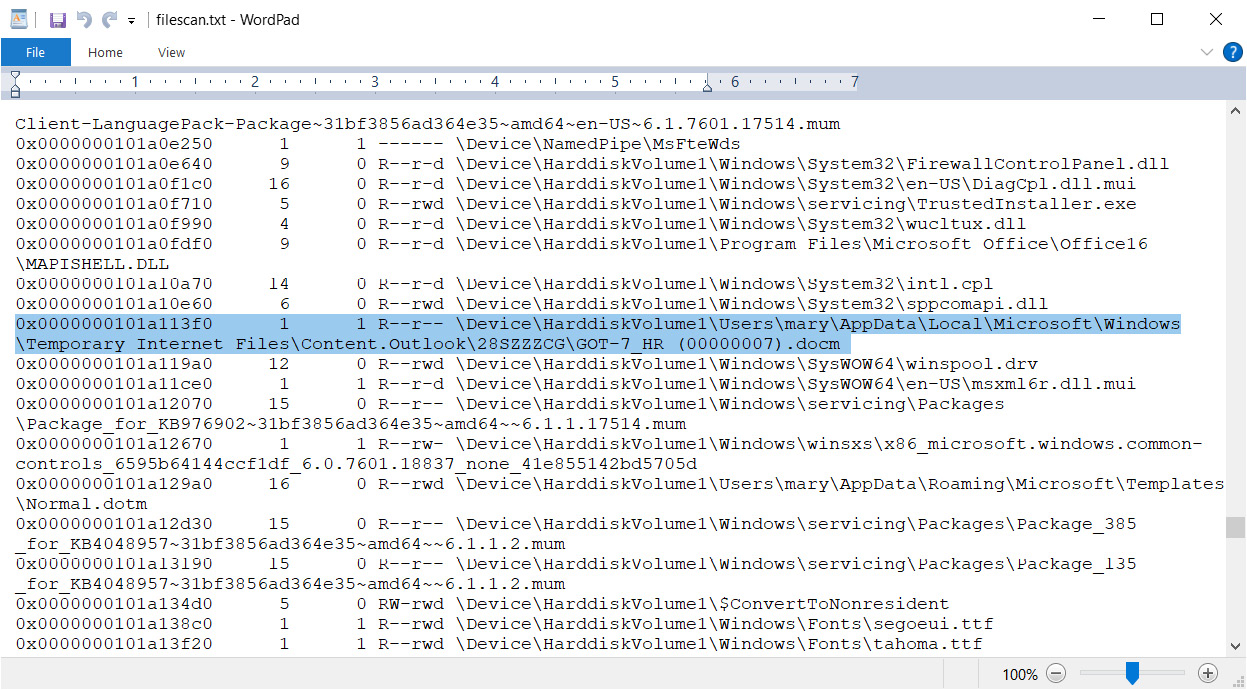
Figure 4.10 – File offset
We now know the physical offset of our file and can use the dumpfiles plugin to retrieve it from memory. Here, we will use the -Q option to specify the physical offset and the -D option for the path where we want to save our file.

Figure 4.11 – Volatility dumpfiles
As you can see, our file was detected at this offset. Now, there are two new files in our D:user activity folder called file.None.0xfffffa80282a6b80.vacb and file.None.0xfffffa80258625f0.dat.
File data extensions identify the object that the data was extracted from:
- dat: DataSectionObject
- vacb: ImageSectionObject
- img: SharedCacheMap
These files are containers where the file's content and data are stored. To get the original file, try to rename the container with its extension. By doing this, you can open the extracted file with a suitable tool and continue to analyze it.
Important note
If you export a file that you think is malicious, make sure that you do not run it on your work machine for analysis. It is better to work with such files in sandboxes or to process them with special tools, which we will discuss in the next chapter.
With that, the files have been taken care of, but what about the processes related to browsers?
Investigating browser history
Browsers can contain a lot of useful data. By analyzing the browser history, we can understand what sites the user visited, what search queries user performed, and what files were downloaded. Even if a private mode or a special browser (for example, Tor Browser) was used to surf the internet, we can still find useful information in memory.
The following screenshot shows the output of the pslist plugin, where we can see several processes related to Google Chrome, Mozilla Firefox, and Tor Browser:
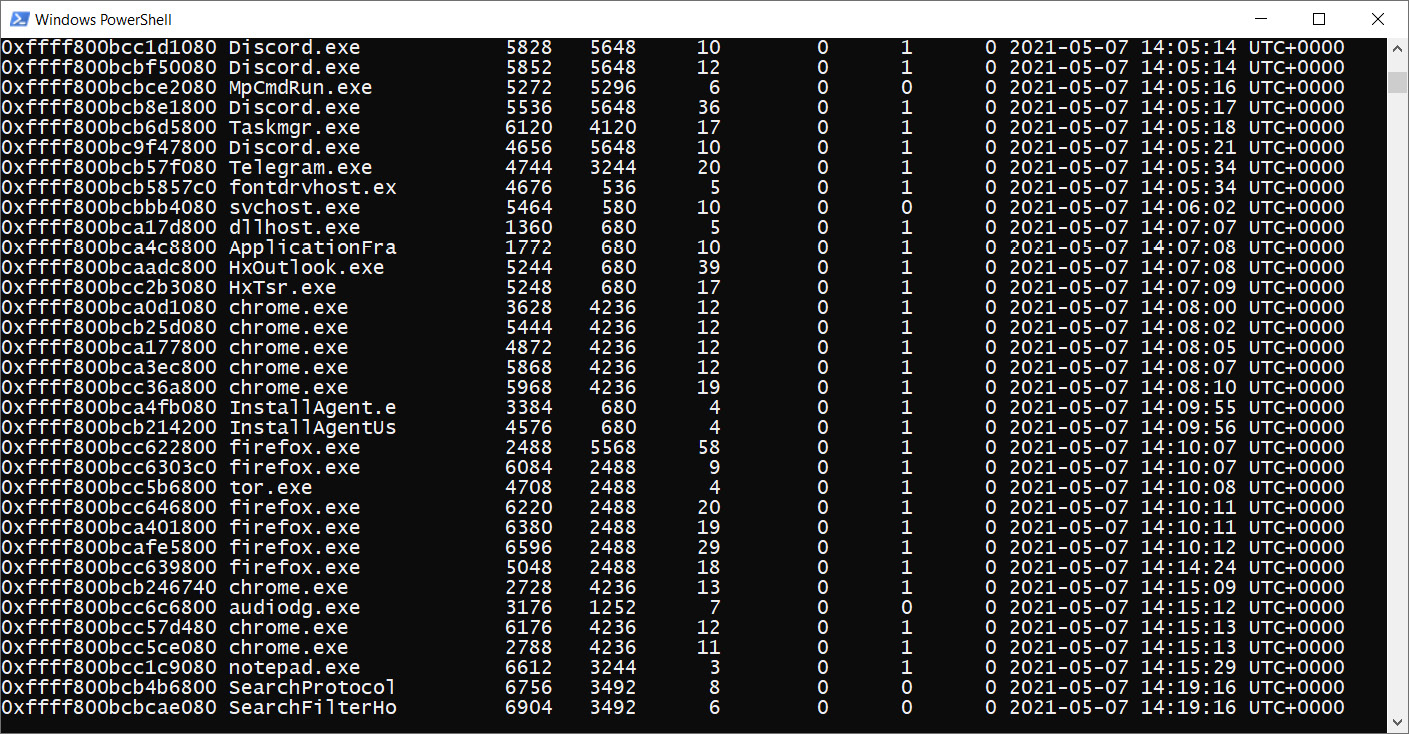
Figure 4.12 – Browser-related processes
So, how do you get information about the visited resources? There are several ways to do this:
- Export the process memory and process it with the Strings utility (https://docs.microsoft.com/en-us/sysinternals/downloads/strings), which allows you to get the list of ASCII and Unicode symbols from various files.
- Export the process memory and process it with bulk_extractor (https://downloads.digitalcorpora.org/downloads/bulk_extractor/), which allows you to scan disk images, memory dumps, specific files, or directories and extract useful information.
- Search for URLs using regular expressions or YARA rules.
We have three browsers and three options, so this looks like a good plan. Let's start with Google Chrome and the regular expression search.
Chrome analysis with yarascan
Yarascan is one of the Volatility plugins that allows you to search for some specific information using regular expressions or YARA rules.
Important note
YARA was originally developed to help malware researchers with detecting and classifying malware samples. However, this tool is also applicable to memory forensics since it allows us to create search patterns using textual or binary data. For more information, see https://yara.readthedocs.io/en/v4.1.0/gettingstarted.html.
To use yarascan with a YARA rule file, we need to provide a path to the .yar file with the -Y option. In our case, we will run it with the -y option and the /(https?://)?([w.-]+)([/w .-]*)/ regular expression. In addition, we will scan just one of the Chrome processes – the process with ID 4236, as shown here:
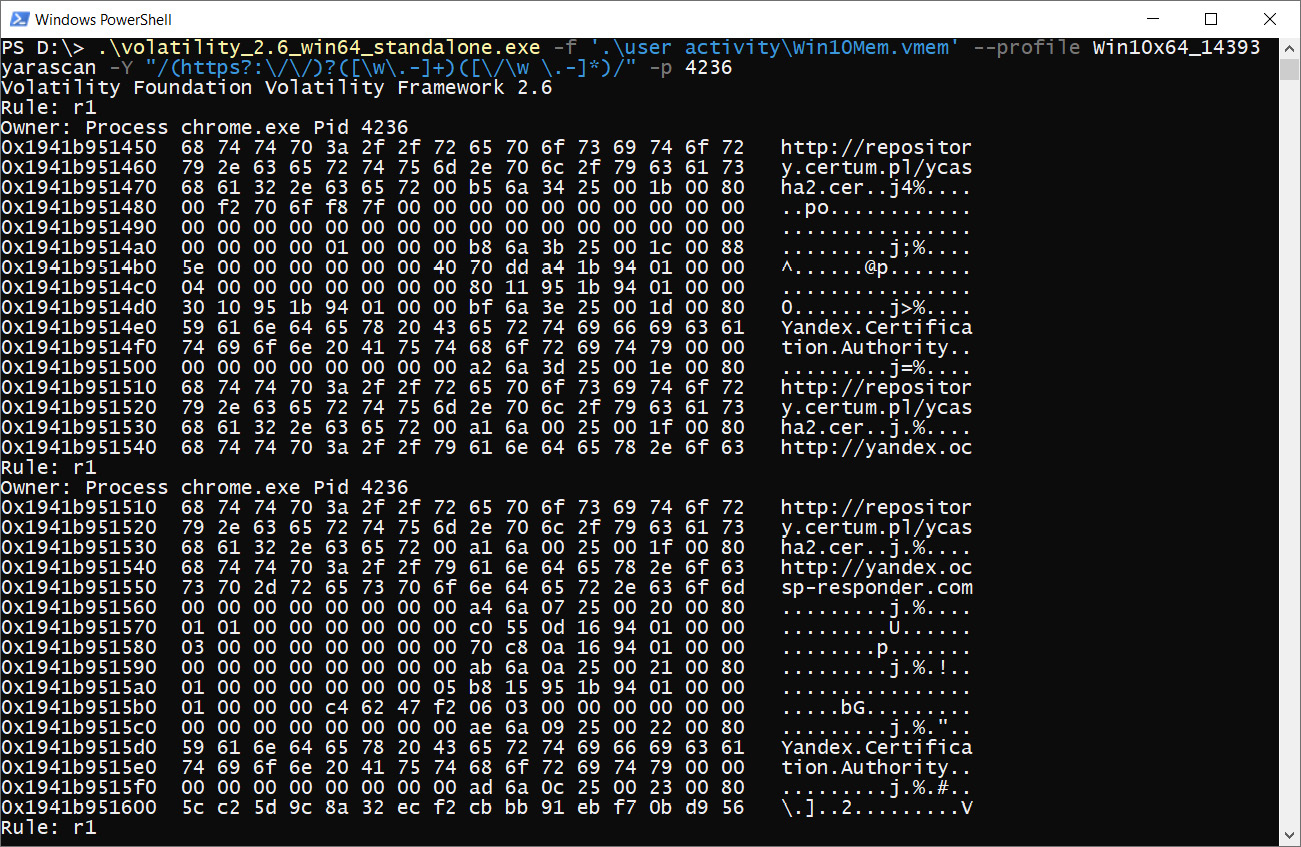
Figure 4.13 – Volatility yarascan
Here, you can see that we managed to find several links using this regular expression right away – these links are in the memory of the Google Chrome process with ID 4236.
Now that we've looked at Chrome, let's move on to Firefox.
Firefox analysis with bulk extractor
Bulk extractor is a command-line tool that allows you to search for some specific information, such as URLs, emails, and PDF files in different sources. There is also BEViewer, a graphical interface for bulk extractor, but it requires additional installation.
Before using this tool, we need to dump the memory of the Firefox process. The memdump plugin is great for this as all we need to add is the -p option, along with the ID of the required process, and the -D option, along with the folder where we want to save the dump. In our case, the ID is 6380 and the path is .user activityfirefox.
When the plugin completes, a file with the process ID set to a name and the .dmp extension will appear in the specified directory.
Now, we can launch our bulk extractor.
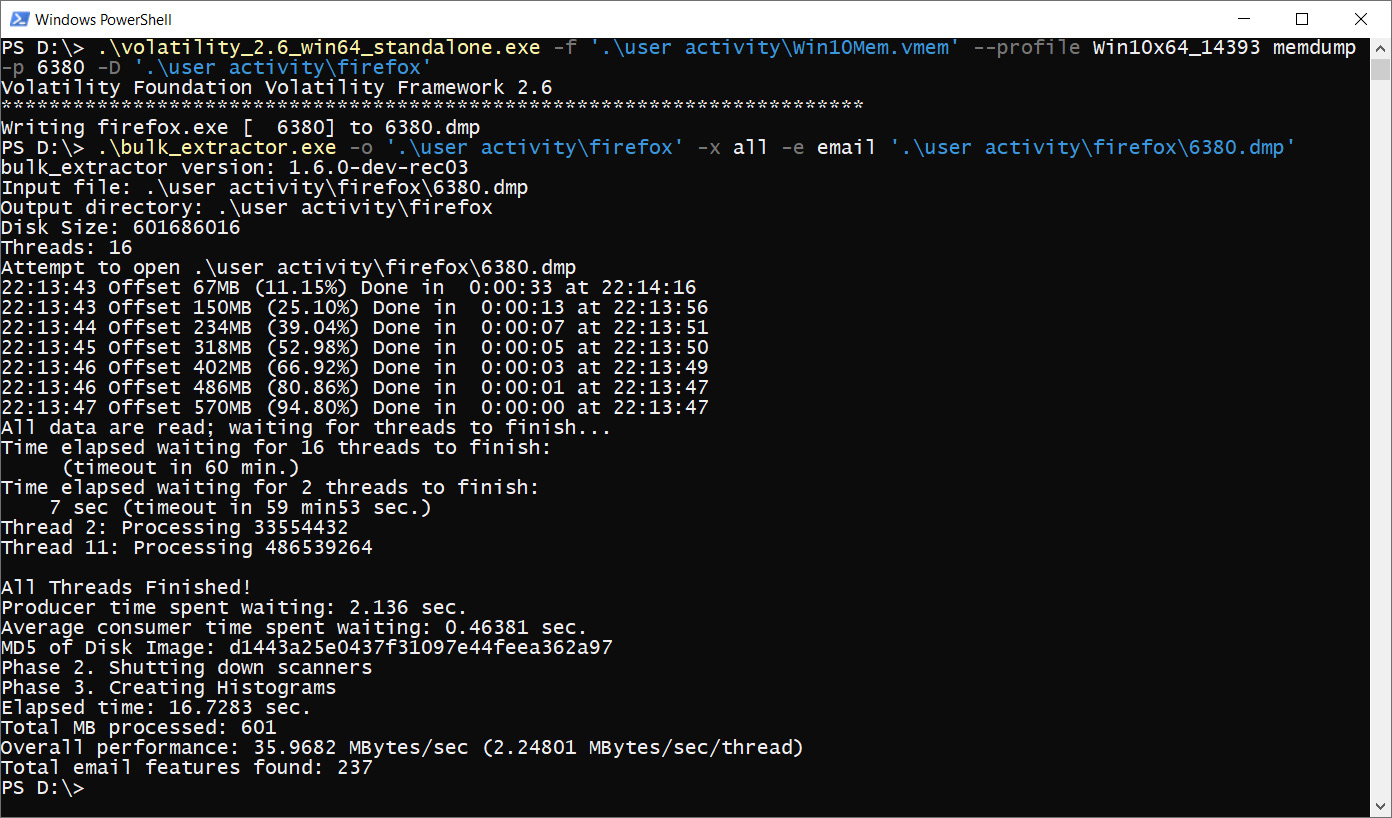
Figure 4.14 – Volatility memdump and bulk extractor
For bulk extractor, we used several options:
- -o: Provides an output directory
- -x all: Disables all scanners
- -e email: Enables an email scanner that searches for emails and URLs
In the end, we need to provide a path to the file that we want to analyze.
Important note
To see all bulk extractor scanners available for use, simply run bulk_extractor.exe without adding any options.
As a result, several files will appear in the specified directory:
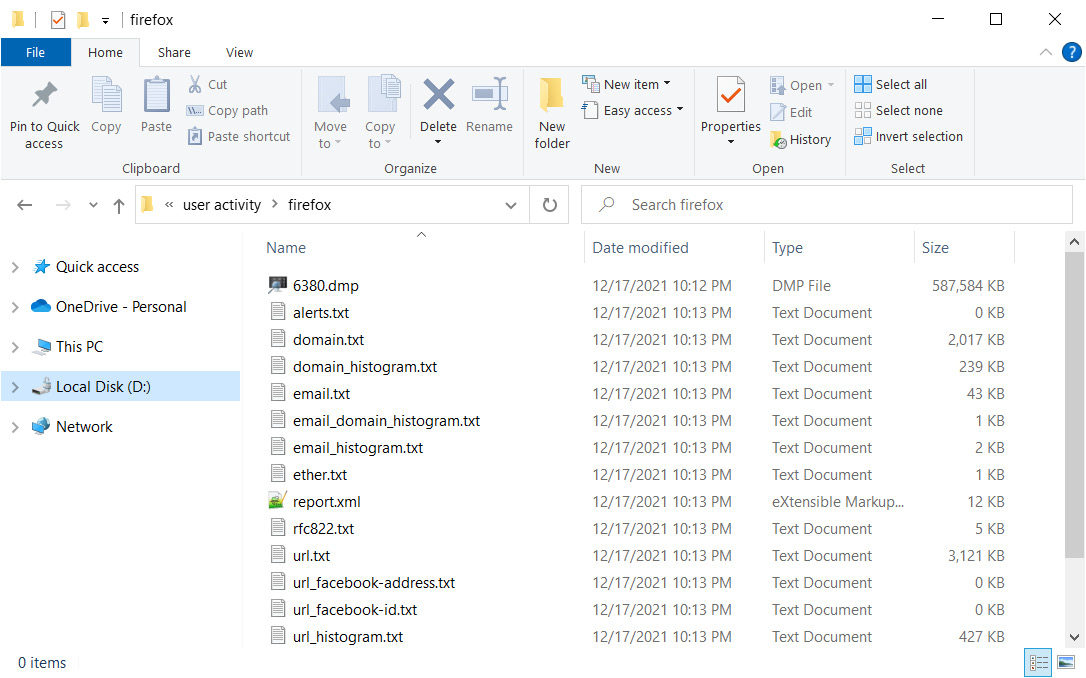
Figure 4.15 – Bulk extractor's output
In these files, we can find information about the emails and URLs that appeared in Firefox's memory. For instance, we can look into url_histogram.txt:
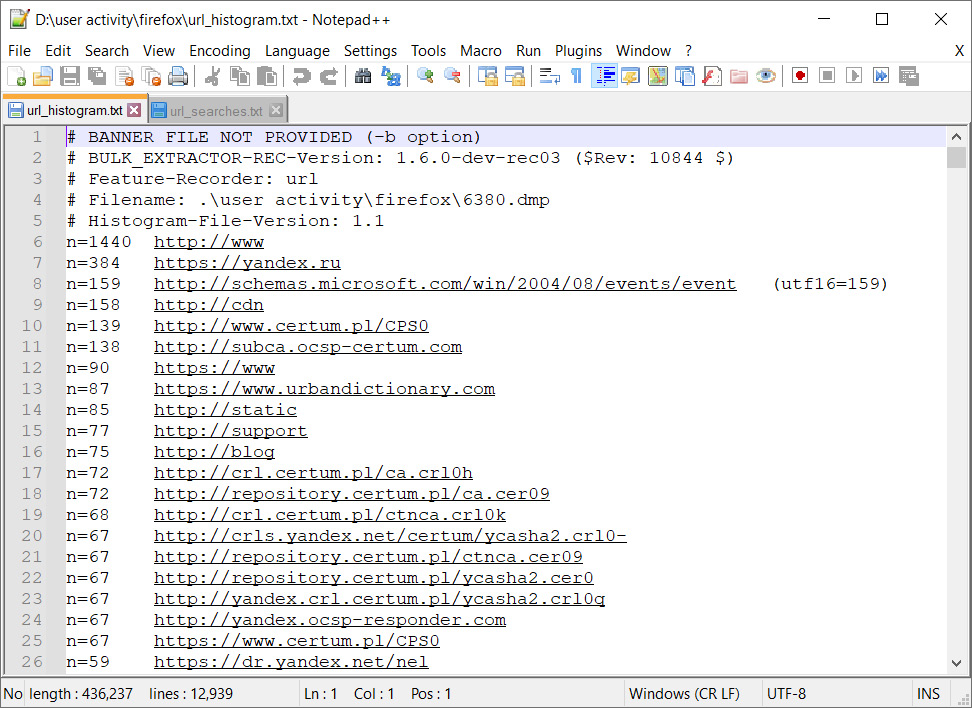
Figure 4.16 – URL histogram file's content
Alternatively, we can check the searches that were made via the Firefox browser in the url_searches.txt file:

Figure 4.17 – URL searches
From this, we can see that our user was searching for Tor Browser.
Now that we've looked at Chrome and Firefox, it is time for the most fun part. Let's try to analyze the Tor process with the Strings utility.
Tor analysis with Strings
Tor is a private browser that allows you to visit not only standard resources but also sites in the deep and dark webs, where some private and sometimes illegal sources are located. Hence, we just can't ignore this process.
For analysis, we will use the Strings utility, which is part of Sysinternals Suite and can be used to search for different characters in files. When analyzing private browsers such as Tor, this utility is very useful.
Before we start, we need to dump our Tor memory. We can use the previous technique to do so. Our tor.exe file has ID 4708, so we will use it with the -p option for the memdump plugin. Do not forget to add the -D option and provide a path to the location where you want to store the dump.
After creating the dump, we can run the Strings utility. For this, we must pass the path to our process dump as an argument and redirect the output to a text file, as we did previously. As a result, we get the following output:

Figure 4.18 – Volatility memdump and the Strings utility
This option takes longer and the final file is harder to work with, but there is more data to find than with the standard URLs.
We end up with a text file that looks like this:
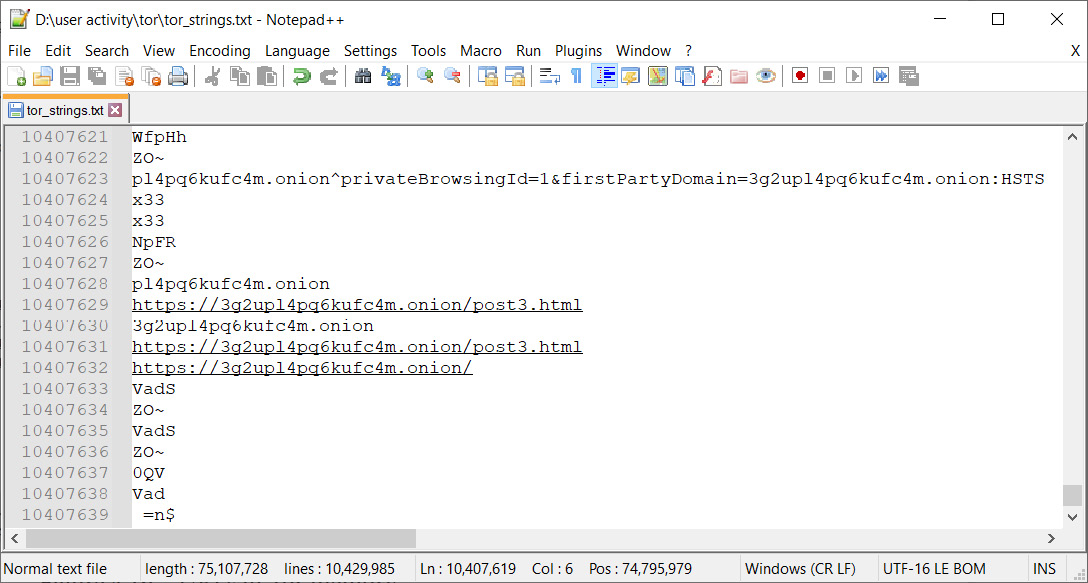
Figure 4.19 – URLs in Tor memory
We can also use regular expressions or the usual keyword search to quickly find information of interest.
With that, we've looked at the history of browsers and even touched on the subject of email analysis. Now, let's take things further and take a closer look at emails and messengers.
Examining communication applications
How often do you use communication apps to chat, send videos, or look at pictures of cute cats that have been sent to you? The answer is probably every day. Email and messengers have become an essential part of our lives, so we cannot avoid them. While examining the dump that's been taken from the victim's computer, we might come across a malicious document sent by email, and in the memory dump of the suspect's computer, we might find correspondence with accomplices.
We have already talked about email, so we'll start there.
Email, email, email
Nowadays, there are many different email agents, and some people prefer to use a browser to check their mail. Thus, we can reduce the analysis to the following:
- If, in the list of running processes, we see a process related to the email agent, we can check the resources being used by the handles plugin and look for files that might be in the attachment.
- Also, if there is an active email agent process, we can extract its memory with the memdump plugin and process the dump file with the Strings utility. This will allow us to search not only for filenames in attachments but also for fragments of the emails themselves.
- Run bulk extractor, as we did in the previous section, but now use it to analyze the entire memory dump. In this case, we will be able to collect information about all the emails and attachments, regardless of using an email agent or a browser. However, be careful as bulk extractor will take much longer to run than it did previously.
Since all these methods have already been described in detail, we will take a look at just one of them: analysis with bulk extractor.
Since we will now use the whole dump for searching, we do not need to extract the memory of individual processes. The command for this will look like this:
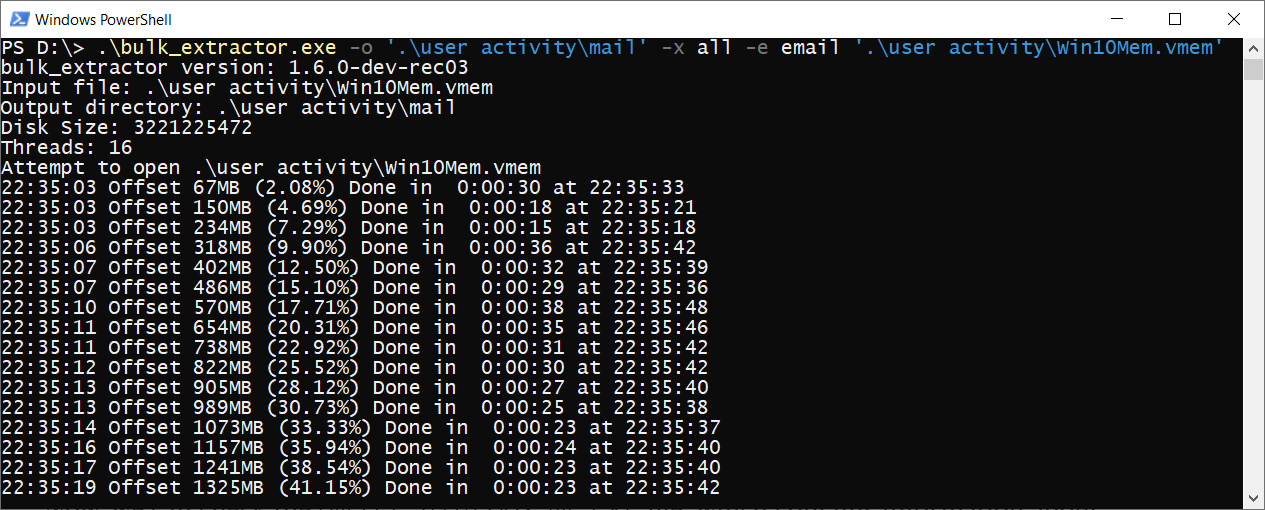
Figure 4.20 – Full memory dump analysis with bulk extractor
Now, we can check the email_histogram.txt file, which contains information about all the email addresses that appeared in memory:
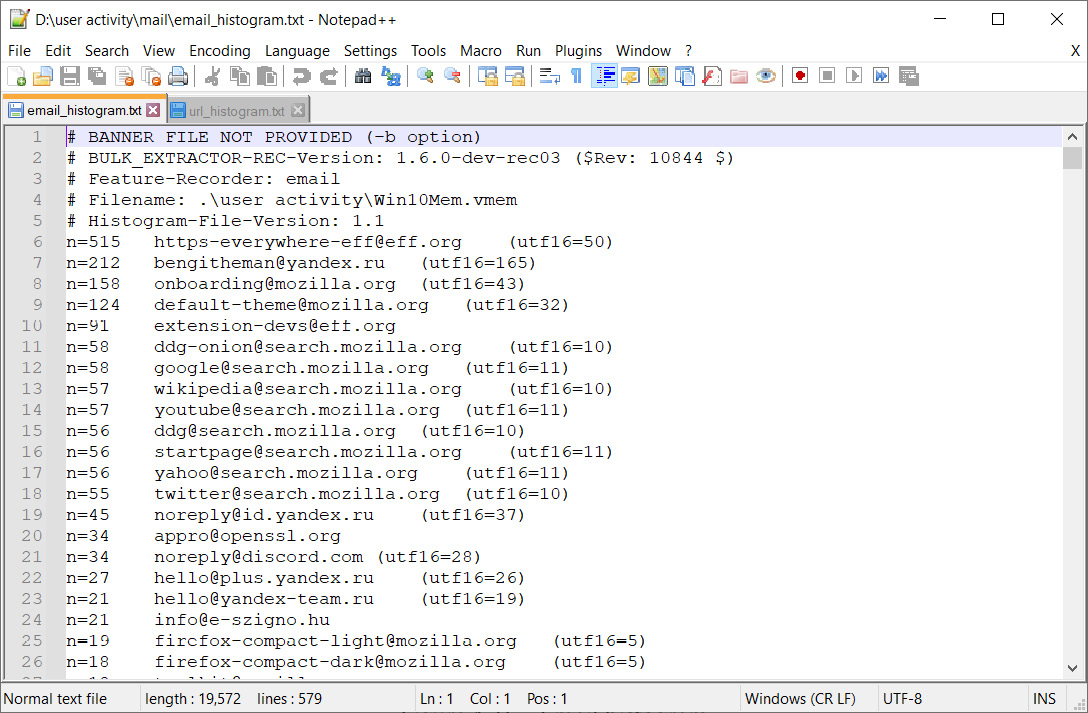
Figure 4.21 – Email histogram
We also can do a keyword search against the url_histogram.txt file to find information about mailboxes and attachments:
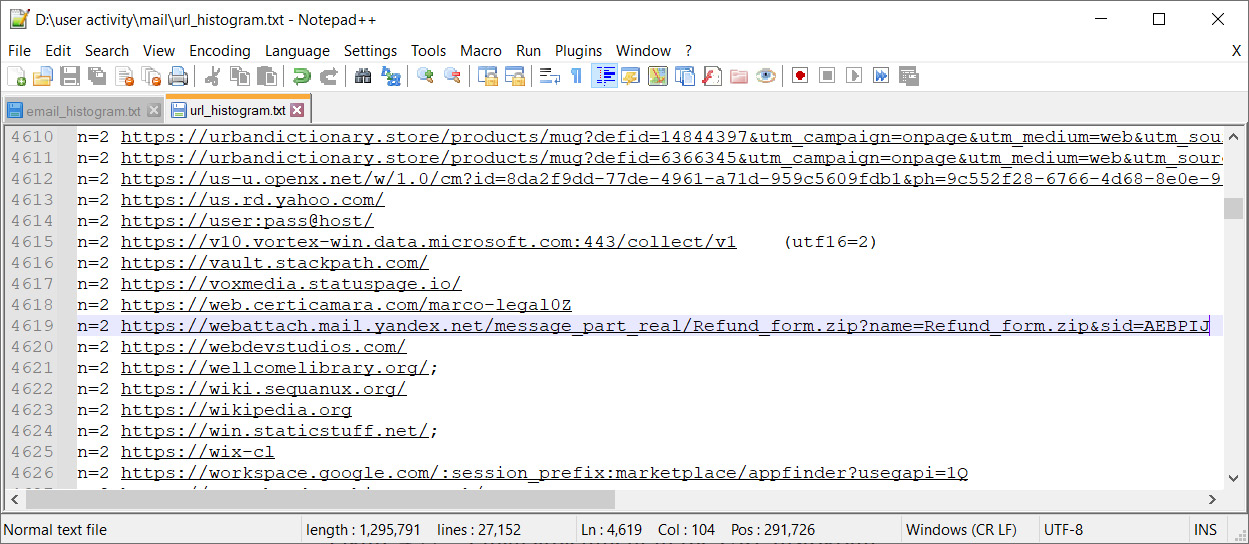
Figure 4.22 – Email attachment in the URL histogram
Everything seems to be clear regarding emails, but what about messengers? How can we look into conversations and find something useful in them?
Instant messengers
When it comes to messengers, the easiest thing to use is a messenger memory analysis tool. Let's look at our list of processes again:
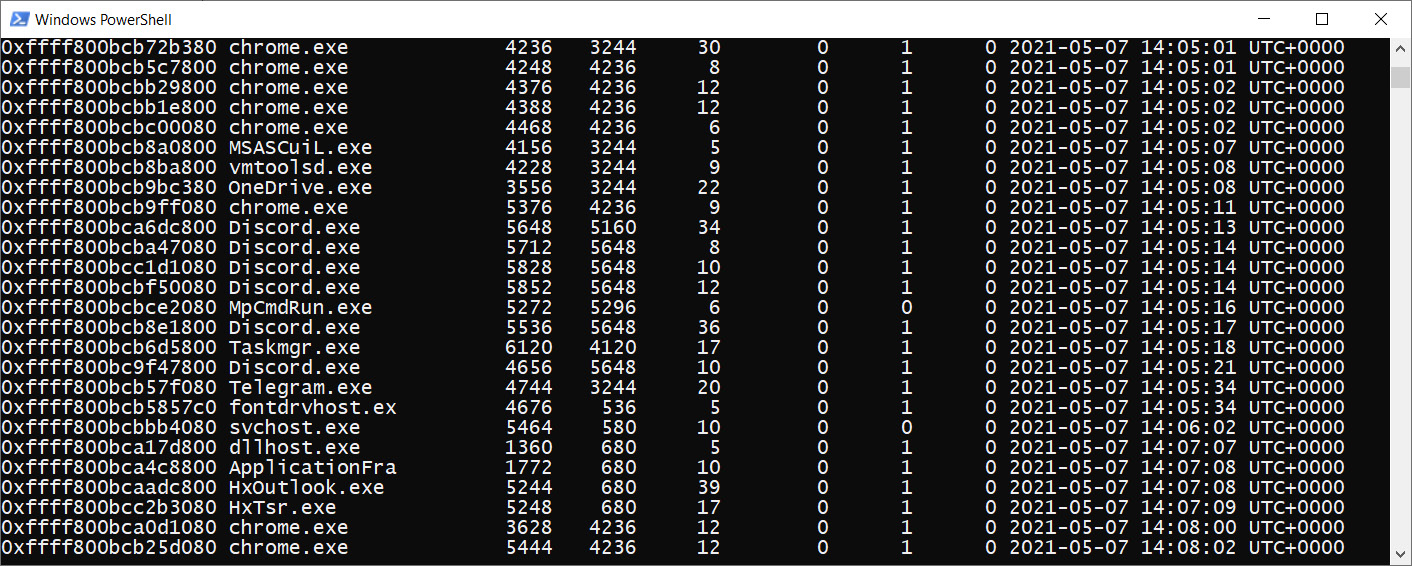
Figure 4.23 – List of active processes
In the list of active processes, we can see a couple of well-known messengers, including Telegram and Discord. We can dump the memory of these processes and parse it with the Strings utility, as shown in the following screenshot:
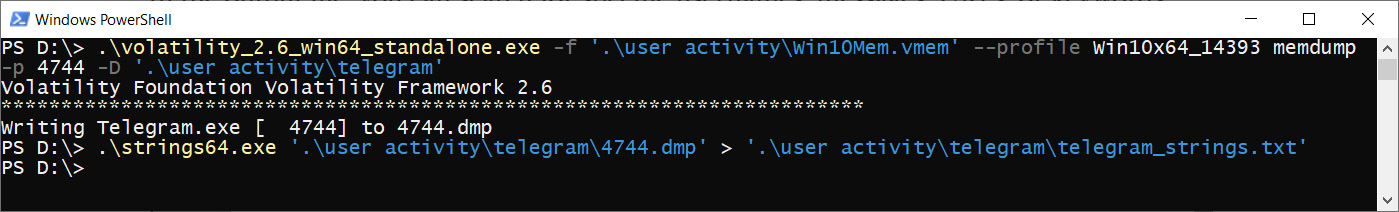
Figure 4.24 – Telegram memory extraction and parsing
In the output file, you can search for specific usernames, messages, URLs, or keywords:
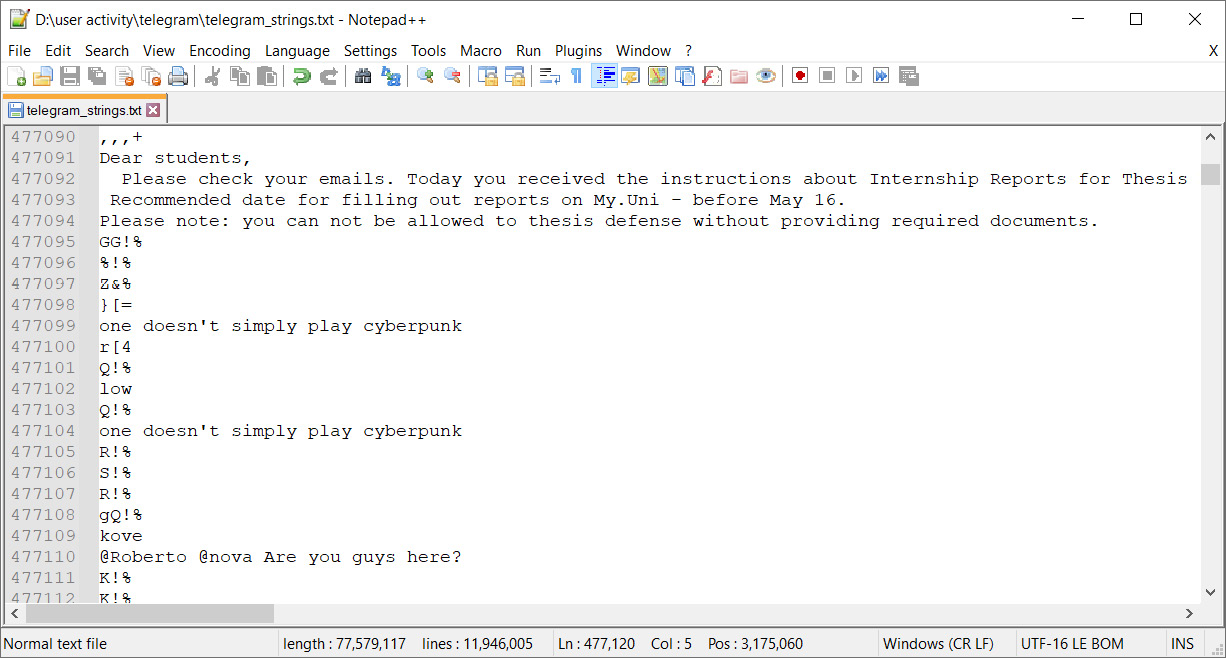
Figure 4.25 – Message history in Telegram's memory
This is how we can get some insights into the instant messengers' memory. By the way, some people can use messengers and chats with themselves to share their passwords between several devices, so you can check for the appearance of passwords as well.
Recovering user passwords
Instant messengers are not the only location where we can search for passwords. We can find them in a cache, in the memory of text editors, buffers, command lines, or even some specific system processes. Volatility has several plugins to collect information about credentials:
- hashdump
- lsadump
- cachedump
Let's check them out, one by one.
Hashdump
The hashdump plugin can be used to dump hashes of local user passwords on Windows systems before Windows 8. The command will look like this:

Figure 4.26 – Volatility hashdump
In the output, you can see the account name, followed by the relative identifier and the LM and NT hashes. Notice that we have the same hashes for Administrator and Guest users. These specific hashes indicate blank passwords.
Another way to dump credentials is to use the cachedump plugin.
Cachedump
This plugin can be used to dump hashes of cached domain user passwords. By default, our system stores up to 10 of the most recent domain account credentials. We can try to access them with cachedump. Its execution is quite similar to that of hashdump:
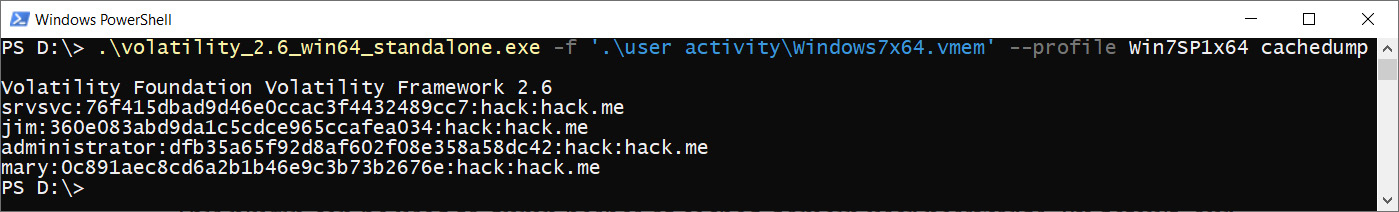
Figure 4.27 – Volatility cachedump
Here, you can see the domain username, followed by the password hash and the domain itself.
Another thing that we can do is search for Local Security Authority (LSA) information.
Lsadump
The LSA subsystem service is responsible for user authentication, so its analysis can help us obtain some useful information. Look at the following example:
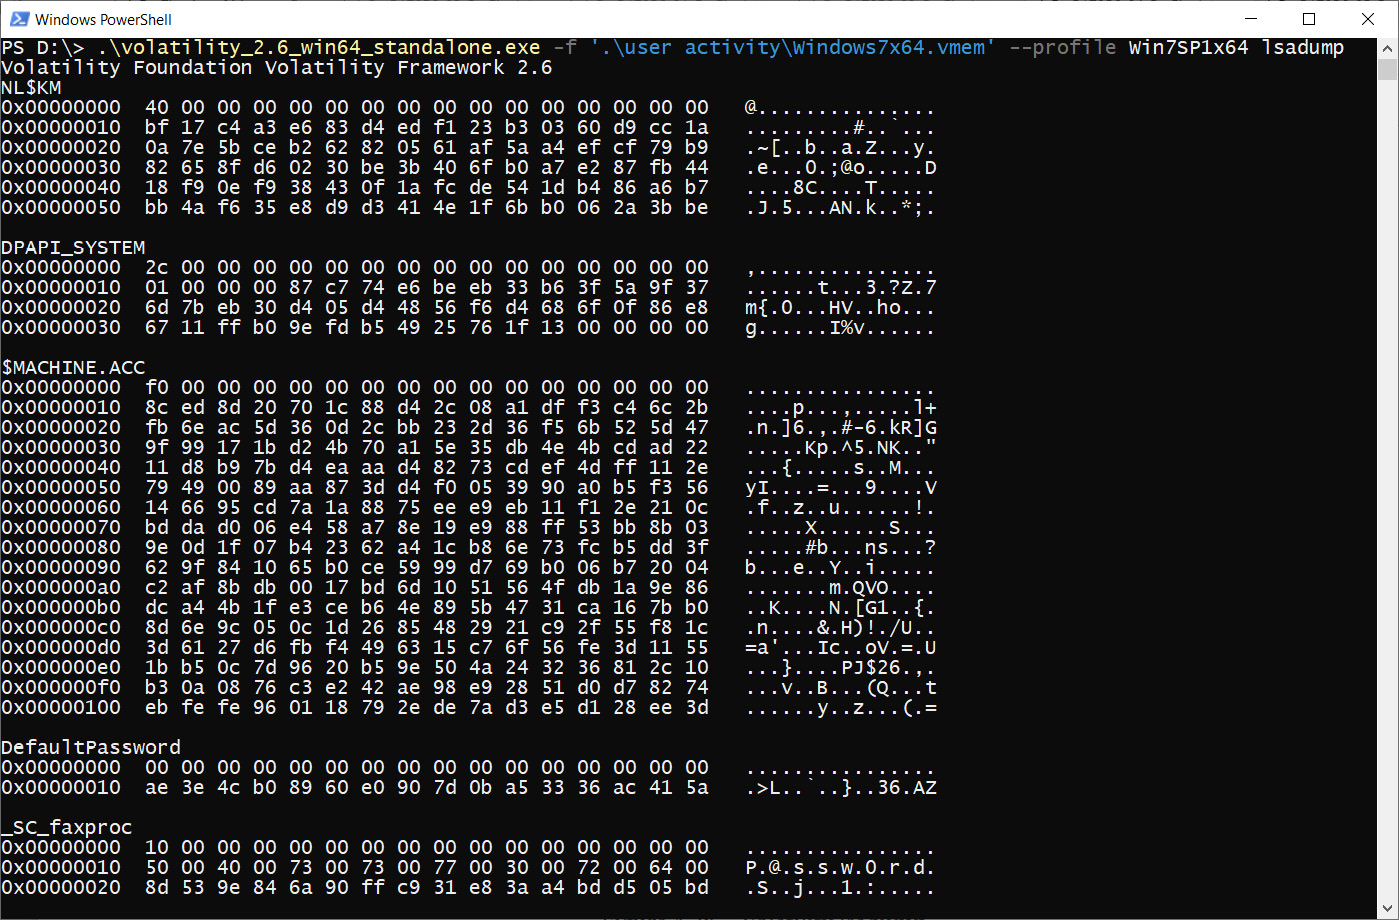
Figure 4.28 – Volatility lsadump
Here, we can see information from different resources and for some of them, we can identify plaintext passwords. Other locations where plaintext passwords can be found are in the memory of text editor processes or the command lines of some specific tools, such as PsExec.
Plaintext passwords
Since we have already learned how to extract and analyze process memory, let's concentrate on the command line. Volatility has several plugins that allow us to retrieve command-line arguments. One such plugin is cmdline. It does not require any additional arguments:
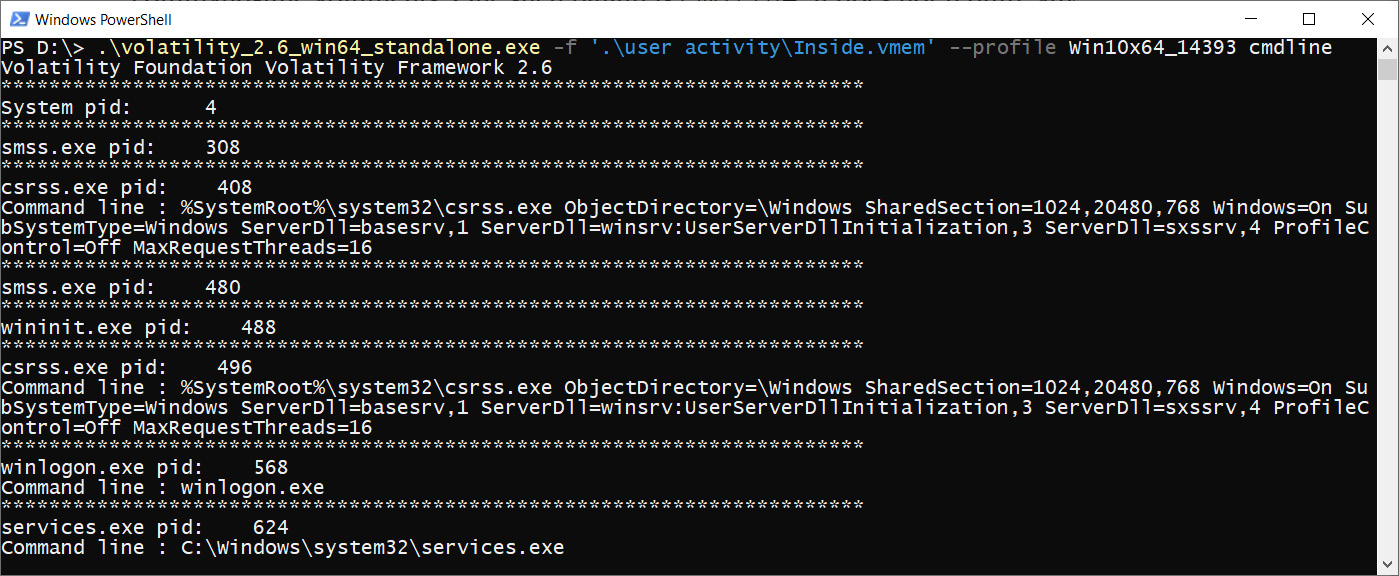
Figure 4.29 – Volatility cmdline
From the very beginning, we can see information about the start of the system processes and the command lines that have been used for this purpose. In the case of running programs that require the password to be transmitted in clear text, we will be able to find something similar to the following:

Figure 4.30 – Plaintext password in the PsExec command line
In this case, we can see that PsExec has been used to connect remotely to the win7 host and that the max user password has been transmitted in plaintext.
Now, you have several ways to get the user's password information. But what about those who use encryption and crypto containers?
Detecting crypto containers
There are several popular encryption tools for Windows:
- Bitlocker
- TrueCrypt
- VeraCrypt
Although the implementation of these tools varies, they all serve the same purpose – to encrypt user data. For some, this may be an opportunity to keep their data private, while for others, it may be an opportunity for them to hide their illegitimate activity. For us, as investigators, it is important to understand that if the encrypted disk was used at the time of dumping, we may find cached volume passwords, master encryption keys, some parts of unencrypted files, or their exact location in memory.
The first step of our investigation here is to identify if there are any encryption tools and what data was encrypted. Sometimes, we will be able to easily identify the tool from the list of running processes, as shown in the following screenshot:

Figure 4.31 – VeraCrypt process
Unfortunately, Volatility does not provide a lot of functionality to work with different encryption solutions, but it has a nice set of plugins for TrueCrypt:
- truecryptmaster searches for encryption master keys.
- truecryptpassphrase searches for the passphrase that was used.
- truecryptsummary collects TrueCrypt-related information.
The last plugin allows us to gather information about TrueCrypt processes, services, drivers, associated symbolic links, and file objects.
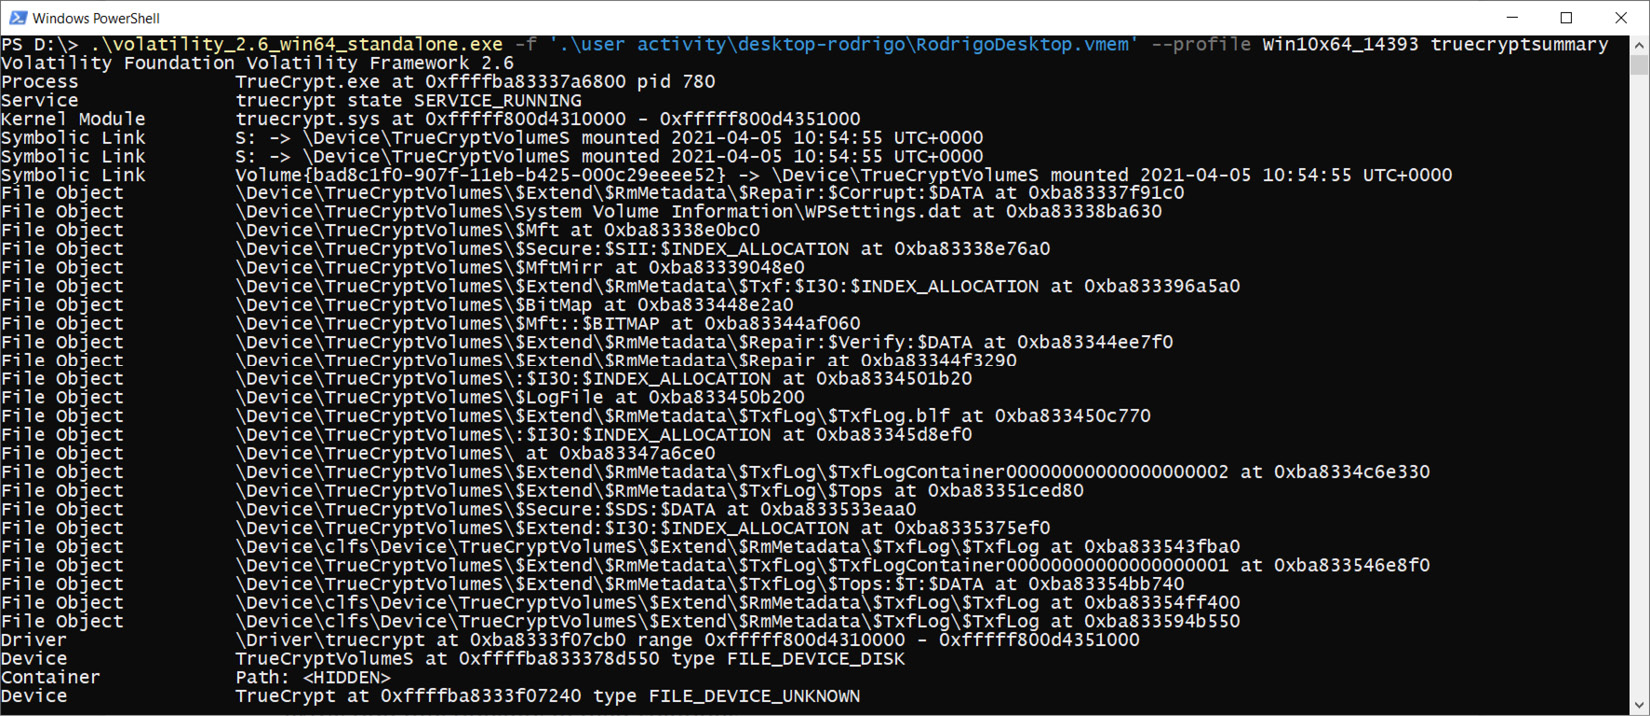
Figure 4.32 – Volatility TrueCrypt summary
Here, we can see that one of the drives was encrypted with TrueCrypt, so we can try to extract the master key from memory:
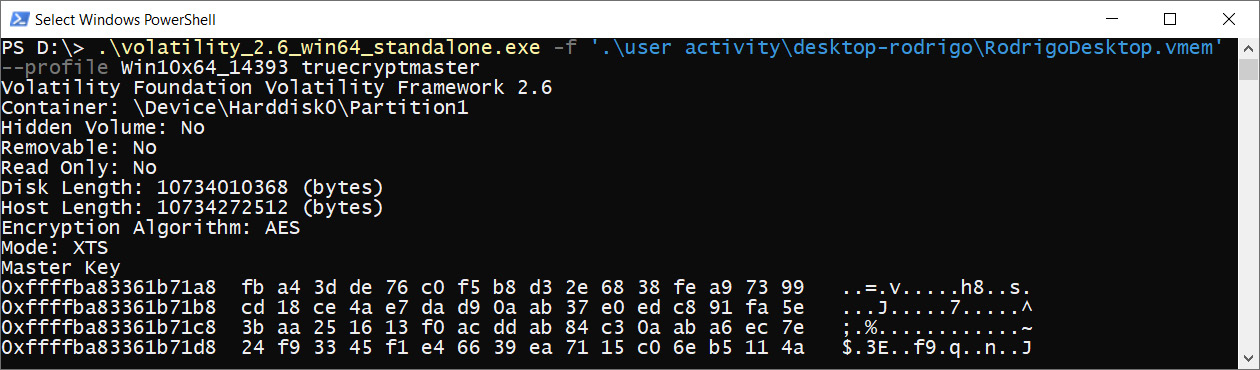
Figure 4.33 – Volatility TrueCrypt master key
By default, TrueCrypt and some other tools use AES for encryption. That is why an alternative way to get the encryption master key is to use any tool with AES detection functionality. We have already discussed such a tool: one of the bulk extractor scanners can be used for this purpose. Let's run aes scanner:
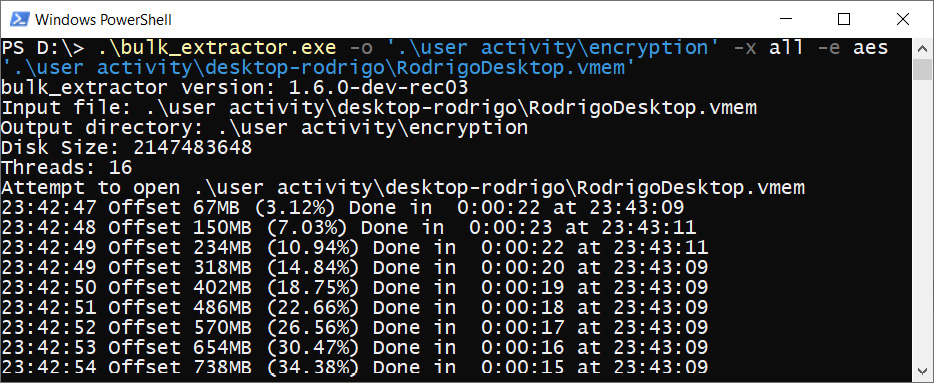
Figure 4.34 – Bulk extractor AES scanner
As result, we will get a text file called aes_keys.txt. The content of this file looks as follows:
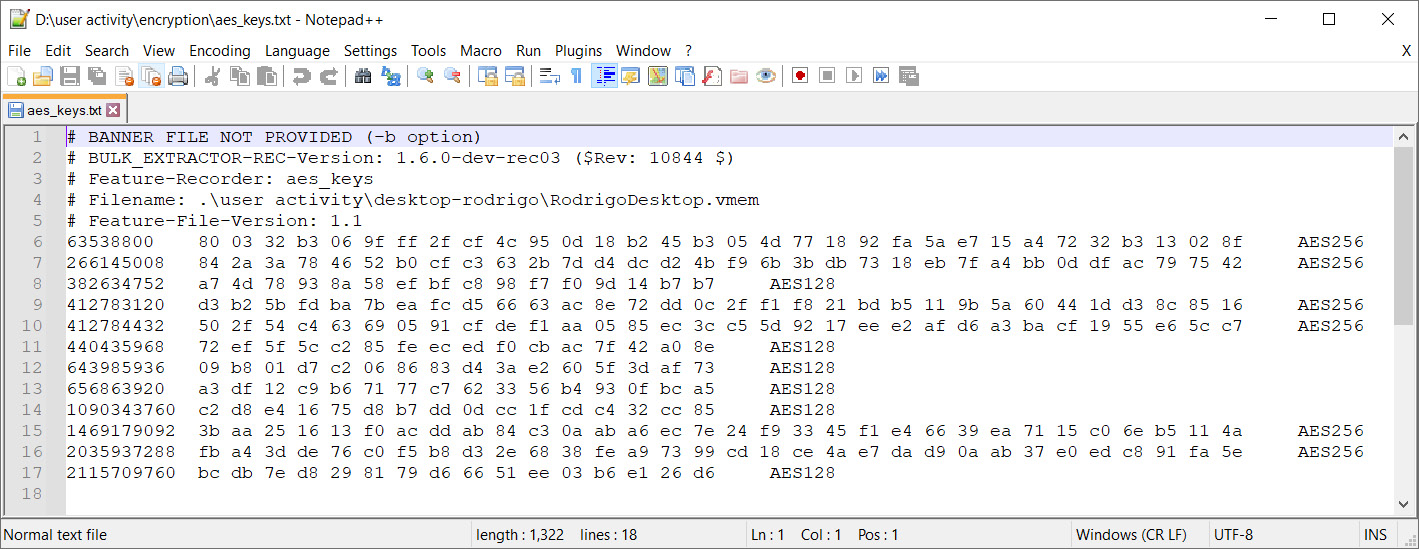
Figure 4.35 – Extracted AES keys
Here, we found several couples of AES256 keys. By combining these couples of 256-bit keys, we can obtain our 512-bit master key.
This process is not very easy, which is why some forensic software developers included key extraction functionality in their solutions.
Passware is one of the most popular solutions to search for encrypted files, decrypt encrypted drives, and recover Windows passwords and passwords stored in Password Managers. This tool supports most of the solutions for full-disk encryption, including BitLocker, TrueCrypt, and PGP.
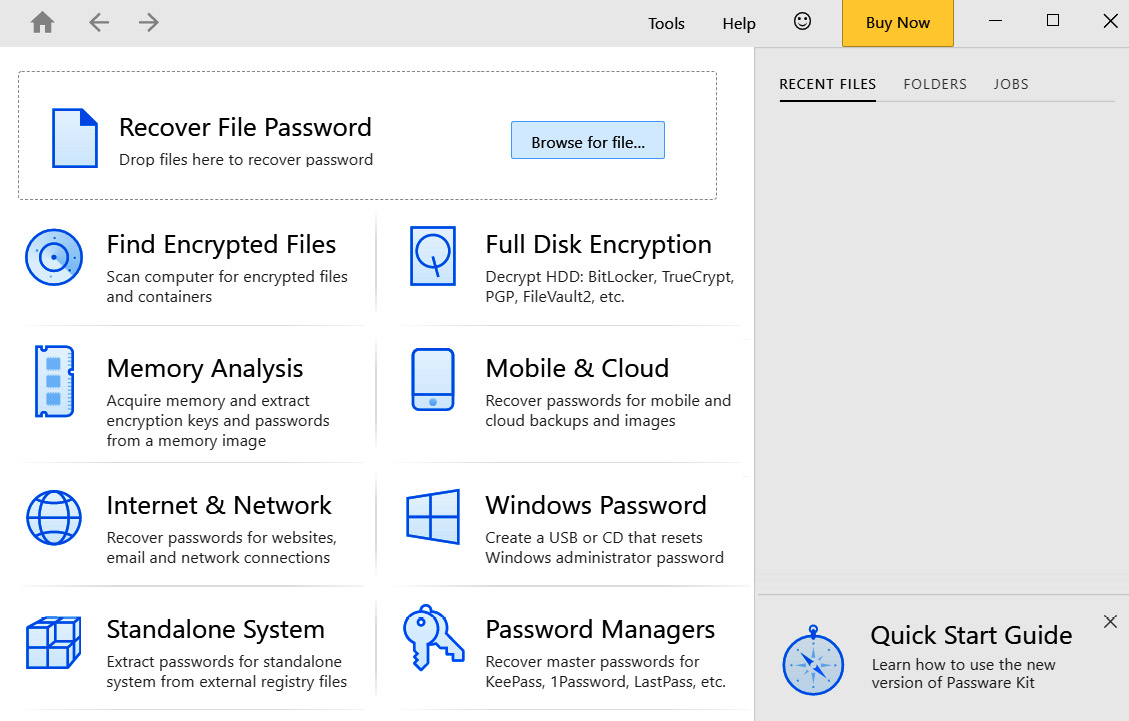
Figure 4.36 – Passware
If you want to try this tool, you can request a demo version from their official web page: https://www.passware.com/kit-forensic/.
We have already discussed how to find launched programs and opened documents, how to recover passwords, and how to detect encrypted drives. However, there is one important thing that was left behind – Windows Registry.
Investigating Windows Registry
Information about the programs that are frequently run by the user, recently opened documents, outgoing RDP connections, and much more is written in the computer's registry, and we always have the most recent version of it in our memory. To avoid confusion, we need to understand how the registry works in Windows.
Virtual registry
To work properly, your computer needs to store information about hardware and software configurations, data about all the system users, information about each user's settings, and much, much more. When our system starts up, it collects this information from the hardware and registry files stored in non-volatile memory and creates a virtual registry in memory. This virtual registry is where the current configurations are stored, and where all the changes that will be transferred to the files and written to disk will be stored in the first place. The process of interacting with the registry is ongoing, so we can always find the hives of the virtual registry and associated files in the memory dumps.
Most of the time, we have to work with several files:
- SAM contains information about groups and users, including their privileges, passwords, and last login date.
- SYSTEM contains OS-related information such as the computer's name, services, connected USB devices, time zone information, and network adapter configuration.
- SOFTWARE contains information about installed software, scheduled tasks, autorun, and application backward compatibility.
- NTUSER.DAT contains information related to a particular user: last viewed documents, frequently run programs, explorer history, and outgoing RDP connections.
Remember the userassist plugin? It takes information from the registry – to be more exact, from the NTUSER.DAT file. Both hashdump and cachedump also use the registry.
Let's see how we can work with the registry files in memory.
Important note
We are not going to cover the details of Windows Registry forensics as this topic requires in-depth studying. However, we will break down the main keys required for our purposes.
Volatility provides several plugins for general work with the registry:
- Printkey shows registry keys, their subkeys, and their values.
- hivelist lists accessible registry hives.
- dumpregistry allows us to extract registry files from memory.
- Several plugins also take out the values of certain keys:
- userassist
- shutdowntime
- shellbags
All of these plugins display the values of the keys with the same name after launching them.
However, working with the registry in this way is not always convenient. In addition, they are not adapted to work with newer versions of Windows 10. What should we do if we need to analyze a fresh build? There is an excellent tool that allows you to view physical memory as files in a virtual filesystem. It is called MemProcFS.
Installing MemProcFS
Take a look at this link to learn about the installation process for MemProcFS: https://github.com/ufrisk/MemProcFS/blob/master/README.md.
This tool has several dependencies. First, you need to install LeechCore. To do so, you need to execute the following command in PowerShell:
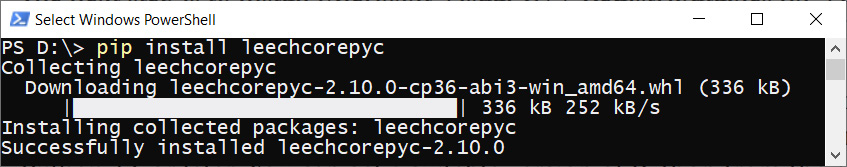
Figure 4.37 – Installing LeechCore
The next step is to install Microsoft Visual C++ Redistributables for Visual Studio 2019. You can get the installer from https://go.microsoft.com/fwlink/?LinkId=746572. Now, you must install Dokany: https://github.com/dokan-dev/dokany/releases/latest. Developers recommend that you download and install the DokanSetup_redist version. The last thing you need is Python 3.6 or later. You can get a suitable version of Python from the official web page: https://www.python.org/downloads/windows/.
Congratulations – you are now ready to download MemProcFS! Go to the MemProcFS GitHub repository at https://github.com/ufrisk/MemProcFS and search for the latest releases.
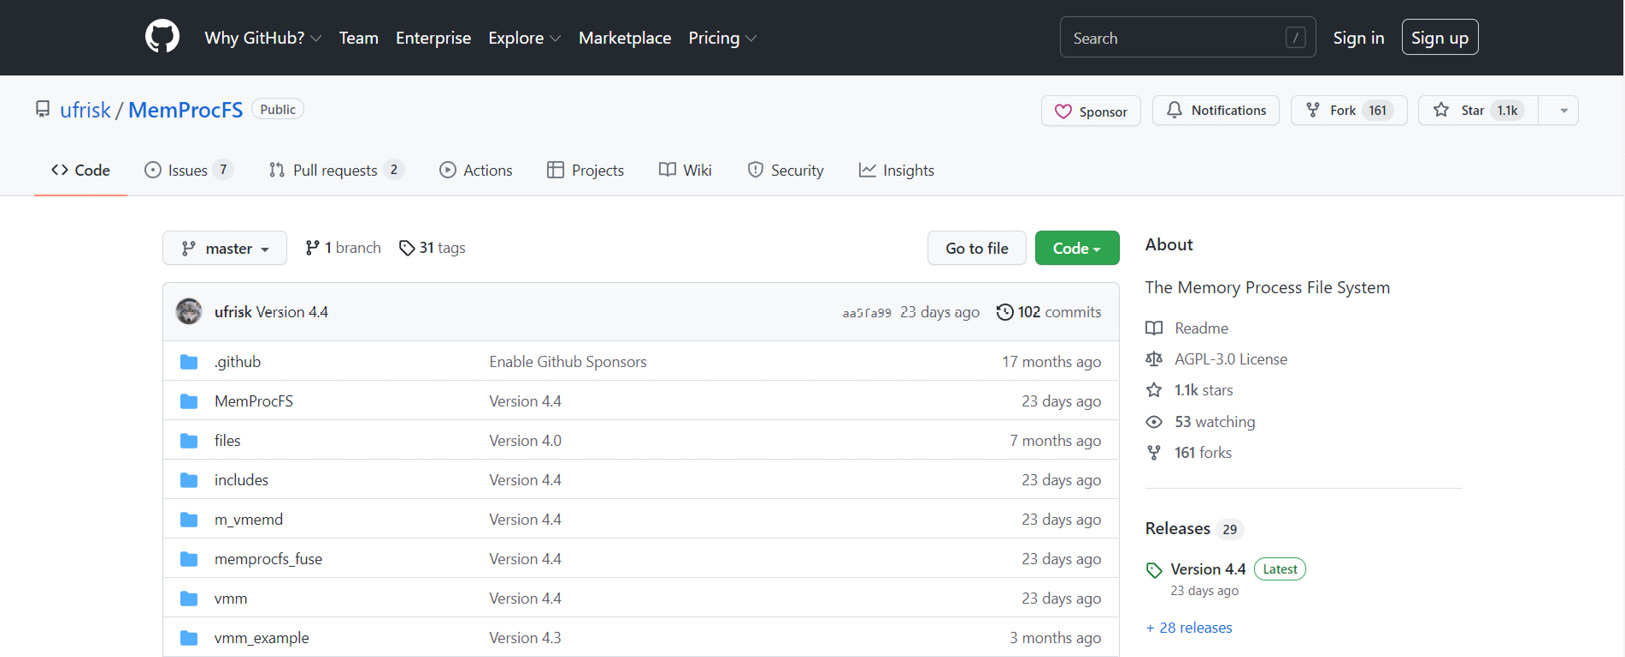
Figure 4.38 – MemProcFS GitHub repository
Download the files_and_binaries ZIP archive and unzip it to a suitable location. To run MemProcFS, open PowerShell and move to the folder where you have unzipped the files. Run the following command to create a virtual filesystem from your memory dump (use the -device option to provide the location of your memory dump).
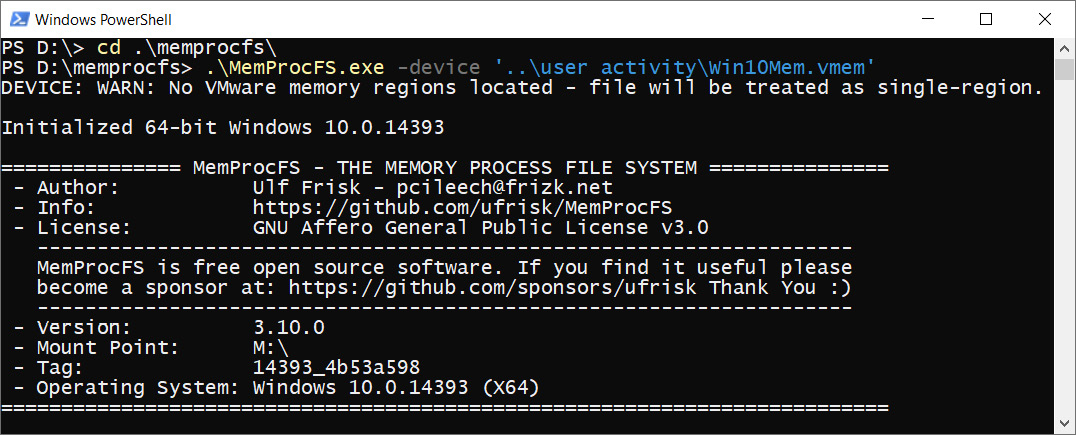
Figure 4.39 – MemProcFS execution
As you can see, our operating system was recognized and the dump was successfully mounted on the M: drive. Now, we can open this drive via Explorer and search for something interesting.
Working with Windows Registry
We decided to tell you about this tool for a reason. The point is that by using MemProcFS, you can easily extract all registry files from memory. (Honestly, you do not even need to extract anything.) Open your drive (in our case, it is the M: drive) and go to registry > hive_files, as shown in the following screenshot. Here, you will find all the registry files that are available in our dump.
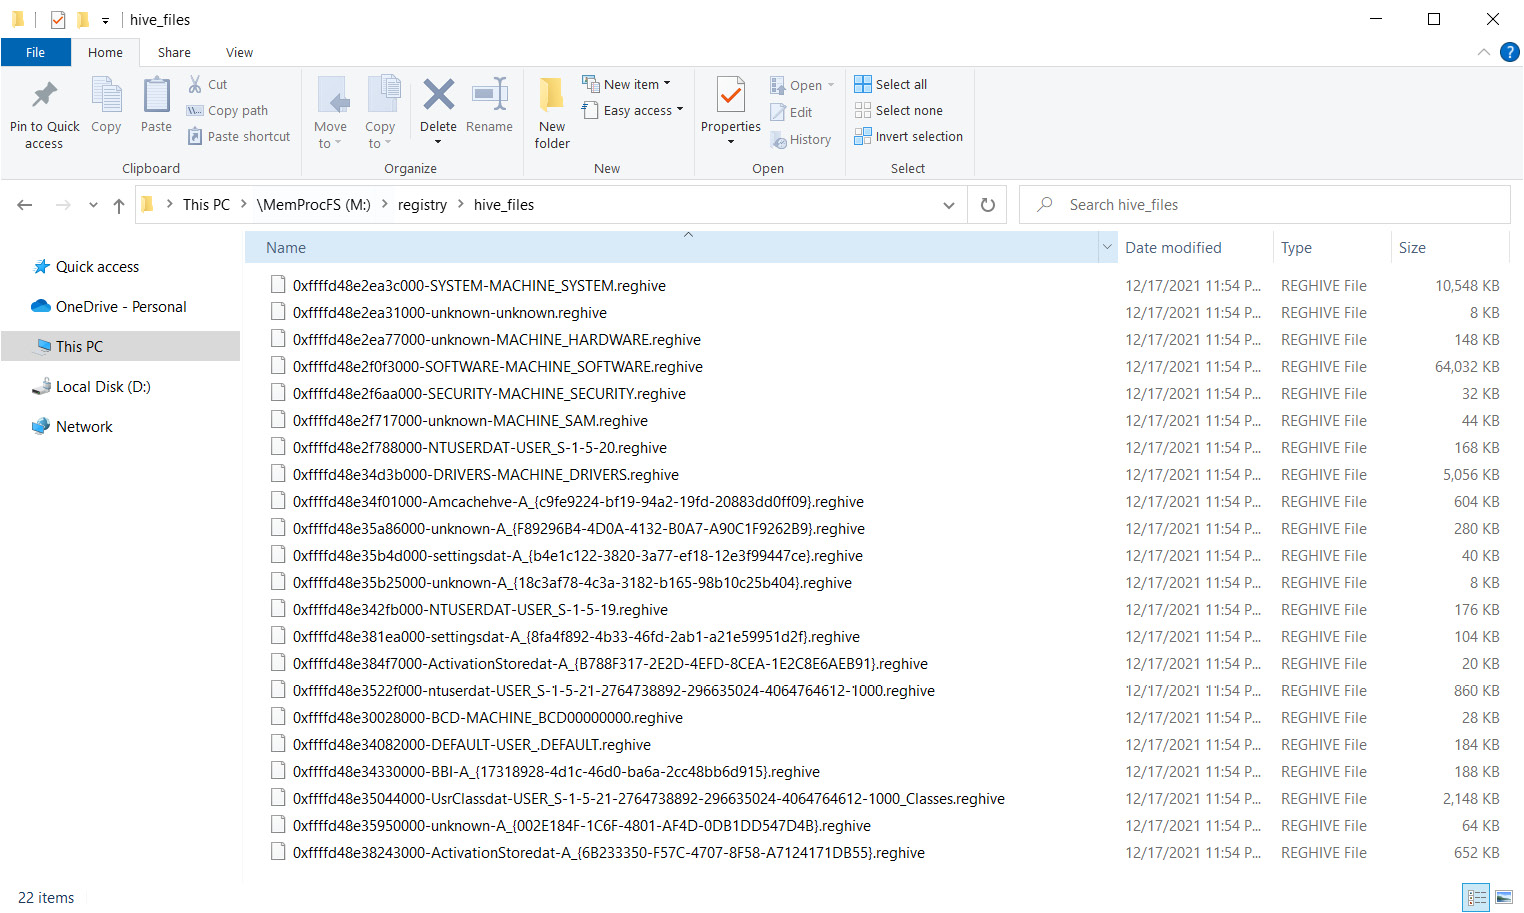
Figure 4.40 – MemProcFS Hive files
So, we found the registry, but what should we do next? There are several options here. First, you can use Eric Zimmerman's Registry Explorer tool. The latest version can be downloaded from the official repository at https://ericzimmerman.github.io/#!index.md. The archive that contains the tool must be unpacked with 7-Zip; otherwise, the tool will not work properly. Registry Explorer allows you to view various keys and values in their original form and use prepared bookmarks that contain useful information.
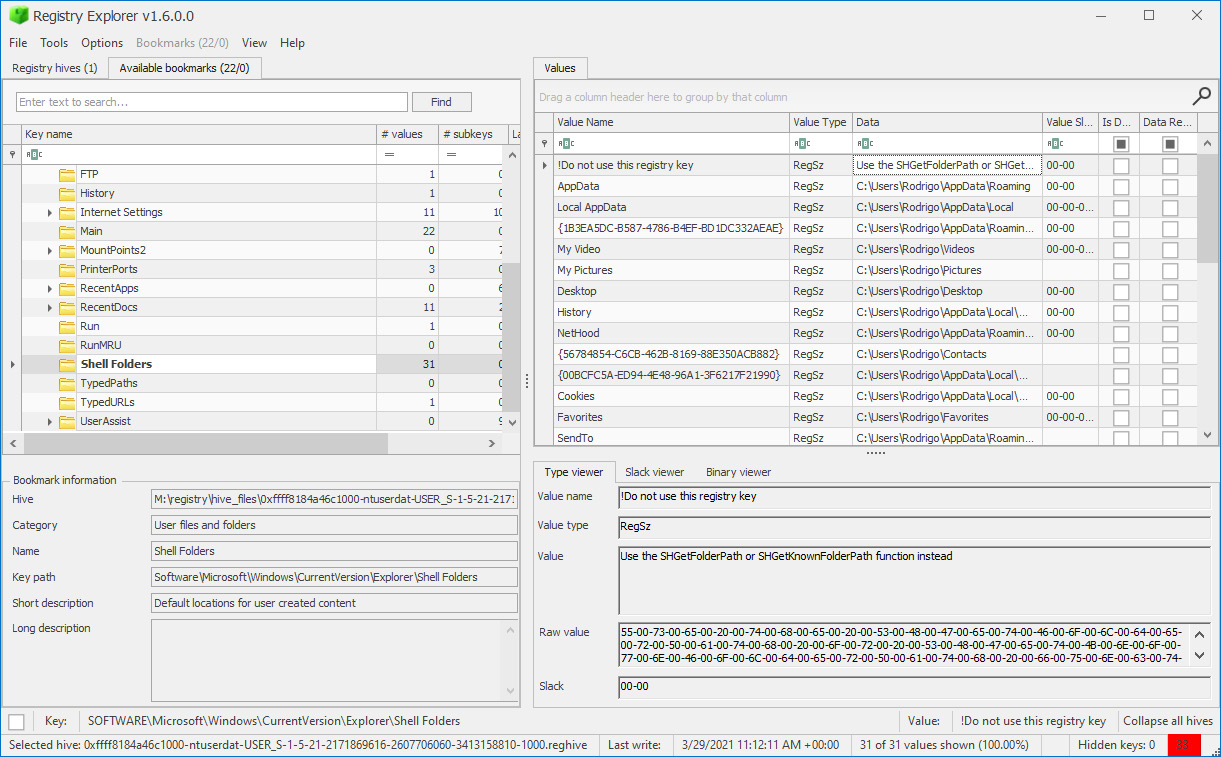
Figure 4.41 – Registry Explorer
On the other hand, you can parse these files with RegRipper. By doing this, all the information will be available to you as a single text file. This tool can be downloaded from the following GitHub repository: https://github.com/keydet89/RegRipper3.0.
To run the GUI tool, you need to use the rr.exe file. In the window that appears, you need to specify the path to the file you want to process and the path to the text file where you want to save the result of the execution. Once all the fields have been filled in, you need to click the Rip! button. For example, let's take the file containing the name ntuser from our hive_files folder, copy it to a convenient location, and try to analyze it.
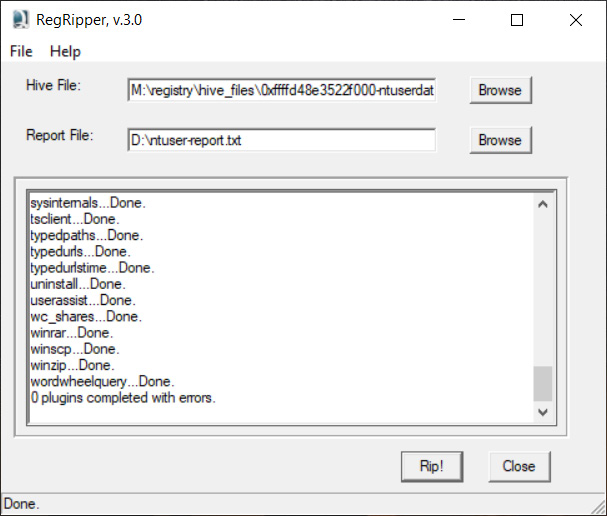
Figure 4.42 – RegRipper
As a result, you will get two text files. The first one, with the.log extension, is the log of the program. The second one, with the.txt extension, contains the parsing results. You can open it in any text editor and use a keyword search. For example, to find programs run by a user, you can search for userassist.
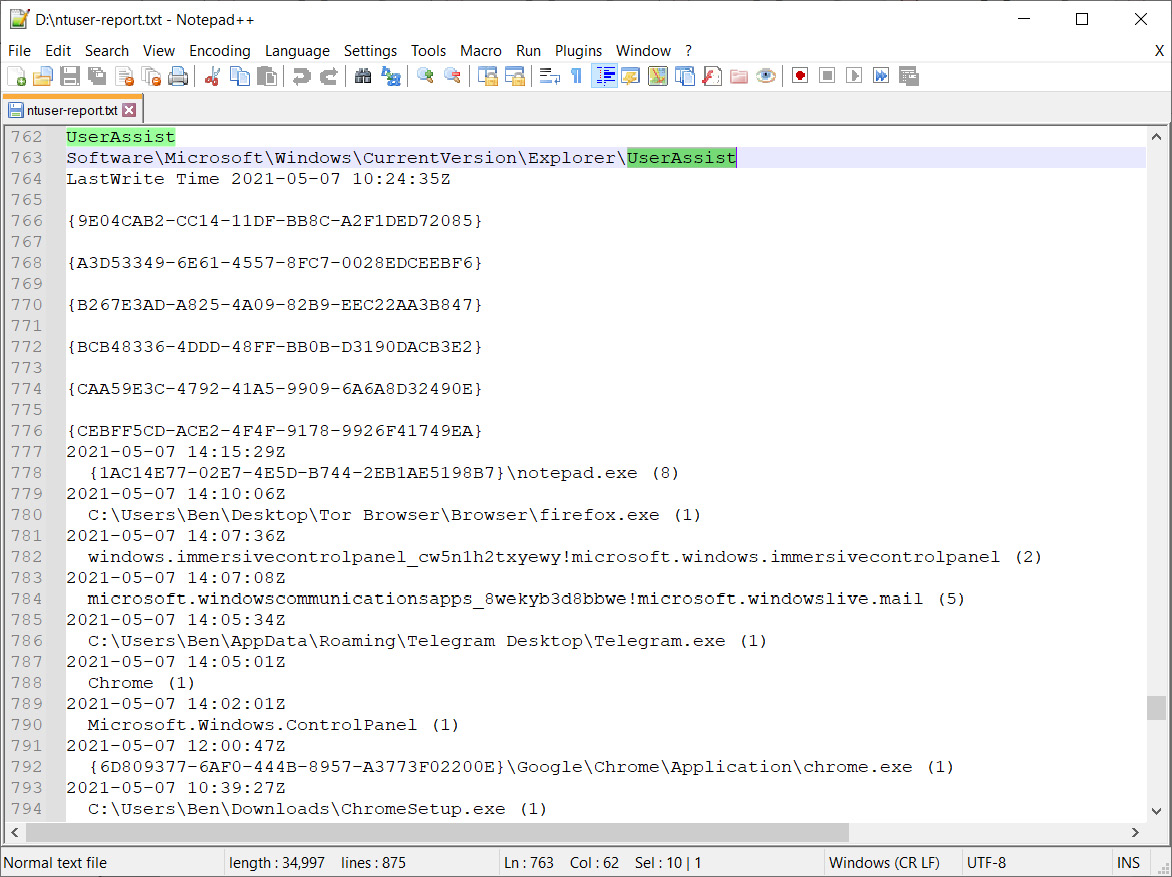
Figure 4.43 – Userassist registry key
If you want to see what documents the user has recently worked with, look for opensave or recentdocs.
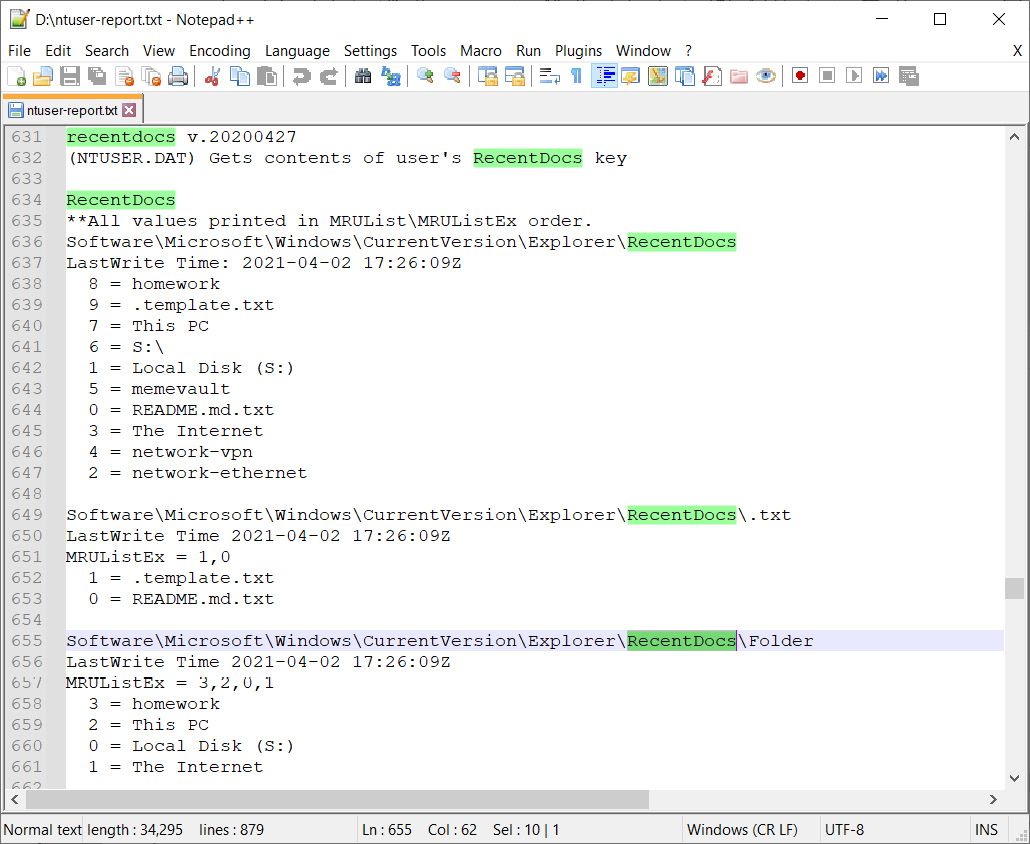
Figure 4.44 – RecentDocs registry key
Finally, if you want to see what directories were visited by a user on a local or remote host, download ShellbagsExplorer from the respective GitHub repository (https://ericzimmerman.github.io/#!index.md). Find the usrclass registry file in the hive_files folder and drop it into the running tool. You should get the following output:
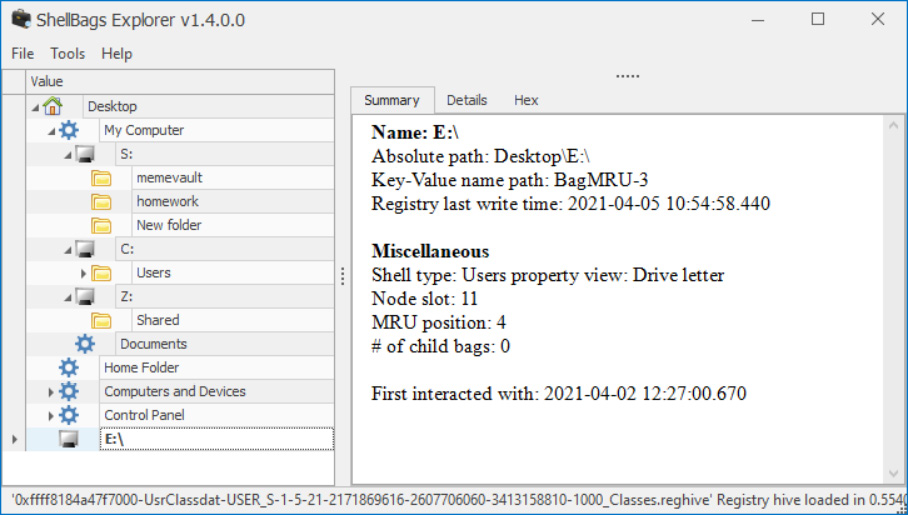
Figure 4.45 – ShellBags Explorer
Note that this file is derived from the memory dump, where we found traces of the S drive encrypted by TrueCrypt. Thanks to our analysis of the usrclass file, we can see some of the contents of the encrypted disk.
Summary
Analyzing user activity is a very important part of investigating memory. In this chapter, you learned that you can recover a lot of artifacts. This can be extremely valuable in criminal investigations as such artifacts can help you reconstruct a user's activity, even if they used anonymous web browsers or secure messengers.
Volatility is a great tool for memory dump analysis, but do not get hung up on it. Do not be afraid to use additional tools or alternative solutions in situations where you need to.
Despite the abundance of information in process memory, do not forget about the virtual registry, which stores a lot of useful information, including that related to user activity. Additionally, some registry keys can tell us a lot about malware activity and persistence traces. We will discuss these and other traces of malicious activity in the next chapter.