
Chapter 2: Acquisition Process
Memory acquisition is usually referred to as the process of copying the contents of volatile memory to a non-volatile storage device for preservation. To have a good understanding of the process, the investigator needs to know at least some memory management principles, understand how tools for memory extraction work, and be able to choose the most appropriate tool and use it correctly. In addition, it is important to understand that creating full memory dumps is not always the only solution. There is live memory analysis, which also has its advantages and, in some cases, may be preferable to memory acquisition.
In this chapter, you'll learn about the following:
- Introducing memory management concepts
- What's live memory analysis?
- Understanding partial versus full memory acquisition
- Exploring popular acquisition tools and techniques
Introducing memory management concepts
There are several concepts related to the organization and management of random-access memory (RAM). Understanding these concepts will allow you to make the memory investigation process more conscious and effective. Let's start with the address space.
Address space
RAM is an array of memory cells, each with its own physical address used to access that cell. However, processes do not have direct access to physical memory. This is because processes can easily harm the operating system and even cause it to crash completely when interacting with physical memory. Moreover, the use of physical addresses by processes makes it difficult to organize the simultaneous execution of programs. To solve these problems, an abstraction known as address space was created.
An address space is a set of addresses that can be used to access memory. Each process has its own isolated address space, which solves the problem of security and isolation of processes from each other and from the operating system. But what if there is not enough physical memory to contain all the code and data of the running processes?
Here we come to the next abstraction.
Virtual memory
Virtual memory is an abstraction designed to separate the logical memory that processes work with from physical memory. The basic idea is that each process has its own virtual address space. The size of this space depends on the hardware architecture. By default, on x86 systems, each process is allocated 4 GB of memory, with the lower 2 GB allocated for user space and the upper 2 GB for kernel space. As a result, each process thinks that it has its own memory space from 0x00000000 to 0x7FFFFFFFF, as depicted in the following diagram:

Figure 2.1 – Default allocation of kernel and user space on x86 systems
Splitting in half is standard, but not required. For example, in Windows, there is an option to use a 3:1 split, where 3 GB belongs to user space.
In the x64 architecture, a greater amount of memory can be allocated to processes. In this case, user space occupies addresses 0x0000000000000000 to 0x000007ffffffffffffff, and kernel space begins with address 0xffffff08000000000000.
Paging
The entire process address space is divided into blocks of fixed size. Such blocks are called pages and represent a continuous range of addresses. It is these pages that are mapped to physical memory.
The memory manager is responsible for unloading pages and freeing physical memory. The memory manager also translates virtual addresses into physical addresses with the help of hardware.
So, the process accesses the memory using a virtual address from its address space, and the operating system translates this address into a physical address to retrieve the necessary data from the memory.
The following diagram captures paging visually:
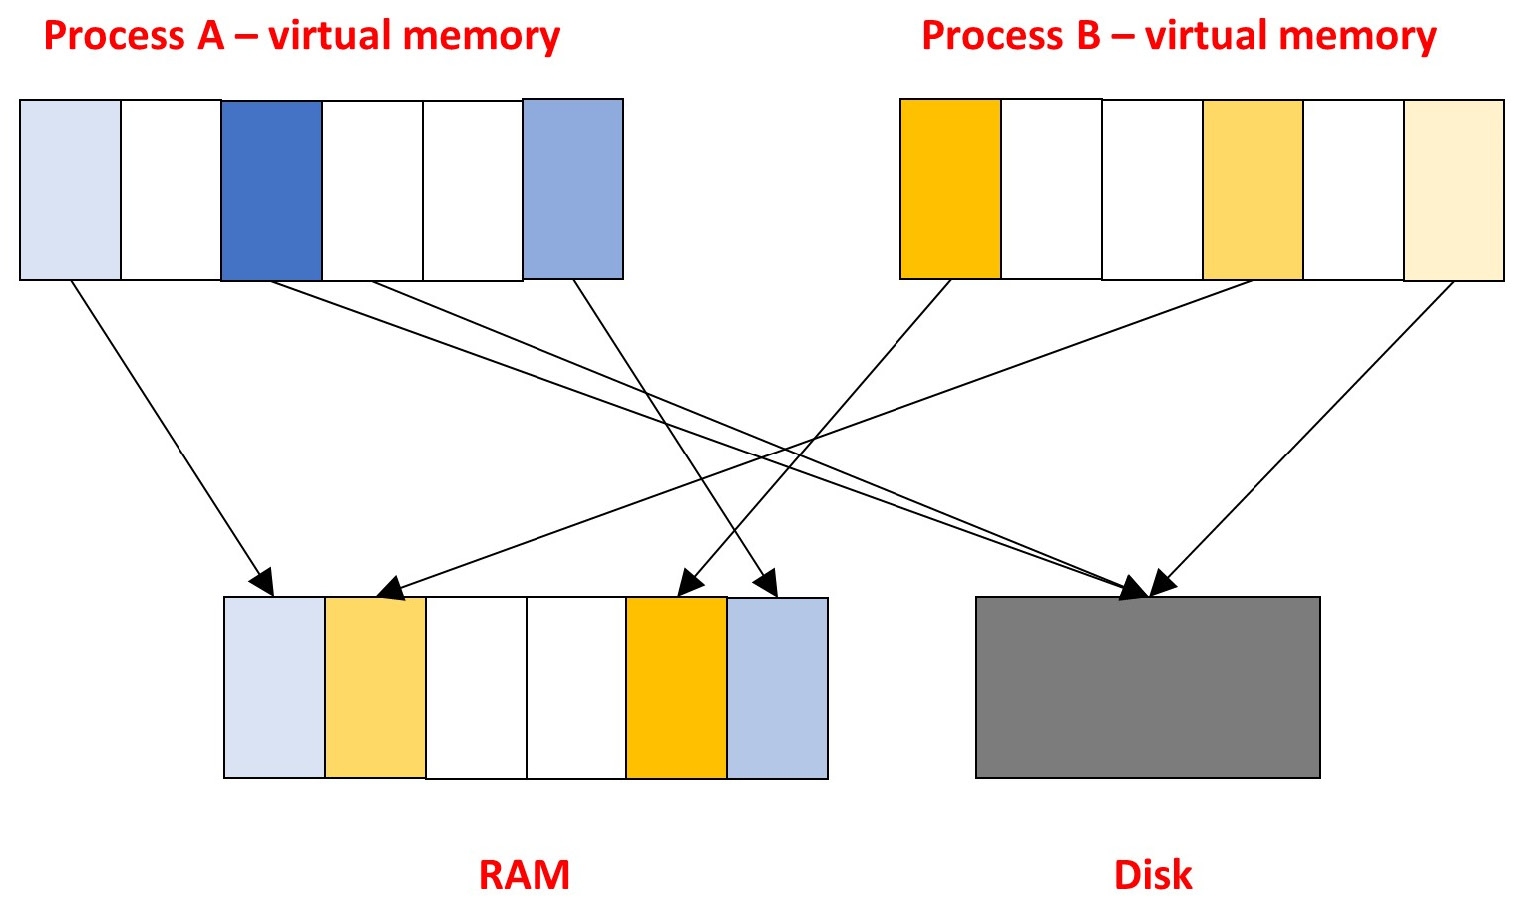
Figure 2.2 – Illustration of the paging concept
This approach allows us to load into physical memory only those pages that are necessary for the correct operation of the program at a particular time. The remaining pages are stored on disk waiting to be loaded.
The mechanism that determines which process memory pages should be in physical memory and which should remain on disk is called paging. There are many page replacement algorithms (FIFO, LRU, Clock, WSClock, and so on). All of them have the same purpose: to improve stability and performance.
To store unused memory pages, a separate file (pagefile, swapfile) or a special partition on disk (swap) is used, depending on the operating system. Thus, during memory dump creation we obtain only the contents of the pages loaded into RAM. At the same time, part of the pages that contain information important for the investigator may be located on disk. To get a complete picture, it is recommended to combine analysis of memory dumps with analysis of non-memory-resident data.
Shared memory
As mentioned before, each process has its own isolated address space, but there are exceptions. Developers are always looking to improve performance, increase efficiency, and reduce resource consumption, and memory is not spared. The result is shared memory.
Shared memory is an area of memory available to several processes at the same time. There are a few uses for this mechanism. First, processes that have access to the same memory space can use it to exchange data or to run the same pieces of code. Secondly, this mechanism improves the effectiveness of using libraries. For example, if there are several processes using the same dynamic library, it is simpler to put one instance of the library in physical memory and map the virtual memory pages of all the processes that need it to that instance.
Stack and heap
Each process contains both static and dynamic data. Static data is placed in the associated regions of a process's virtual address space. Dynamic data is usually stored in memory regions called the stack and heap. For a better understanding of these concepts, here is an illustration of a process' virtual memory:

Figure 2.3 – Illustration of a process' virtual memory
The stack stores data directly related to the executable code. If a function is called during program execution, a separate stack frame is allocated for it. The parameters of the called function, its variables, and the return address are placed in it. The stack frame data exists only within the limits of execution of the given function; nevertheless, the contents of this region can tell the investigator what functions were executed by the process at the particular moment.
Unlike a stack, data in a heap is stored for the lifetime of a process, which is extremely important for a digital forensic specialist. Moreover, it stores dynamically allocated data, such as text typed in a text editor, a clipboard that can contain a password, or the content of a chat of a running messenger.
We have broken down the basic concepts, which we will refer to in the following chapters. Now it is time to move on to the next stop, live analysis.
What's live memory analysis?
There are several situations where it is impossible to create a memory dump. We already discussed these situations in Chapter 1, Why Memory Forensics?. Also, memory extraction may become inefficient for remote systems or systems with more than 32 GB of RAM. In such cases, you can use live memory analysis for manual examination of running processes, their memory contents, network connections, and the current system state.
Important Note
Keep in mind that you will often need a user with administrator rights to perform live analysis. If a threat actor has access to the target system and uses credential carving tools, then logging in as a privileged user simply gives away your credentials.
Windows
To perform live memory analysis on Windows hosts, there is a wide list of various tools, from built-in to advanced forensic frameworks. Also, many EDR/XDR solutions nowadays allow incident responders to perform live memory analysis.
Let's look at one very common live analysis tool known as Process Hacker, as shown in the following screenshot:

Figure 2.4 – Process Hacker Processes tab
Process Hacker allows you to get the following information:
- List of running processes
- Services launched
- Active network connections
- Disk usage
In addition, double-clicking on a running process takes you to the process memory. There you can find information about resources used, view the address space of the process, including stack and heap, and even search for specific data there using regular expressions.
Such an approach may be very useful when you already know what to look for. For example, you know that a piece of malware injects the payload to explorer.exe (Windows Explorer). Usually, there aren't many instances of explorer.exe; what's more, it shouldn't normally perform network connections. So, using tools such as Process Hacker and a bit of cyber threat intelligence, you can easily spot rogue processes.
As was mentioned previously, there are built-in tools such as the Windows command shell, PowerShell, or Windows Management Instrumentation (WMI). These tools provide a wide range of functionality that helps you get a list of active processes, the resources they use, the contents of their memory, active network connections, and so on.
Let's look at the following command:
C:WINDOWSsystem32> wmic process list full
CommandLine=powershell.exe -nop -w hidden -enc SQBmACg<edited>
CSName=DESKTOP-1J4LKT5
Description=powershell.exe
ExecutablePath=C:WINDOWSSystem32WindowsPowerShellv1.0powershell.exe
The command, prints a list of all active processes, including their command line and the path to the executable file via wmic (the WMI command-line utility).
Linux and macOS
For systems running Linux and macOS, the method described previously also works. Both Apple Terminal and Linux Terminal allow you to view information about network connections, resources used, or processes running, as shown in the following screenshot:

Figure 2.5 – List of active processes on a Linux-based system
Despite the convenience and quickness of live analysis, it has its disadvantages. Examining live systems does not allow you to see information about terminated processes and closed network connections, limits interaction with kernel objects, and, among other things, can lead to the erasure of important traces, because any interaction with the target system leads to changes in memory.
It is also worth noting that the contents of memory are constantly changing and during a live analysis it is easy to lose sight of something, which is why it will never be superfluous to make a dump when it is possible. We will consider this in the next part.
Understanding partial versus full memory acquisition
We have determined that working with memory dumps has certain advantages. The only remaining question is what to dump. There are a few tools that allow you to create dumps of specific processes on Windows systems. One such tool is ProcDump, which is a part of Sysinternals Suite.
The following screenshot shows an example of creating a full process dump of the Telegram messenger using ProcDump:

Figure 2.6 – Memory dump of the Telegram process
In Figure 2.6, ProcDump also has an analog for Linux-like systems, which provides a convenient way to create core dumps of Linux applications. Similarly, it is possible to create process dumps on macOS using GDB (GNU Debugger), but it is a more complicated task because it requires direct specification of memory addresses to create dumps.
Dumps of individual processes can be analyzed later using the debugger. The following screenshot shows a dump of the Telegram process opened in WinDbg:

Figure 2.7 – Dump of the Telegram process opened in WinDbg
Such analysis techniques are applicable, for example, as part of incident response, when you need to quickly extract certain data from memory, such as IP addresses or executable code. However, if you need to perform a full-scale investigation, extract user data or encryption keys, or build a RAM-based timeline, you will need to create a full memory dump. That is what we are going to talk about next.
Exploring popular acquisition tools and techniques
The creation of a memory dump is not a trivial task and depends on several factors. We will discuss all of them individually in this part of the chapter.
Virtual or physical
The environment plays an important role in the process of dump creation. This is due to the fact that no additional tools are required to dump virtual machine memory.
In fact, the contents of the virtual machine's memory are partially or completely placed in a file with a certain extension, so getting a dump is reduced to getting that exact file. The following screenshot shows the basic virtualization tools and files used to store virtual machine memory:

Figure 2.8 – Virtualization tools and files containing memory-related data
An important criterion in obtaining virtual machine memory is its state. It is necessary to understand that if the virtual machine is running, the contents of the memory are constantly changing. Therefore, there are two possible solutions:
- Suspend: The virtual machine's memory in the stable state will be saved to disk. However, some solutions perform a few processes before suspending a virtual machine that may cause important data to be lost. For example, VMware closes all active network connections before the virtual machine enters the suspended state.
- Create a snapshot: When creating a snapshot, the current state of the virtual machine and its memory are written to separate files without any changes.
Thus, creating a snapshot to retrieve virtual machine RAM is more preferable in terms of saving the original data. Further work with virtual machine files will depend on the specific vendor and the format in which the memory is saved.
Local or remote
If our target system is bare metal, we cannot avoid additional tools for creating memory dumps. In this case, physical access to the host plays a key role.
In today's world, it is not uncommon to have to collect data from target systems remotely. The following plan can be used to create memory dumps remotely in the simplest case:
- Create a temporary user with administrator privileges, as this will help you to prevent attackers from stealing the credentials of the privileged user.
- Create a network share ($C or $ADMIN) and copy the tool needed to create the dump.
- Use any remote-control tool, service creation, or task scheduling to run your tool and then send a dump to the network share via back-connect.
- Delete the temporary administrator account.
Important Note
Make sure to calculate the checksum of the dump file before and after it is sent over the network to check its integrity.
If physical access to the host is available, the first question we need to solve is where to store the data. It is highly discouraged to save the memory dump on the target system, as it may cause overwriting forensically significant data on the disk. To write the dumps, you should use removable devices prepared in advance. Using the same device to work with several suspected infected hosts, as well as the direct connection of the device to the investigator's computer, is not desirable. This is because there is malware (mostly used for attacks on the energy sector, for example, USBferry, Crimson.USBWorm, or USBCulprit) that uses removable devices for self-distribution and data transfer. In such a situation, it is better to connect the device to an intermediate host, from where all necessary data will be sent to the investigator's host, for instance, over the network.
Both hardware and software solutions can be used to create memory dumps if the target system is physically accessible.
One hardware solution is to use Direct Memory Access (DMA), such as FireWire. It should be noted right away that hardware solutions have a number of limitations (for instance, starting with Windows 10 and macOS 10.7.2, DMA is disabled for locked systems) and often require additional drivers, which is not a benefit at all.
It is a completely different story with software solutions. There are a huge number of both free and commercial tools on the market that allow you to create memory dumps of different formats. In general, most tools work in a quite similar way. When dumping, the kernel module is loaded, which maps physical addresses to the process' virtual address space, from which the data is written to the file. It is important to note that there is such a thing as device memory. Device memory is a part of the physical memory, which is reserved for use by the firmware. Attempting to access this part of memory can end unpredictably. That is why most modern tools are designed to skip device memory regions.
How to choose
The obvious question with such a huge selection of tools is how to choose the most appropriate one. This question is quite individual. We just want to cite a few factors that should be considered when choosing a tool:
- Supported operating system and hardware architecture
- Remote dumping capability
- Impact on the target system
- Reliability
The first two factors are situational – depending on the circumstances in which you have to take the dump, you may be suited to certain tools. The last two factors are more general. Regardless of the context, we always try to minimize the impact on the target system. As for reliability, it is necessary to say that you should never use a tool that you have not worked with and tested before on the target system, because it can behave unpredictably. Therefore, it is recommended to test the tool under the same conditions before creating a memory dump of the target.
It's time
The only thing left for us to figure out is at what point in time it is best to take the dump. Naturally, the moment when the dump is created largely determines its content. Let's think back to the two major cases we discussed in Chapter 1, Why Memory Forensics?:
- The alleged victim's device: In this case, we are most likely to want to create a memory dump when the attacker is not visibly active. This will help us avoid external tampering with the dumping process.
- The suspect's device: The situation here is the opposite, as it is important to find evidence of illegal activity by the owner of the device. Based on this, it is best to take a memory dump when there is any activity on the host of interest.
A general recommendation regarding the time of dumping is to choose a time other than startup, shutdown, reboot, system update, and other periods of increased activity.
Summary
A basic understanding of memory structure and memory management concepts is key to an intelligent and effective investigation process.
In some situations, creating memory dumps can be complicated or simply inefficient. In this case, live memory analysis comes to the rescue, allowing you to get basic information about the current state of the target system.
Another alternative to creating complete memory dumps is extracting the memory of individual processes. This can be useful as part of an incident response but does not provide a complete picture and greatly limits the investigator's capabilities.
Creating memory dumps is a tricky process, depending on multiple factors. To successfully create a dump, the examiner should consider various nuances, including the digital environment, the need for remote data extraction, the reliability of the tools used, and the time of dump creation.
In the following chapters, we will take a closer look at the tools needed to create memory dumps on different operating systems and try them out in practice.