
3
Getting Started – Which Build Information Is Available to Me?
As a managed service, Cloud Build allows individuals and organizations to focus on the steps in the build pipeline. Even though it’s managed, it’s good to understand what happens after a build is started and which resources may be available to track status and view progress via logs through automated means or a graphical user interface (GUI) such as the Google Cloud console.
In this chapter, we will cover the following topics:
- How your build resources are accessed
- Build submission and status
- Using the Google Cloud Platform (GCP) console
- Build operations
Technical requirements
- Software build concepts and tools
- GCP console familiarity
How your build resources are accessed
In order to create reproducible and consistent builds, the files and resources used during a build should be referenceable. The quickest and easiest way is when a source control management (SCM) tool is used, it can be referenced by a commit tag that is immutable. This allows us to essentially get a snapshot of the files used during a build so that if it were needed to be run again, we have at least a constant in place.
Cloud Build needs a way to fetch the build files, and this can be from the SCM tool. However, what if the build files are located on the filesystem and the build was initiated by the gcloud command-line interface (CLI) command? In this situation, gcloud will package up the files in the specified folder, along with subfolders if present. The files are packaged in a tarball (gzipped archive) and uploaded to Google Cloud Storage (GCS). Cloud Build will then fetch the packaged files from GCS and begin the build.
The gcloud command also gives users the flexibility to determine which files should be included in a build, through a .gcloudignore file that uses the same syntax as gitignore (https://git-scm.com/docs/gitignore). If a .gcloudignore file is not created, gcloud is able to generate one based on a .gitignore file in the top-level folder.
Whether it’s through an SCM that can provide a snapshot of files or snapshots packaged by gcloud and uploaded to GCS, we will always have a reference point for each build that is run. As noted earlier, this is very important for tracing back what was included in a build for auditing and debugging purposes. The Cloud Build gcloud command also allows users to specify a gzipped archive manually if they have some local build automation.
Build submission and status
Cloud Build as a managed service provides multiple methods to initiate a build to enable maximum flexibility. For instance, it can be triggered in the following ways:
- Manually
- Automated through other tools
- Messages published to Publish/Subscribe (Pub/Sub)
- On a schedule
- Changes pushed to the SCM system
A trigger is a mechanism in Cloud Build to start a build pipeline; for instance, this can be a change to source code in an SCM system or an event from another system. Triggers will be covered in more depth in Chapter 5, Triggering Builds.
Note
The commands and output in this chapter are for illustrative purposes to describe capability as well as analysis of the output where applicable. Some of these commands may require prerequisites to be configured in order to execute properly.
First, we start off with a simple cloudbuild.yaml file with two steps that build a Docker image and push it to Artifact Registry. The following example is a simplified version of the cloudbuild.yaml file. A snippet can be found here: https://github.com/GoogleCloudPlatform/cloud-build-samples/blob/main/basic-config/cloudbuild.yaml. Please note the contents in GitHub may change over time:
  # Docker Build
  - name: 'gcr.io/cloud-builders/docker'
    args: ['build', '-t',
           'us-central1-docker.pkg.dev/${PROJECT_ID}/image-repo/myimage',
           '.']

  # Docker Push
  - name: 'gcr.io/cloud-builders/docker'
    args: ['push',
           'us-central1-docker.pkg.dev/${PROJECT_ID}/image-repo/myimage']
In this chapter, we will be focusing on manual methods, as other automated mechanisms will be covered in later chapters. To get us started, the quickest way to initiate a build is through the gcloud CLI tool. Cloud Build, as a managed service providing an automation platform, is able to abstract out the need for managing resources and infrastructure for the build to execute. As noted in Chapter 2, Configuring Cloud Build Workers, private pools would require some additional configuration, but the steps in the configuration largely remain the same. The following command will submit a build and include the contents of the current path and subpaths:
$ gcloud builds submit
Here is a sample output of the preceding command:
[1] Creating temporary tarball archive of 2 file(s) totalling 952 bytes before compression.
Uploading tarball of [.] to [gs://##project-id_redacted##_cloudbuild/source/1641339906.759161-f251af6f4c9745438a4730c3c6f94cd0.tgz]
[2] Created [https://cloudbuild.googleapis.com/v1/projects/##project-id_redacted##/locations/global/builds/ca6fd20f-7da3-447e-a213-7b542f9edb5c].
[3] Logs are available at [https://console.cloud.google.com/cloud-build/builds/ca6fd20f-7da3-447e-a213-7b542f9edb5c?project=##project-number_redacted##].
----------------------------------------------- REMOTE BUILD OUTPUT ------------------------------------------------
starting build "ca6fd20f-7da3-447e-a213-7b542f9edb5c"

FETCHSOURCE
[4] Fetching storage object: gs://##project-id_redacted##_cloudbuild/source/1641339906.759161-f251af6f4c9745438a4730c3c6f94cd0.tgz#1641339907144359
Copying gs://##project-id_redacted##_cloudbuild/source/1641339906.759161-f251af6f4c9745438a4730c3c6f94cd0.tgz#1641339907144359...
/ [1 files][  695.0 B/  695.0 B]
Operation completed over 1 objects/695.0 B.
BUILD
[5] Starting Step #0
...
Step #0: Successfully tagged us-central1-docker.pkg.dev/##project-id_redacted##/image-repo/myimage:latest
Finished Step #0
Starting Step #1
Step #1: Already have image (with digest): gcr.io/cloud-builders/docker
...
Finished Step #1
PUSH
DONE
--------------------------------------------------------------------------------------------------------------------
ID: ca6fd20f-7da3-447e-a213-7b542f9edb5c
CREATE_TIME: 2022-01-04T23:45:07+00:00
DURATION: 9S
SOURCE: gs://##project-id_redacted##_cloudbuild/source/1641339906.759161-f251af6f4c9745438a4730c3c6f94cd0.tgz
IMAGES: -
[6] STATUS: SUCCESS
The preceding output is now outlined in further detail (note that the preceding numbers are added for illustration purposes; they are not in the command output):
[1] The output where a temporary tarball archive was created and then uploaded to GCS. This serves two purposes, as described here:
- Allows for the build files to be fetched by the Cloud Build service
- Provides a snapshot of the build files for auditing and debugging
[2] A Cloud Build globally unique identifier (GUID) uniquely identifying the build is also generated in link form to allow for access to the build from the Google Cloud console UI.
[3] A link to where the build logs can be accessed from the Google Cloud console UI.
[4] Cloud Build fetches the archive uploaded to GCS by gcloud.
[5] The build begins with the first step specified in the cloudbuild.yaml file.
[6] The final status of the build.
When invoking a build manually with the CLI, by default it is performed synchronously, which means that the output of the build is locking on the terminal. The terminal prompt will not be returned until the build finishes successfully or with a failure. If the user chooses to break out of the build (by pressing Ctrl + C), this will also cancel the build. Alternatively, you can pass in the --async option in order to queue the build and return the user to the prompt. The following command will list builds along with their status:
$ gcloud builds list
Here is a sample output of the preceding command:
ID: ca6fd20f-7da3-447e-a213-7b542f9edb5c
CREATE_TIME: 2022-01-04T23:45:07+00:00
DURATION: 9S
SOURCE: gs://##project-id_redacted##_cloudbuild/source/1641339906.759161-f251af6f4c9745438a4730c3c6f94cd0.tgz
IMAGES: -
STATUS: SUCCESS

ID: 2522e42e-c31f-4b7a-98bc-404b441a5f2c
CREATE_TIME: 2022-01-04T23:38:44+00:00
DURATION: 1M50S
SOURCE: gs://##project-id_redacted##_cloudbuild/source/1641339523.810603-97be6bc031b44b83bded5a6b0133e093.tgz
IMAGES: -
STATUS: FAILURE
The preceding sample output provides a brief summary of each build within the project. Using the build ID from either the build submission or the list, we are able to describe the build in detail, as illustrated here:
$ gcloud builds describe ca6fd20f-7da3-447e-a213-7b542f9edb5c
Here is a sample output of the preceding command:
createTime: '2022-01-04T23:45:07.383980674Z'
finishTime: '2022-01-04T23:45:17.496050Z'
id: ca6fd20f-7da3-447e-a213-7b542f9edb5c
logUrl: https://console.cloud.google.com/cloud-build/builds/ca6fd20f-7da3-447e-a213-7b542f9edb5c?project=##project-number_redacted##
logsBucket: gs://##project-number_redacted##.cloudbuild-logs.googleusercontent.com
name: projects/##project-number_redacted##/locations/global/builds/ca6fd20f-7da3-447e-a213-7b542f9edb5c
...
startTime: '2022-01-04T23:45:08.020795233Z'
status: SUCCESS
steps:
- args:
  - build
  - -t
  - us-central1-docker.pkg.dev/##project-id_redacted##/image-repo/myimage
  - .
  name: gcr.io/cloud-builders/docker
  pullTiming:
    endTime: '2022-01-04T23:45:13.814938454Z'
    startTime: '2022-01-04T23:45:13.811085177Z'
  status: SUCCESS
  timing:
    endTime: '2022-01-04T23:45:15.114544455Z'
    startTime: '2022-01-04T23:45:13.811085177Z'
...
timeout: 600s
timing:
  BUILD:
    endTime: '2022-01-04T23:45:17.020766002Z'
    startTime: '2022-01-04T23:45:13.227178424Z'
  FETCHSOURCE:
    endTime: '2022-01-04T23:45:13.227099439Z'
    startTime: '2022-01-04T23:45:08.417349649Z'
The output from the build description provides detail on the build as well as details of each step, such as start and stop time. As part of gcloud, the output can be output in other formats such as JavaScript Object Notation (JSON) for querying and aggregating the output for multiple builds.
There are many ways to interact with Cloud Build. The scenario using gcloud was used in the preceding example to interact with Cloud Build, but there are additional methods as well, as outlined here:
- REpresentational State Transfer (REST) application programming interfaces (API) (https://cloud.google.com/build/docs/api/reference/rest)
- Client libraries (https://cloud.google.com/build/docs/api/reference/libraries)
This will help provide flexibility when trying to integrate with existing tooling, infrastructure, and developer/operator preferences. Cloud Build can be the end-to-end (E2E) pipeline or just be involved in specific steps where desired.
The simplicity of a standard schema for defining pipeline steps across different worker platforms is key to allowing organizations to focus more on their business applications and services, rather than the automation platform itself. Once a build is submitted, it’s also very important to quickly get the status of a build and audit and troubleshoot if necessary. Additional auditing metadata is also available for builds that push Docker images to Artifact Registry. The metadata is known as build provenance, which can contain the source code repository, build steps, and the image path. While it is metadata, it also contains signature data that can be verified against the Cloud Build public key for integrity, and this helps ensure the metadata has not been manipulated. This content will be covered in a later chapter. Just because a service is managed, this doesn’t mean it should be a black box when needing to integrate or solve issues.
Using the GCP console
Interacting with the CLI or APIs is very important for automation, but for certain scenarios, it’s just as important to be able to quickly get a high-level summary in an organized way on a UI. Cloud Build also has UI capabilities to perform some operations instead of interacting with the API.
The Cloud Build summary Dashboard section provides the following information:
- A summary of triggers
- The latest build of the respective trigger
- Build history filtered by the trigger
- The average duration of builds
- The percentage of builds passing and failing, based on the last 20 builds
If a project has a lot of configured triggers or there is a desire to show certain items, the listing of triggers can also be filtered by the following:
- Trigger source
- Trigger name
- Trigger description
A pin may also be placed on triggers that should be shown toward the top of the list. For each trigger, if the build configuration contains a step for approval or rejection, this can also be performed on the Dashboard view on the latest build of a particular trigger, as illustrated in the following screenshot:
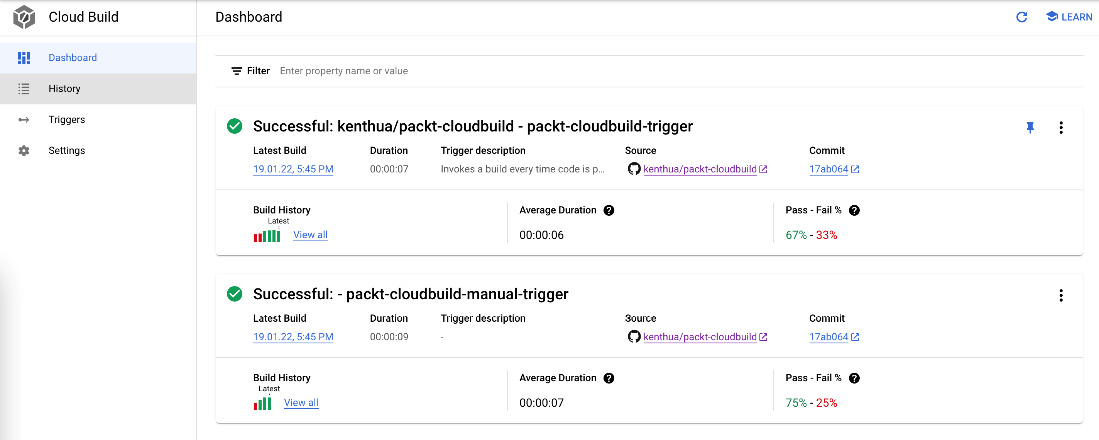
Figure 3.1 – Sample dashboard
A listing of each build may be accessed through the History section, where columns can be customized to show the desired information. Filters can also be used to show only specific builds with specific metadata, as illustrated in the following screenshot:
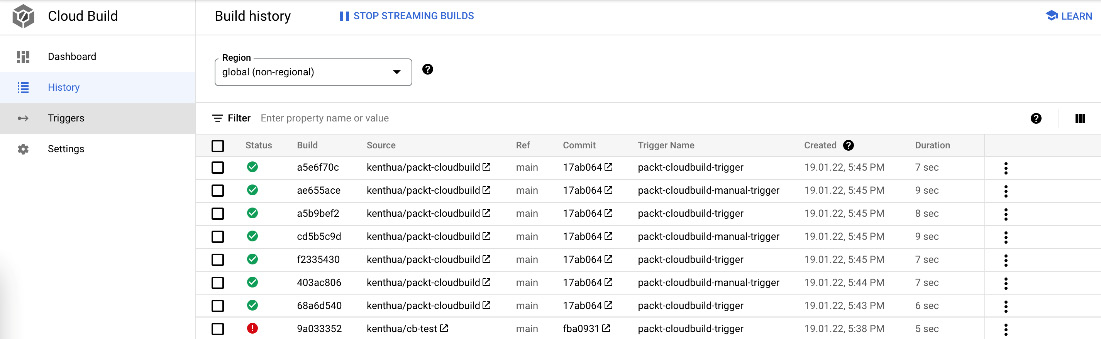
Figure 3.2 – Sample history
Triggers are a critical component for automating builds in Cloud Build. This section of the UI allows for the creation of triggers and setting up SCM repositories that will be utilized by the trigger, as illustrated in the following screenshot:
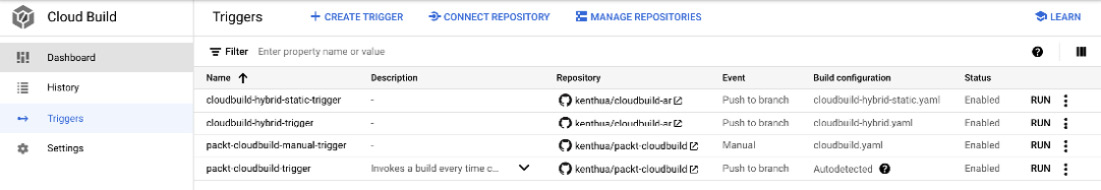
Figure 3.3 – Sample triggers
Cloud Build supports many SCM offerings, from hosted public repositories to private repositories such as GitHub Enterprise. You can see an example of this in the following screenshot:
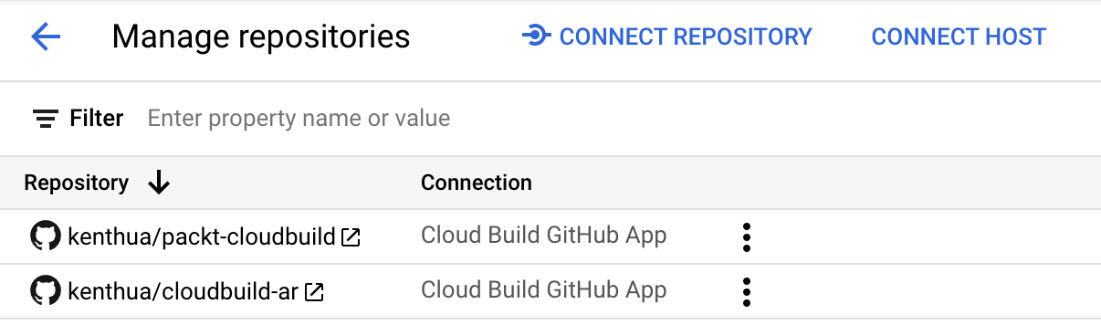
Figure 3.4 – Sample triggers: managing repositories
Additional settings for the Cloud Build managed service allow for permission settings and the management of private pools.
Specific to permissions, Cloud Build utilizes a default service account, and within this view, a user is able to set permissions for specific cloud services, ranging from compute runtimes to secret stores. You can see an example of this in the following screenshot:
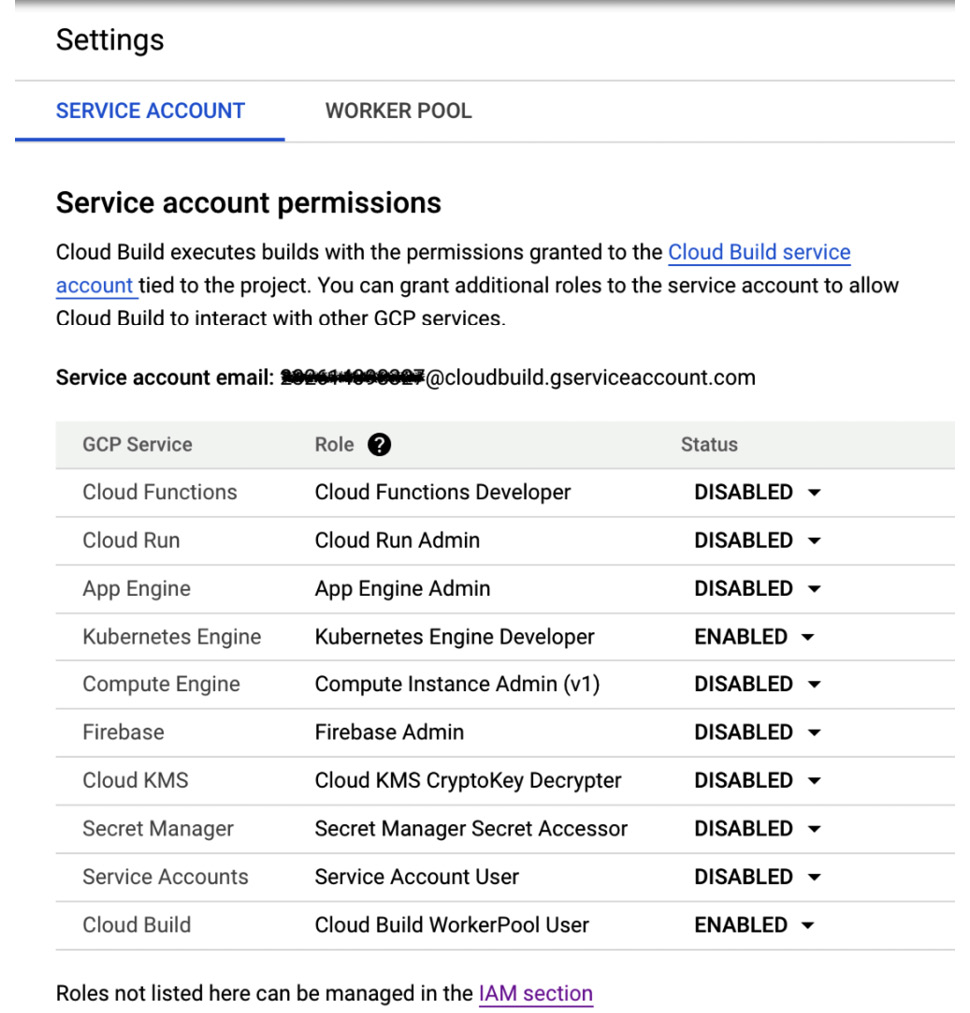
Figure 3.5 – Sample settings: service account
The creation and details of private pools are made available over the UI as well, as illustrated in the following screenshot:
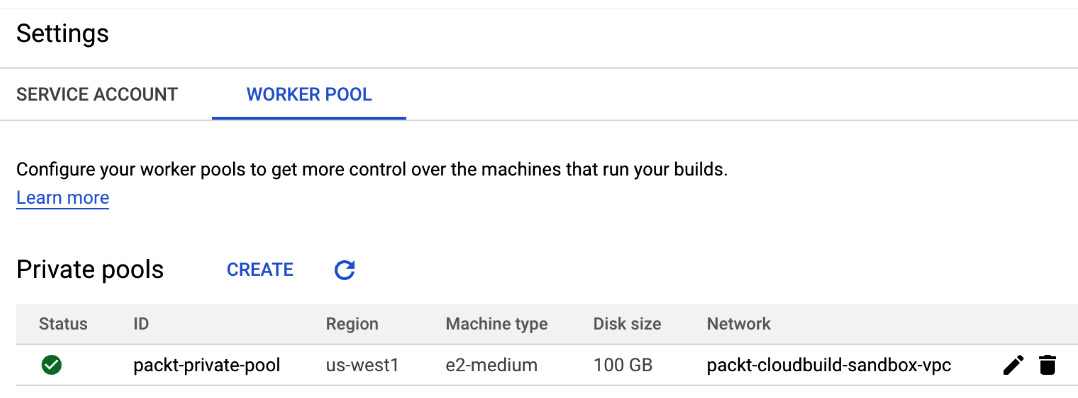
Figure 3.6 – Sample settings: worker pool
The GCP console UI provides another way for users to interact with the Cloud Build managed service. For users just getting started or those that only have a few builds, it may make sense to only integrate with the UI. However, human error and repetition can be reduced by utilizing the CLI and/or API integrations.
Build operations
Congratulations—we’ve submitted a build via the CLI and navigated across the UI for some additional details! Operationally, there are quite a few things we may want to do after a build has been kicked off. A few thoughts come to mind, and these are set out here:
- View the logs
- View the build history
- Rebuild
- View the audit logs
- Build provenance
Let’s get started with how to access the logs of a build that has already been kicked off. We’ll continue the example using gcloud. Leveraging the ID of the build, we are also able to retrieve the logs for the build, like so:
$ gcloud builds log ca6fd20f-7da3-447e-a213-7b542f9edb5c
Here is a sample output of the preceding command:
----------------------------------------------- REMOTE BUILD OUTPUT ------------------------------------------------
starting build "ca6fd20f-7da3-447e-a213-7b542f9edb5c"

FETCHSOURCE
Fetching storage object: gs://##project-id_redacted##_cloudbuild/source/1641339906.759161-f251af6f4c9745438a4730c3c6f94cd0.tgz#1641339907144359
Copying gs://##project-id_redacted##_cloudbuild/source/1641339906.759161-f251af6f4c9745438a4730c3c6f94cd0.tgz#1641339907144359...
/ [1 files][  695.0 B/  695.0 B]
Operation completed over 1 objects/695.0 B.
BUILD
Starting Step #0
Step #0: Already have image (with digest): gcr.io/cloud-builders/docker
Step #0: Sending build context to Docker daemon  3.584kB
Step #0: Step 1/2 : FROM alpine
Step #0: latest: Pulling from library/alpine
Step #0: Digest: sha256:21a3deaa0d32a8057914f36584b5 288d2e5ecc984380bc0118285c70fa8c9300
Step #0: Status: Downloaded newer image for alpine:latest
Step #0:  c059bfaa849c
Step #0: Step 2/2 : CMD ["echo", "Hello World!"]
Step #0:  Running in 35337ee2efec
Step #0: Removing intermediate container 35337ee2efec
Step #0:  1071be434322
Step #0: Successfully built 1071be434322
Step #0: Successfully tagged us-central1-docker.pkg.dev/##project-id_redacted##/image-repo/myimage:latest
Finished Step #0
Starting Step #1
...
Finished Step #1
PUSH
DONE
The log output of each step in the build is helpful for understanding what took place during a build but also for debugging if necessary. Understanding what takes place, in conjunction with details around how long a step takes, can also help drive the optimization of pipeline steps. If a build was initiated asynchronously with the --async option, we can use the --stream option for the log command to be able to view log output as it happens.
Logs can also be viewed using the GCP console UI for Cloud Build, from the build history. For each build, we can see logs for the complete build, as illustrated in the following screenshot:
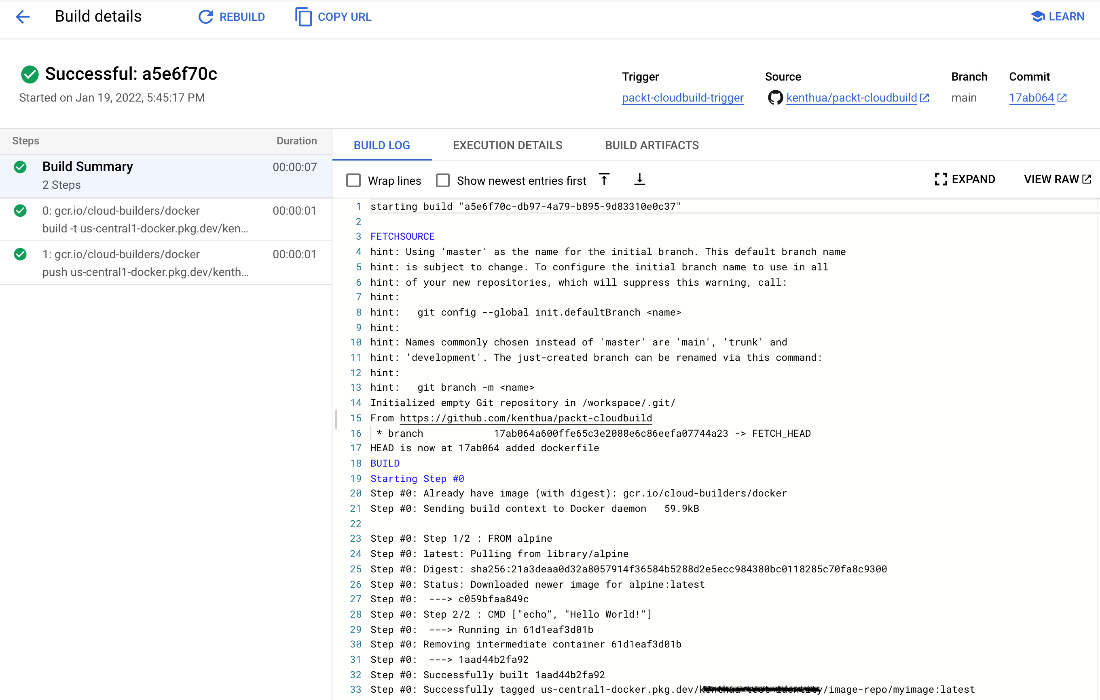
Figure 3.7 – Sample overall build log output via the GCP console UI: Cloud Build view
Logs for a specific build step within the build can be accessed by selecting an individual build step, as illustrated in the following screenshot:
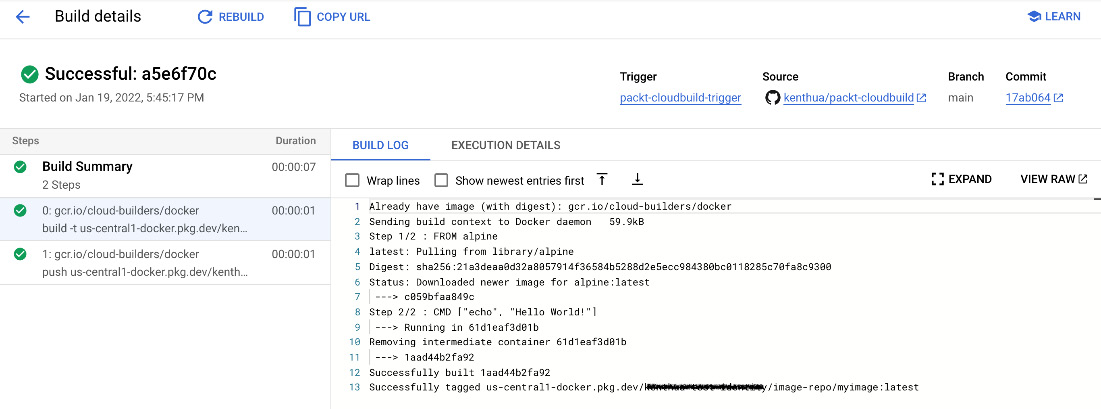
Figure 3.8 – Sample single build step log output via the GCP console UI: Cloud Build view
Raw logs can also be viewed through the GCP console UI Cloud Logging service. Notice in the following screenshot that each log entry consists of a textPayload of log data but also metadata associating the text with the build (such as build_id):
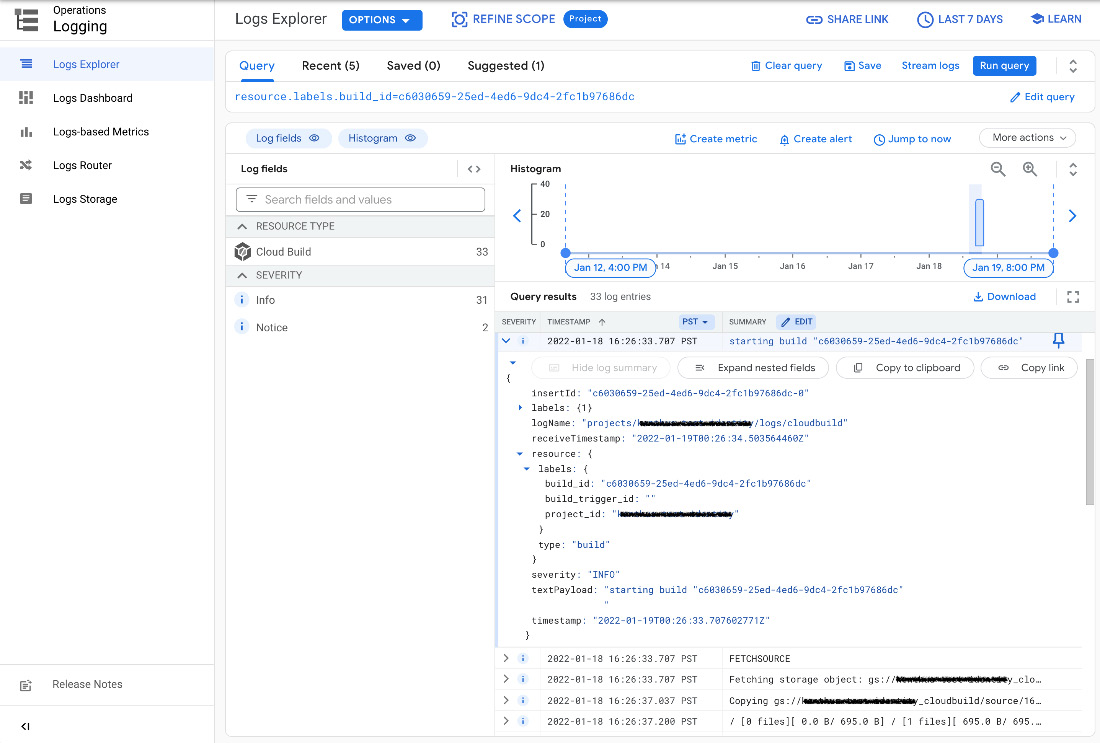
Figure 3.9 – Sample overall build log output via the GCP console UI: Cloud Logging view
Rebuilding is also available through the GCP console UI; it is based on a specific commit or source artifact. Initiating a rebuild will create a new build with a new build ID, using the original source artifacts. If a source artifact causes a build to fail, it’s likely rebuilding will also continue to fail because it’s using the same resources. However, if a build is dependent on an external system during integration testing or separate source files as part of a build, this may cause a build to result in different behavior.
Audit logs are also critical in understanding who performed certain actions on builds, such as creation, approvals, updates, and who accessed build metadata. Audit logs are available through the Cloud Logging service. The Cloud Logging service is available on the GCP console as well as through APIs (for example, REST API; Software Development Kit (SDK); the CLI). Here is an example of using the gcloud tool via the CLI to view audit logs:
$ gcloud logging read "logName:cloudaudit.googleapis.com%2Factivity AND
resource.type=build"
Here is a sample output of the preceding command:
insertId: 166bo1hd1dvc
logName: projects/##project-id_redacted##/logs/cloudaudit.googleapis.com%2Factivity
operation:
  id: operations/build/##project-id_redacted##/YzYwMzA2NTktMjVlZC00ZWQ2LTlkYzQtMmZjMWI5NzY4NmRj
  last: true
  producer: cloudbuild.googleapis.com
protoPayload:
  '@type': type.googleapis.com/google.cloud.audit.AuditLog
  authenticationInfo:
    principalEmail: ##email_redacted##
  authorizationInfo:
  - granted: true
    permission: cloudbuild.builds.create
    resource: projects/00000041cd1ce997
    resourceAttributes: {}
  methodName: google.devtools.cloudbuild.v1.CloudBuild.CreateBuild
  requestMetadata:
    destinationAttributes: {}
    requestAttributes: {}
  resourceName: projects/##project-id_redacted##/builds
  serviceName: cloudbuild.googleapis.com
  status: {}
receiveTimestamp: '2022-01-19T00:26:46.102748864Z'
resource:
  labels:
    build_id: c6030659-25ed-4ed6-9dc4-2fc1b97686dc
    build_trigger_id: ''
    project_id: ##project-id_redacted##
  type: build
severity: NOTICE
timestamp: '2022-01-19T00:26:45.655472495Z'
While the preceding text is output from the CLI, the following screenshot is a representation of audit logs that are accessible with the GCP console UI:
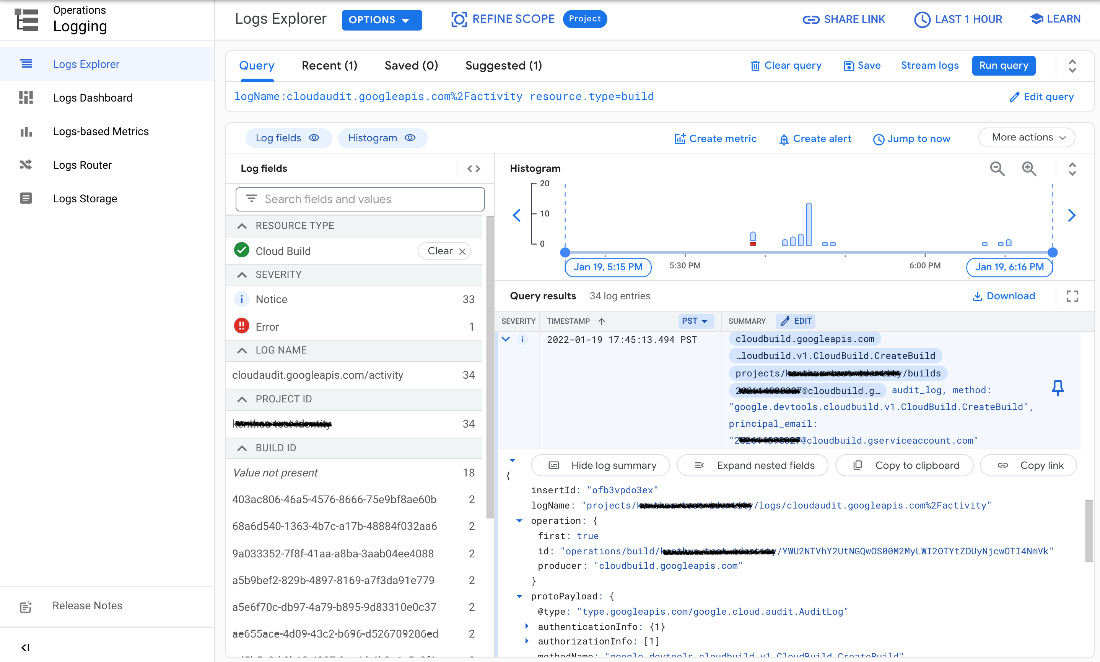
Figure 3.10 – Sample output audit logs through the GCP console
This audit log can be informative, providing different teams such as security, operations, and developers access to who (individual or automated service account) created builds. You can view a list of audited operations available for Cloud Build to gain more insight into how Cloud Build is being utilized at the following link: https://cloud.google.com/build/docs/securing-builds/audit-logs#audited_operations. Build provenance for auditing build information will be covered in Chapter 6, Managing Environment Security.
The gcloud logging read command can also be used to view build logs as well as other GCP services.
Kicking off a build is critical to the use of Cloud Build, but understanding which other operations can be performed or what kind of data is available is just as important.
Summary
Executing a build pipeline can be fairly straightforward once a valid configuration manifest is provided along with some settings for Cloud Build. The managed service takes care of the behind-the-scenes configuration validation, resource provisioning, and execution of the build itself. Given that it’s a managed service, information is made available to provide users the status through various means, whether visually through the GCP console UI or a standard set of APIs.
Stay tuned for the next chapter as we dig into the manifest configuration for Cloud Build.