Chapter 10: Training and Evaluating a Model
In the previous chapter, you familiarized yourself with a multivariate industrial water pump dataset and learned how to configure data with Amazon Lookout for Equipment. You also ingested your dataset in the service and learned about the main errors that can arise during this step.
In this chapter, you will use the datasets you prepared and ingested previously to train a multivariate anomaly detection model. You will learn how to configure your model training and the impact each parameter can have on your results. You will also develop an understanding of the key drivers that can increase your training duration. At the end of this chapter, we will walk through the evaluation and diagnostics dashboard to give you the right perspective about the quality of the outputs.
In this chapter, we're going to cover the following main topics:
- Using your dataset to train a model
- Organizing your models
- Choosing a good data split
- Evaluating a trained model
Technical requirements
No hands-on experience with a language such as Python or R is necessary to follow this chapter's content. However, we highly recommend that you read this chapter while connected to your AWS account and open the Amazon Lookout for Equipment console to run the different actions on your end.
To create an AWS account and log into the Amazon Lookout for Equipment console, you can refer to the Technical requirements section of Chapter 2, An Overview of Amazon Forecast.
Using your dataset to train a model
In the previous chapter, you created an Amazon Lookout for Equipment dataset and ingested your first time series dataset in it. You are now ready to train an anomaly detection model.
Training an anomaly detection model
To train an anomaly detection model with Amazon Lookout for Equipment, follow these steps:
- Log into your AWS console and search for Lookout for Equipment in the search bar at the top.
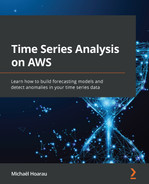
- Click on Amazon Lookout for Equipment to go to the service's home page:
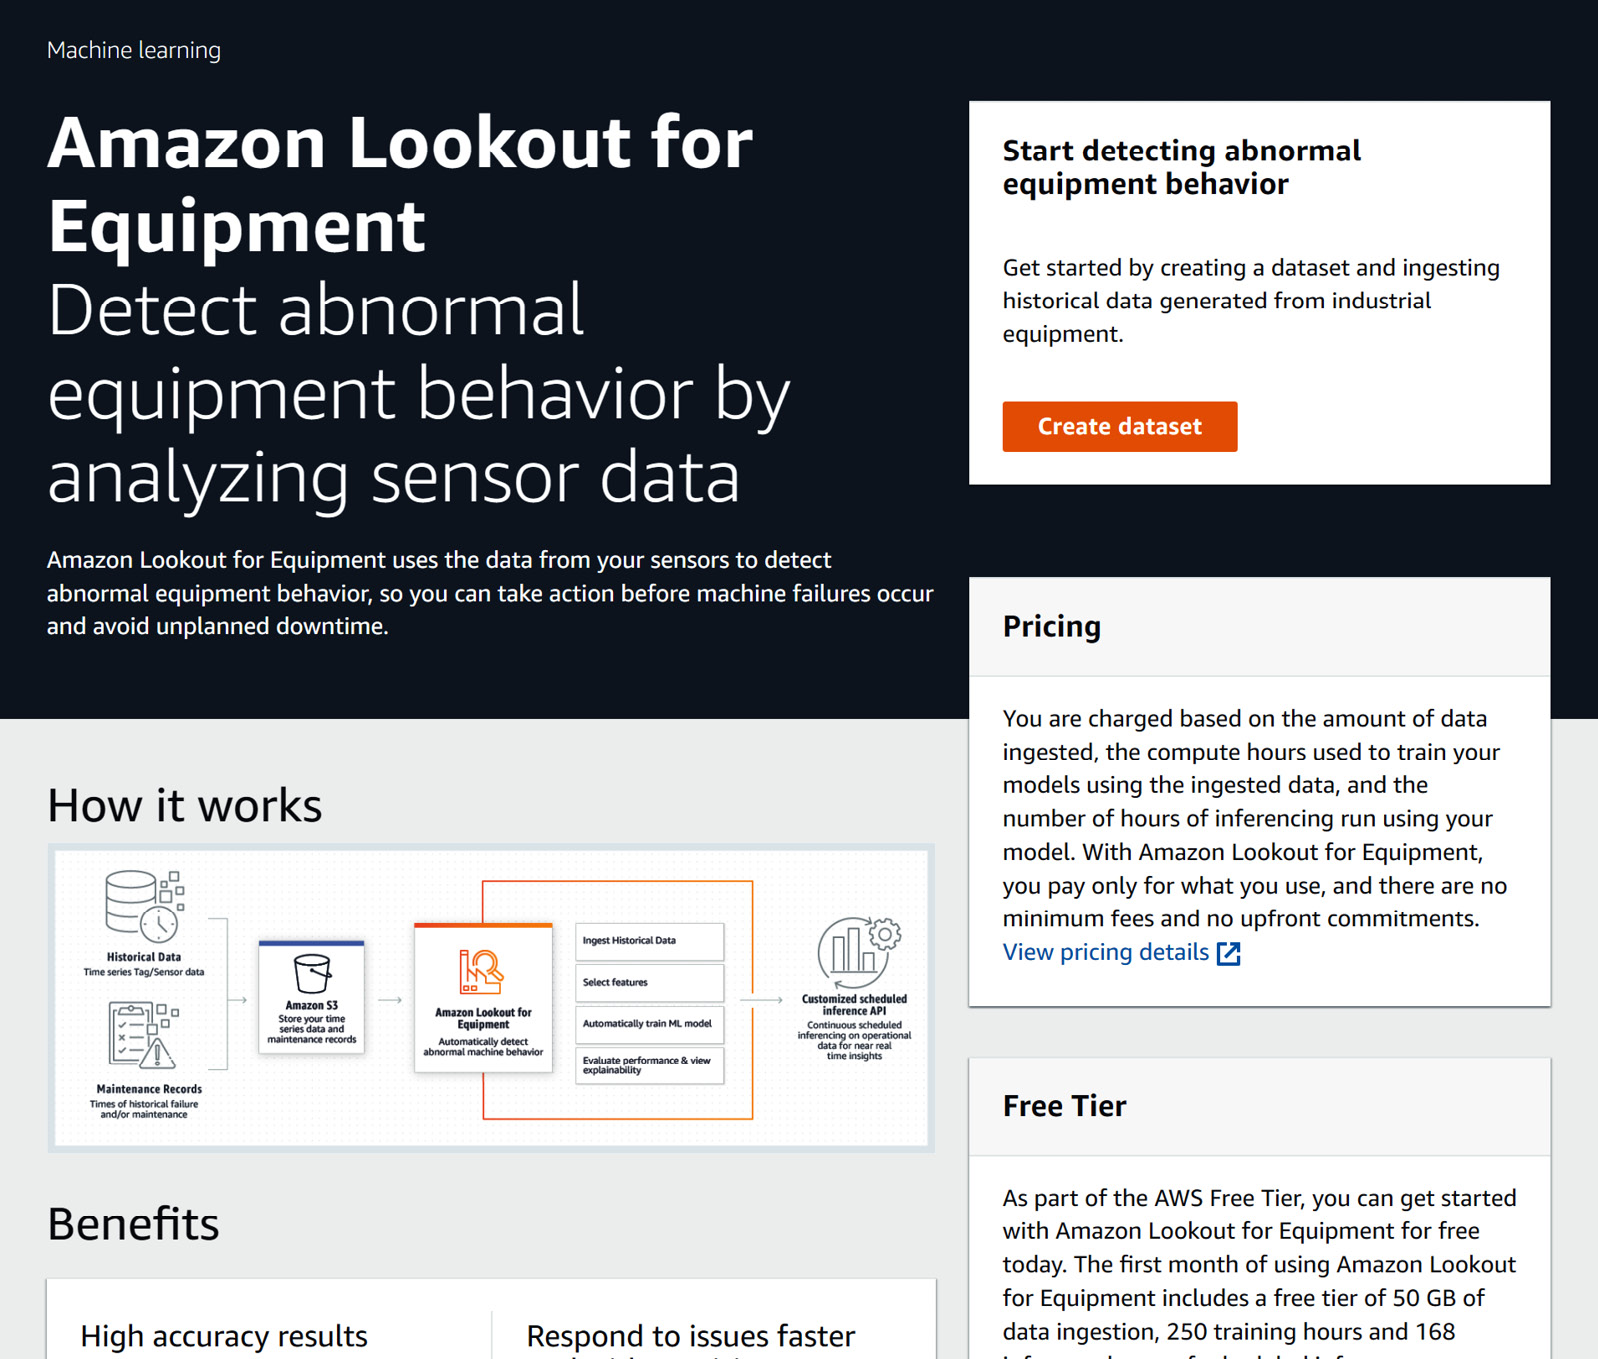
Figure 10.1 – The Amazon Lookout for Equipment home page
- On this page, you can click on the hamburger icon (the one with three horizontal lines) at the top left to open the left panel, where you can click on Datasets. You will land on a page listing all the datasets that are visible from within your AWS account. You should see the dataset you created earlier (we named it industrial-pump). Click on your dataset's name:
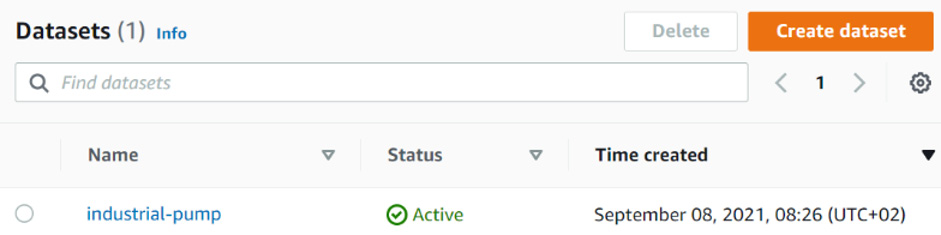
Figure 10.2 – Datasets list
- This will bring you to your dataset dashboard, where you can click on the Create model button:
Figure 10.3 – Dataset details
- The model creation form has several sections. Let's go through each of them in detail. The Model details section lets you enter a name for your model and select an optional encryption key to access your data. Leave the Customize encryption settings box unchecked and enter pump-anomaly-detection-model for your Model name:
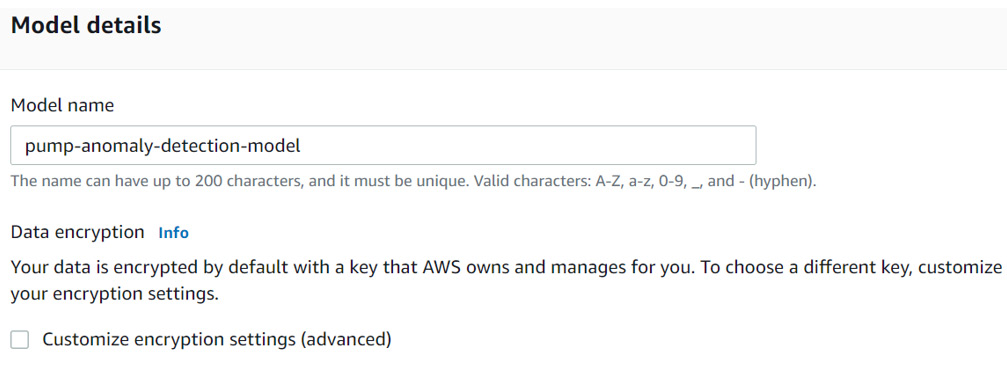
Figure 10.4 – Model creation details
- The next section lets you select which Fields you would like to use to train your model. In this case, you are going to use all the fields. To do this, you will need to click on the checkbox positioned in the header (1), navigate through each page (using the pagination controls) (2), and make sure the header checkbox is checked on each page:
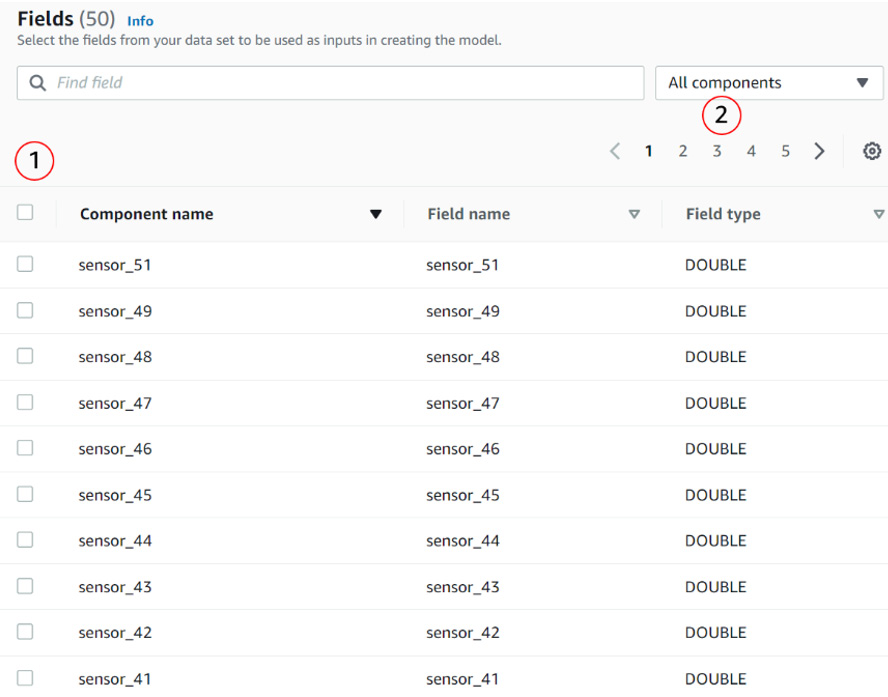
Figure 10.5 – Model creation fields
- The next section, Historical maintenance events, will let you point Amazon Lookout for Equipment to your label CSV file. When configuring this parameter, you must define the S3 location of the label data where the time series data is located. Click Browse to find your label data location:
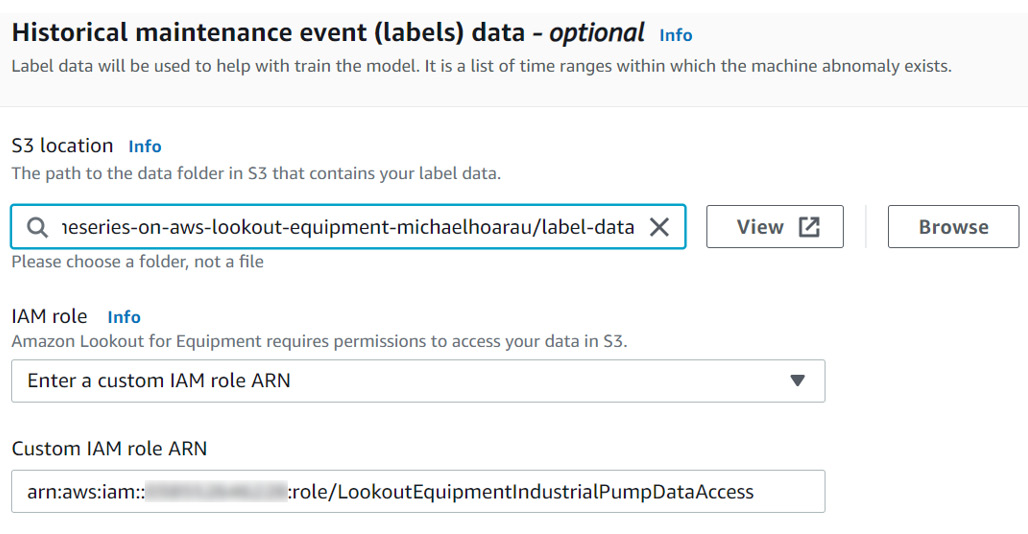
Figure 10.6 – Selecting a historical anomalous event file
From the popup that appears, click the label-data folder name:
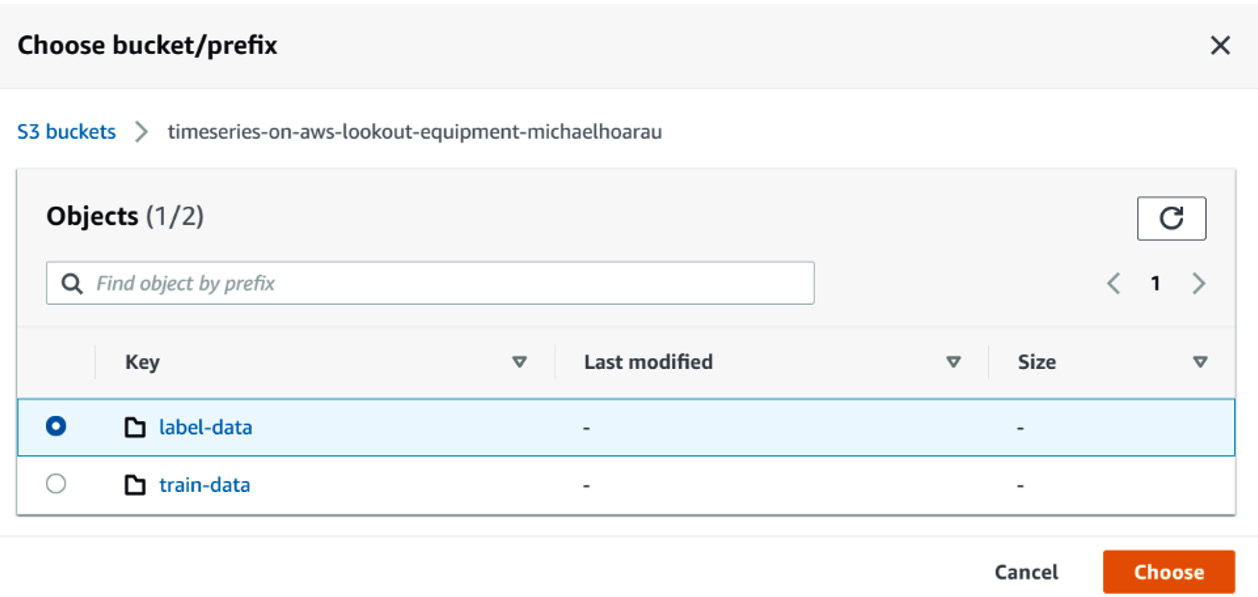
Figure 10.7 – Selecting the location of label-data
Then, select Enter a custom IAM role ARN and paste the ARN of the LookoutEquipmentIndustrialPumpDataAccess role that you created in Chapter 9, Creating a Dataset and Ingesting Your Data, using the IAM service. The format of the ARN should be arn:aws:iam::<ACCOUNT-NUMBER>:role/LookoutEquipmentIndustrialPumpDataAccess, where <ACCOUNT-NUMBER> needs to be replaced with your AWS account number.
Important Note
Although you will see this historical event file often called the labels file, this denomination has nothing to do with the type of machine learning algorithms that are used by Amazon Lookout for Equipment as they are all fully unsupervised ones. For more details about how this labels file is used, check out the How is the historical events file used? section, later in this chapter.
- The Training and evaluation settings section will let you define the time split and the sample rate at which your data will be downsampled by the service:

Figure 10.8 – Defining the training and evaluation split
When you're configuring this section, you must define the following:
a) Training data time range: This is the time range the service will use to train the model. For our industrial pump dataset, you can use 2018/04/01 to 2018/10/31.
Important Note
At the time of writing this book, the training range must at least be 90 days long. If your training range is shorter than this, the training process will fail.
b) Evaluation data time range: This is the time range the service will use to evaluate a trained model. For our dataset, you can use 2018/11/01 to 2020/05/04.
c) Time series sample rate: You can either use the original sample rate of your dataset or request Amazon Lookout for Equipment to downsample your data with a custom interval that can go from 1 second to 1 hour. Let's use 5 minutes.
Important Note
The sample rate choice impacts the training time – the smaller the sample rate, the longer the training will take. However, resampling your time series data also acts as a filter that keeps the highest frequency of your data out. If the anomalous events you are looking for are located in these higher frequencies, choosing a sample rate that is too coarse will filter them out and Amazon Lookout for Equipment will have a harder time finding them. If you have 6 to 12 months of data, a resampling rate of 5 minutes or 10 minutes is a reasonable starting point. Depending on the training time and the results of your model evaluation, you can retrain another model with a different sample rate and compare the output.
- The last section of interest is the optional Off-time detection section. We will not use this section for this example. See the Deep dive into the off-time detection feature section, later in this chapter, to get more details about this section.
- Scroll down to the bottom of the page and click on the Create button. Your model training will be launched.
You should now have ongoing training in progress: based on the size of the dataset and the parameters that you have configured, it should take less than 1 hour to train your first anomaly detection model with Amazon Lookout for Equipment. In the meantime, you can read about the way historical events and off-time sensors are used.
How is the historical event file used?
As a reminder, your historical event file (or labels files) looks like this:
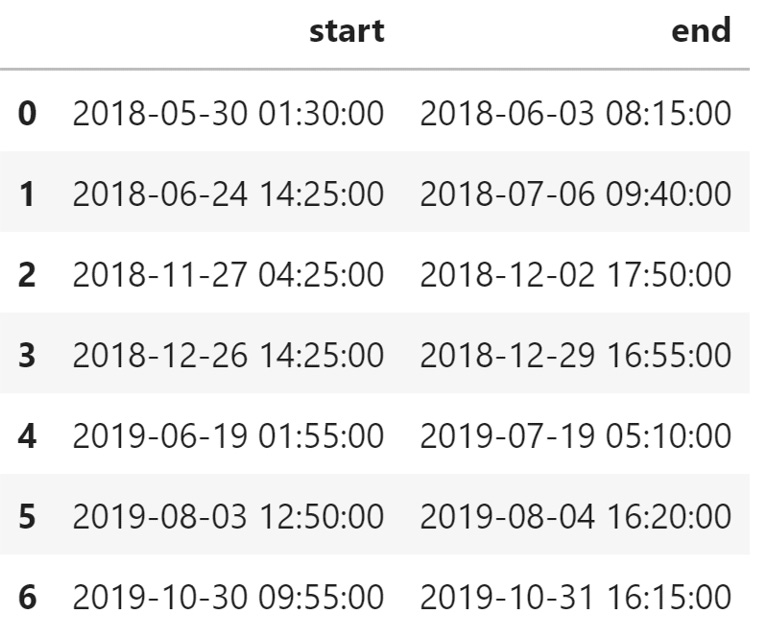
Figure 10.9 – Anomalous ranges overview
This label file provides insight into past events to Amazon Lookout for Equipment. Although all the algorithms that are used by the service are unsupervised, Amazon Lookout for Equipment uses these optional labels to train its models more accurately and efficiently. Leveraging its bank of more than 28,000 combinations of parameters and algorithms, Amazon Lookout for Equipment can use this label file to find the optimal model that finds abnormal behaviors within these time windows.
How does Amazon Lookout for Equipment use this data? Let's look at the first row and let's see how it's interpreted:
- The second timestamp (2018-06-03 at 8:15:00) can be a maintenance event or when the abnormal behavior was noticed by someone.
- The first timestamp (2018-05-30 at 1:30:00) indicates when the abnormal behavior is expected to have started.
This window will be used by Amazon Lookout for Equipment to look for signs of an upcoming event leading to an anomaly. Let's look at the events that are part of our industrial pump dataset:
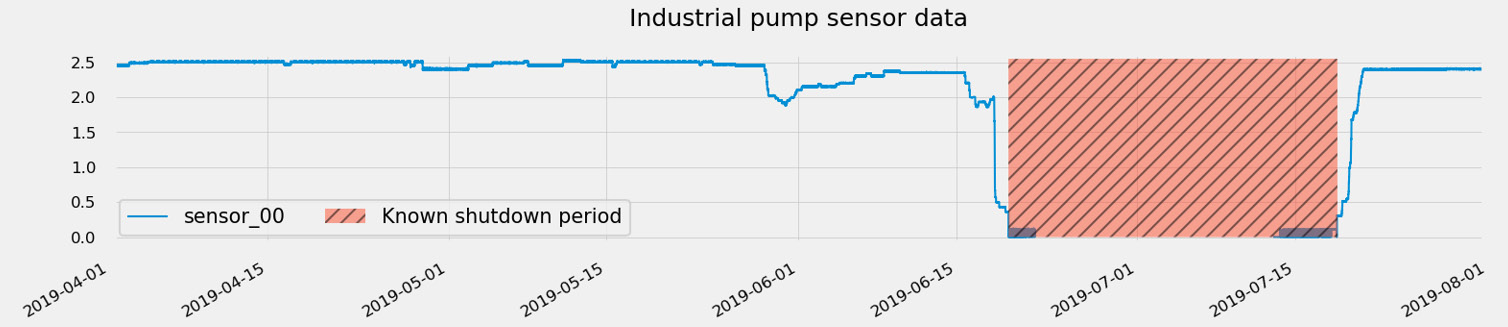
Figure 10.10 – Historical event example
In the previous plot, you can see the following:
- The hashed area highlights the known shutdown period provided with the original dataset. This period has a range going from 2019-06-19 14:00 to 2019-07-18 17:10.
- On this signal, you can see that something already looks off before the period marked and as soon as 20 days before (starting around 2019-06-01).
- On this same signal, you can also see that this equipment goes through a restart or healing period after the event.
Depending on the quality of the predictions and how long a forewarning you can get for a given event, one strategy to improve your model could be to expand the label ranges. For instance, the label for the event shown in the preceding screenshot could be enlarged to go from 2019-05-29 up to 2019-07-22:
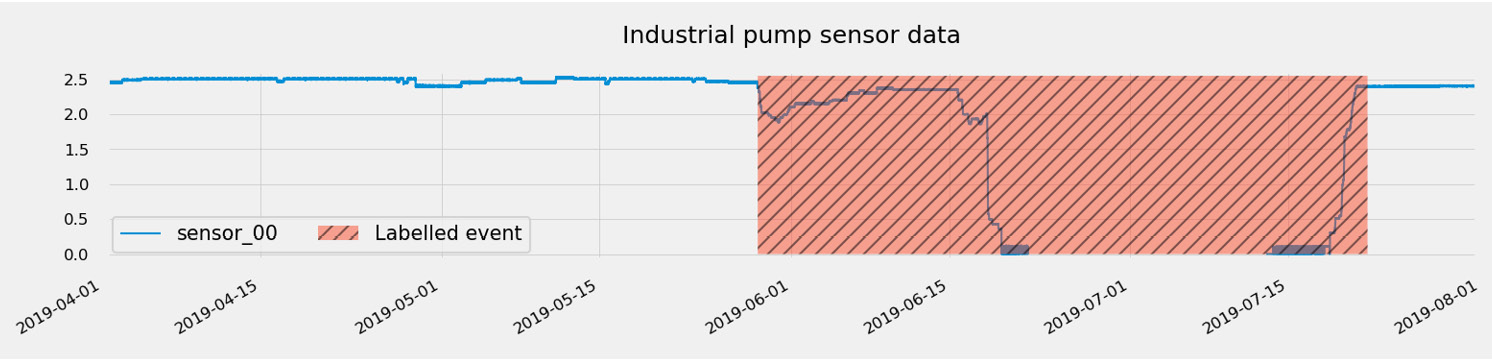
Figure 10.11 – Historical event updated label
As an exercise, I recommend that you have a look at the time series data and try to identify any good labels of the historical event that were provided with the original dataset. Once you have trained your first model, you can train a second version with your updated label file and compare the results.
Deep dive into the off-time detection feature
This optional section lets you tell Amazon Lookout for Equipment which sensors it can use to decide that equipment is going through a shutdown. When your piece of equipment has long shutdown periods (regular or not), it is usually required to remove the signals from these periods as they are not relevant for finding any anomalies.
When creating a new model, the Off-time detection section is located at the bottom of the screen, before the Tags definition section:
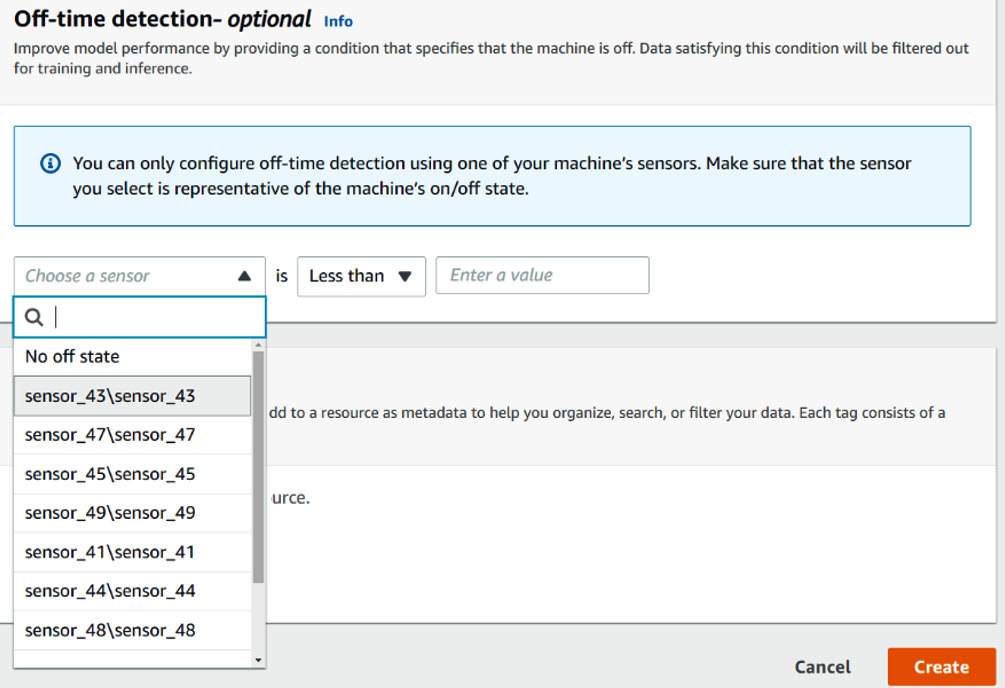
Figure 10.12 – The Off-time detection feature
To use this feature, simply fill in the following fields:
- Sensor: This dropdown list will be populated with the list of fields that you selected for this model. Each sensor will have a label of component name ag name, as defined in the schema corresponding to the dataset that was used to train the model. In our case, we put each sensor in a component with the same name and each item of the dropdown list has a duplicated label (for instance, sensor_43sensor_43).
- Rule: The rule can either be less than or greater than.
- Value: Enter an integer or float value.
Let's say your equipment is a rotating machine and that sensor_43 measures the rotation speed in RPM. You know that any rotation speed less than 100 RPM means your equipment is either off or currently shutting down. To tell Amazon Lookout for Equipment this, you will configure the Off-time detection section by writing a rule stating that sensor_43sensor_43 is less than 100 RPM.
Once a condition has been met, all the data satisfying it will be discarded to train a model. Similarly, at inference time, all the data satisfying this condition will be filtered out.
Now that you know how the labels data and the off-time detection feature are used to train an anomaly detection model, let's look at the different ways you can organize your collection of models.
Model organization best practices
Amazon Lookout for Equipment includes the following hierarchy of artifacts within a given AWS account:
- The dataset is the highest level of the hierarchy; a dataset is defined by an immutable data schema that's defined at creation time.
- When defining the data schema, the different tags can be regrouped in different components: a component must match a folder in your S3 training dataset.
- Each dataset can be used to train multiple models and each model can use all the sensors available in the dataset (as defined in the schema) or only a selection of those.
- The lower level of this hierarchy is the sensor time series (also called tag, signal, or field).
Note
A higher level of this hierarchy is the AWS account/user. Although more heavy lifting will be required to set up the appropriate permission, you can build a solution where multiple AWS accounts would use Amazon Lookout for Equipment across your organization, depending on their geographical location, for instance.
Depending on the root level or your industrial data organization, you can use this hierarchy in different ways:
- If you have multiple sites/factories/shop floors:
- Store all the data of a factory at the dataset level; a dataset can contain up to 3,000 sensors across all components. You will have as many datasets as you have factories.
- Use the components to regroup the sensors of different production areas or production lines. A dataset can contain up to 3,000 components.
- Use specific tag naming conventions to identify different pieces of equipment within a given production area/line.
- A model can then use all the sensors from a component (production line anomaly) or a subselection of tags associated with a given piece of equipment. A model can use up to 300 sensors at once.
- If you are focused on a single factory:
- If you have less than 3,000 signals, you can store all your time series in a single dataset. If not, you can use the dataset level to store the sensor data linked to different production areas or production lines.
- Use the components to regroup the sensors of a given piece of equipment.
- Build a model per component of interest (depending on the piece of equipment you want to monitor) or for the whole dataset if you want to monitor a given process or production line.
- If you are focused on a single piece of equipment:
Note that if the amount of data you have allows it, I recommend not splitting your data according to different periods (a dataset for 2021, another for 2020, and so on) as this will prevent you from building models across your different periods. When you create a new model, you can define the training start and end date, along with the evaluation start and end date. You can then either use the AWS tagging mechanisms to store the time or add a date-time string to your model naming convention to recognize it easily.
Now that you have an idea of the different ways you can organize your dataset, let's look at how to choose the best split possible between your training and evaluation data.
Choosing a good data split between training and evaluation
When you're choosing a data split between your training and evaluation periods, you need to consider the following constraints or recommendations:
- The first constraint to consider is the requirement to have at least 90 days in the training range. At the time of writing, Amazon Lookout for Equipment considers that it needs at least this period to model the normal operating behavior of a piece of industrial equipment. This physical behavior is independent of the granularity at which the sensor data is collected.
- Ideally, the training range should include all the normal operating behaviors of your process or equipment. If a new behavior is only seen during the evaluation range, then there will be a high chance that Amazon Lookout for Equipment will flag it as an anomaly.
Important Note
Make sure that you don't have severe level shifts in some of your sensors (for instance, sensors that stopped working over a long time): although this has more to do with how to select good signals to build a model, we recommend that you remove any signals that display long periods of shutdown time as it will make it harder for you to select a train/evaluation split that includes both behaviors.
In addition, although a malfunctioning sensor is an anomaly you may want to correct, you don't want these malfunctions to impair your capability to capture more complex equipment or process anomalies.
- In addition, your training range should include some occurrences of anomalies (precisely delimited in time or not) if possible.
- Once you have set aside this minimum amount of training data (at least 180 days, as many normal operating modes as possible, and a few anomalies), you can start positioning the split to start the evaluation range. Ideally, this evaluation range will include some known anomalies so that you can evaluate the relevance of the events that are detected by Amazon Lookout for Equipment.
Once you have a trained model and are using it in production, your equipment or process may display a new normal operation model (by new, I mean not seen at training time). As we discussed previously, Lookout for Equipment may flag these periods as anomalies. To prevent this from happening, you will need to update your training dataset and adjust your training/evaluation split to ensure that the new normal modes are captured during model training.
Now that you know how to split your dataset, let's look at the insights provided by Amazon Lookout for Equipment when it evaluates a trained model.
Evaluating a trained model
Once a model has been trained, you can evaluate its relevance by looking at the evaluation results. In this section, we are going to do the following:
- Provide an overview of the model evaluation dashboard
- Deep dive into the model performance section and how to interpret it
- Deep dive into the event diagnostics section and how to interpret it
Let's start with the evaluation dashboard overview.
Model evaluation dashboard overview
To access this dashboard for any given model, follow these steps:
- Log into your AWS console and search for Lookout for Equipment in the search bar at the top.
- Click on Amazon Lookout for Equipment to go to the service's home page.
- On this page, you can click on the hamburger icon (the one with three horizontal lines) at the top left to open the left panel, where you can click on Datasets. You will land on a page listing all the datasets that are visible in your AWS account. You should see the dataset you created earlier (we named it industrial-pump). Click on your dataset's name.
- This will bring you to your dataset dashboard, where you can click on the View models button:
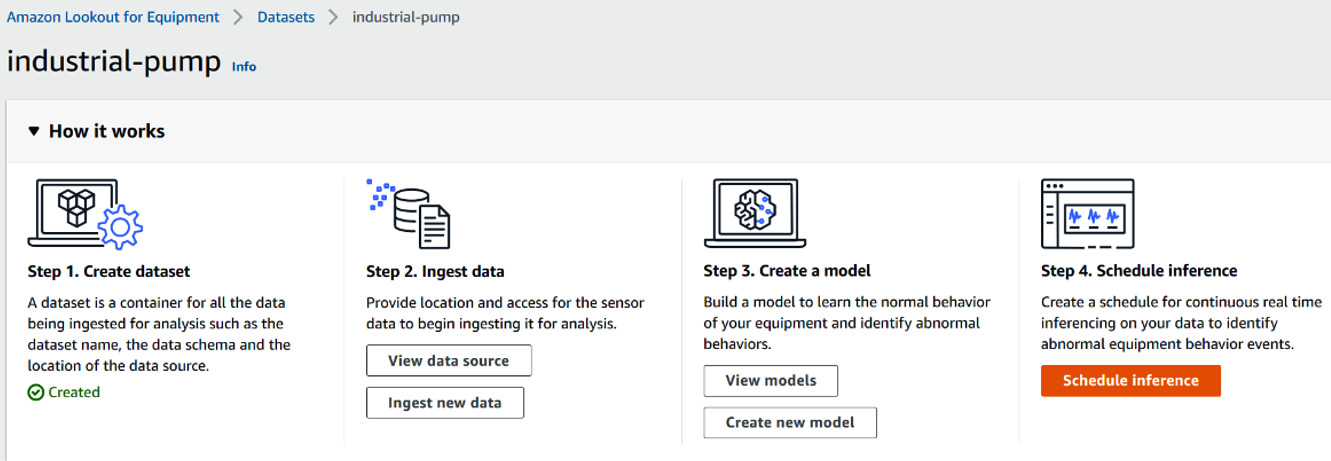
Figure 10.13 – Dataset dashboard when at least one model has been trained
- You will see a list of all the trained models based on this dataset. In your case, you should only have one, so click on its name to access this model's dashboard.
- A trained model dashboard is divided into four parts:
- The model details section tells you, among other things, the model's name, the date it was created, and how long it took to train:
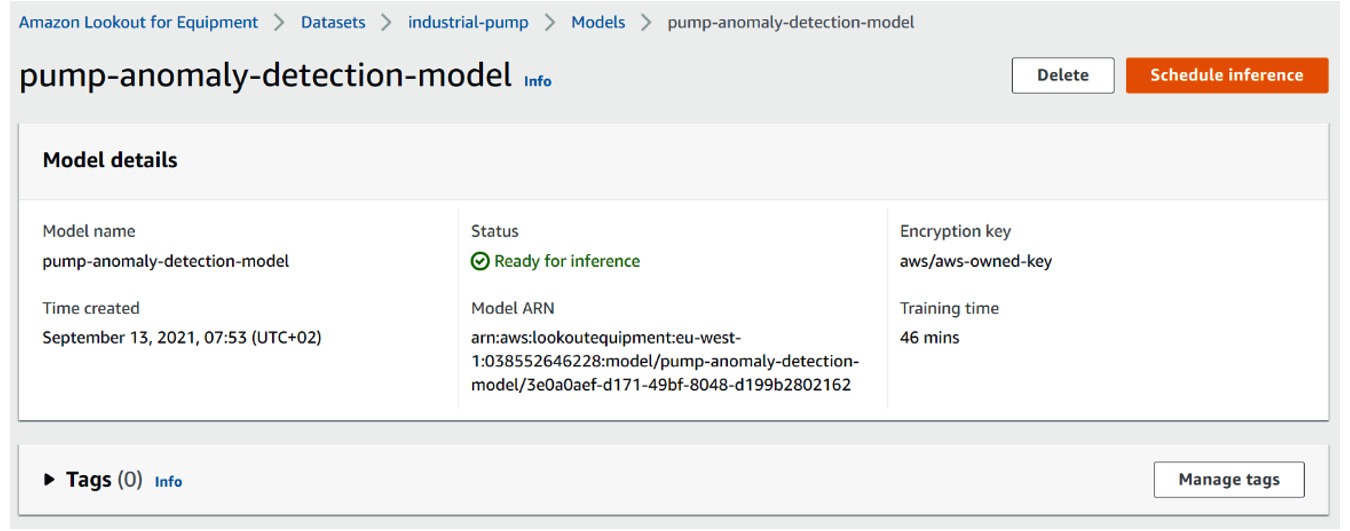
Figure 10.14 – Trained model dashboard – Model details
- The model performance overview section. This will be covered in more detail in the Interpreting the model performance dashboard's overview section, later in this chapter:
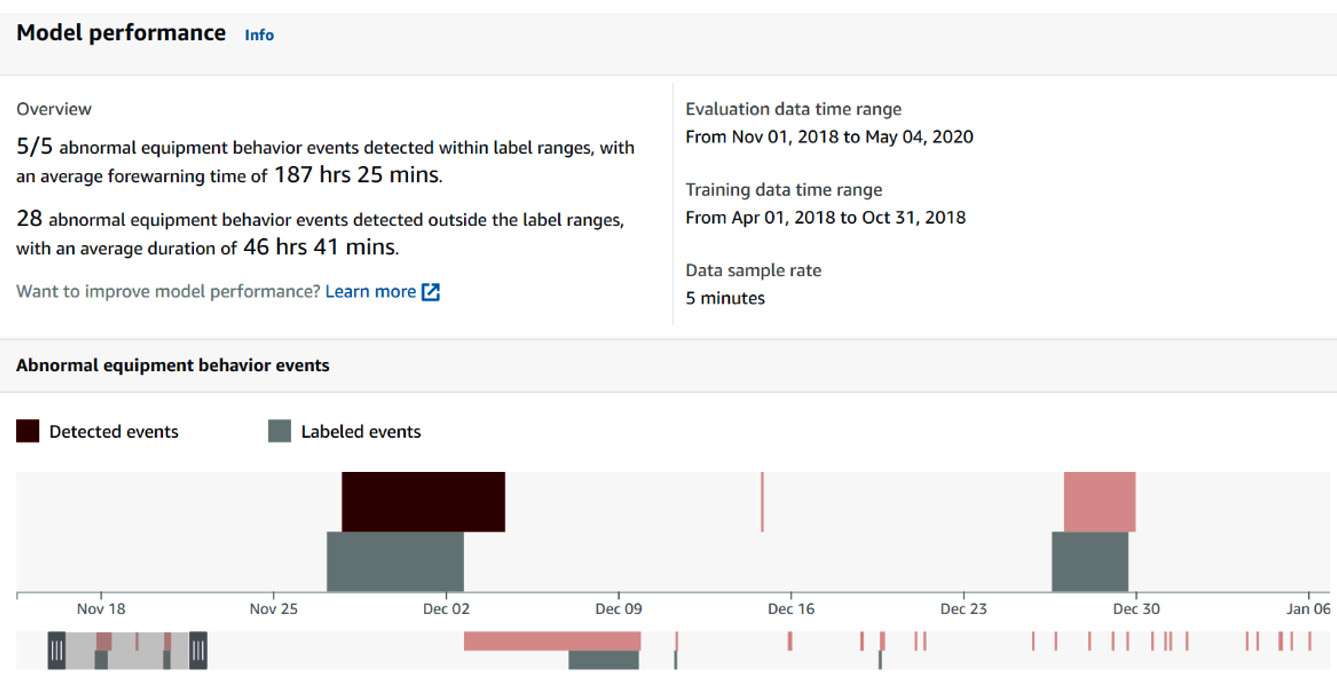
Figure 10.15 – Trained model dashboard – Model performance
- A single event diagnostic that unpacks the details associated with a detected anomaly that you clicked on in the previously detected event strip chart. You will learn more about this in the Using the events diagnostics dashboard section, later in this chapter:
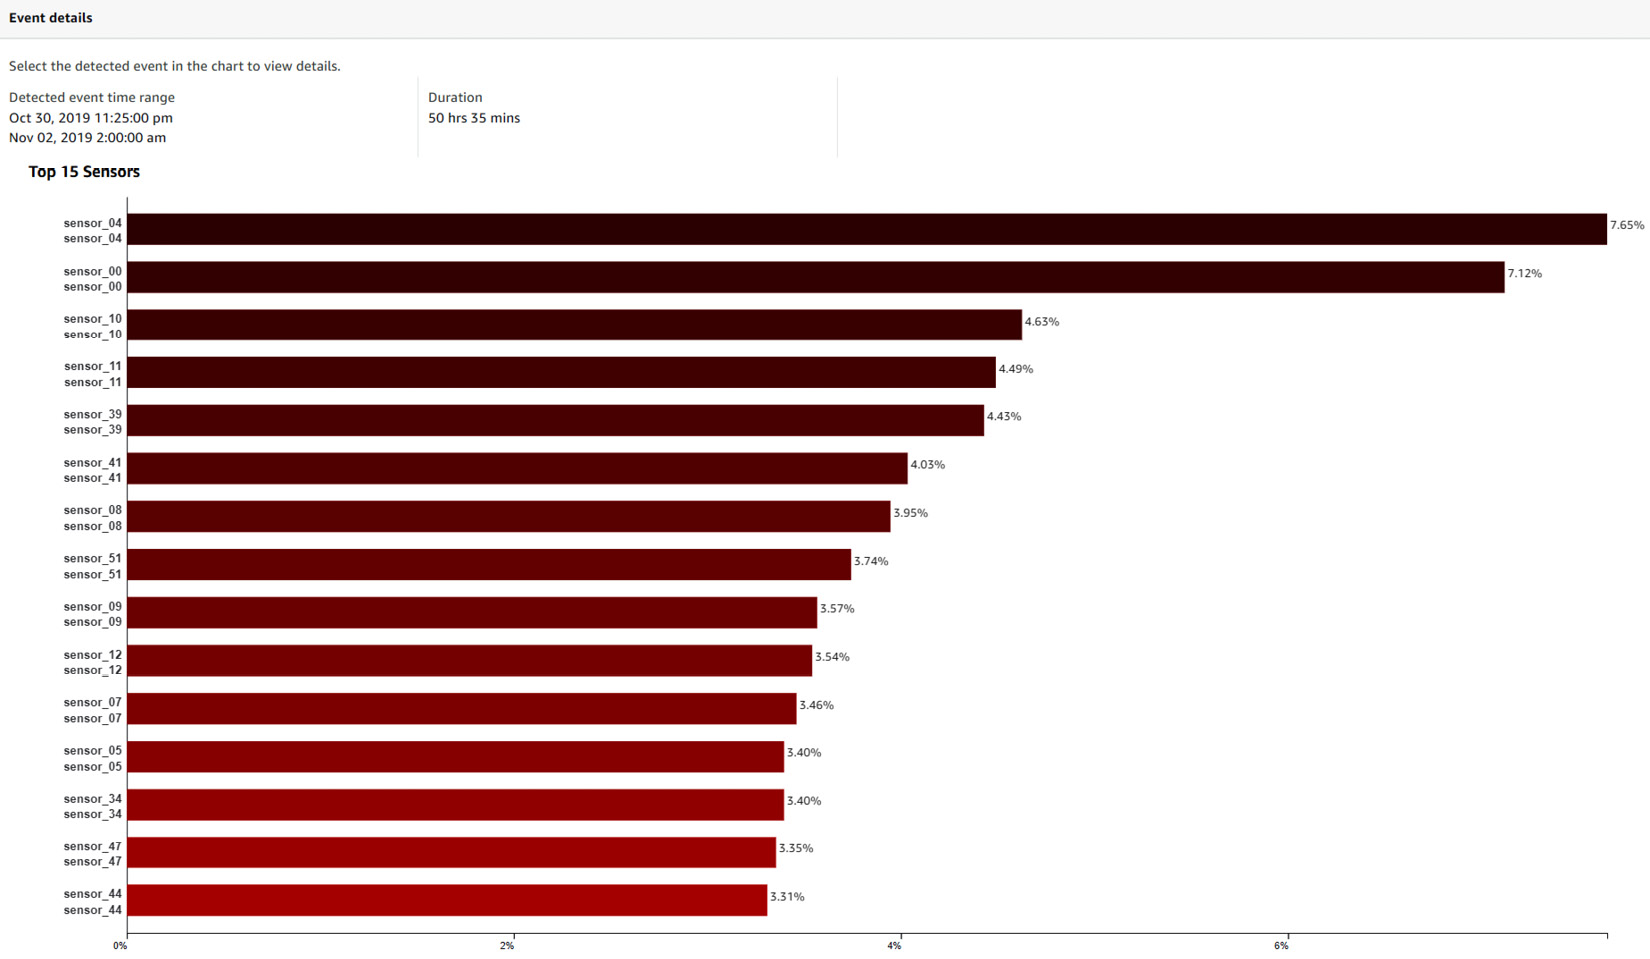
Figure 10.16 – Trained model dashboard – Event details
- The last section contains a reminder of the sensors that you selected to train this model and if it used any label data containing known historical events:
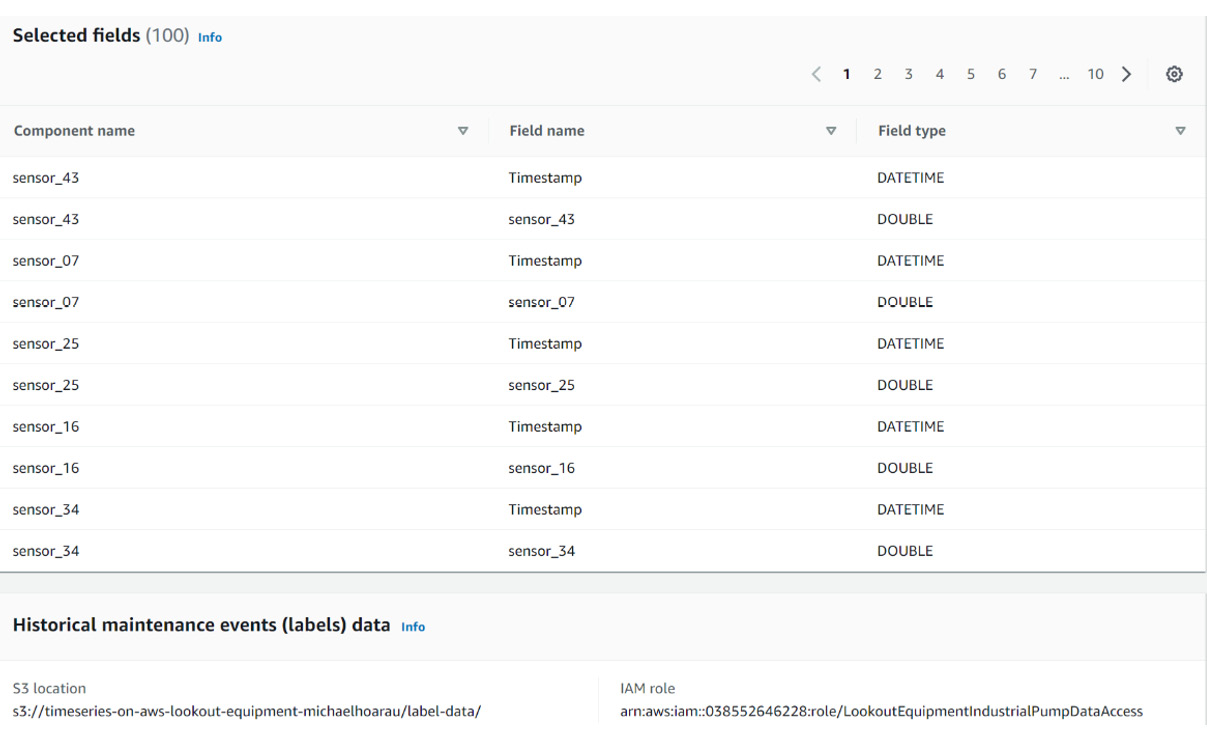
Figure 10.17 – Trained model dashboard – Model configuration reminders
Now that you know about the outputs of a model that's been trained by Amazon Lookout for Equipment, let's dive into the model performance and event diagnostics sections to see how you can derive meaningful insights from them.
Interpreting the model performance dashboard's overview
This section of the model performance dashboard contains the following information:
- How many known abnormal events (as provided in the historical events file) are captured by Amazon Lookout for Equipment. An abnormal event is considered detected if at least one anomaly detection is triggered by Amazon Lookout for Equipment. In our case, we mentioned five events in our historical abnormal event file and all of these were detected.
- How long before each known historical event (part of the label file) it takes Amazon Lookout for Equipment to detect something. This measure is averaged over all the known events located in the evaluation period and is labeled as the Average forewarning time.
- How many events are detected outside of the label ranges, along with their average duration.
- A strip chart containing the known events and the detected ones. The strip chart contains an overall view of the whole evaluation period and a slider you can use to zoom in on any area of interest. The zoomed area will appear at the top:
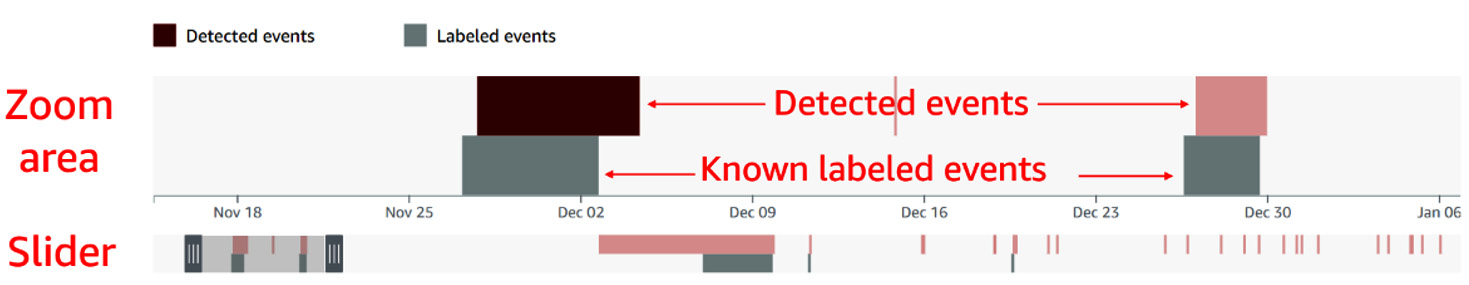
Figure 10.18 – Trained model dashboard – Detected events
Anomaly detection accuracy is challenging to assess in most industrial environments where precise historical anomalies may not be captured. Traditionally, in machine learning, any event that's detected outside of the known ones can be considered a false positive. In industrial anomaly detection, such an event could be one of the following:
- A false positive; that is, looking at the average duration of all detected events and comparing it with a given event can help filter it out if it looks sporadic or isolated.
- A precursor event, which may lead to an equipment or process anomaly, should the event be discarded. Establishing a procedure to react only when events frequency and/or average duration stays above a certain threshold can help orient the investigation effort of your shop floor operators, process engineers, or reliability teams accordingly.
- An unknown event – in other words, an event that was not captured in the labels file with the historical event. Double-checking what happened at that time can help you tell if this event was relevant or not.
- An unknown normal operating mode. This may also be a normal behavior that Amazon Lookout for Equipment did not see during training time.
Next, we will look at how to use events diagnostics dashboard.
Using the events diagnostics dashboard
If Amazon Lookout for Equipment detects any events in the evaluation period, you will be able to click on any of them in the model performance strip chart to unpack the magnitude at which the top signals contributed to this event. At the top of the event details section of the model evaluation dashboard, you will see the following:

Figure 10.19 – Event details
In this header, you can find the time range and the duration of the selected event. The sensor importance chart is plotted after these event details as a horizontal bar chart:
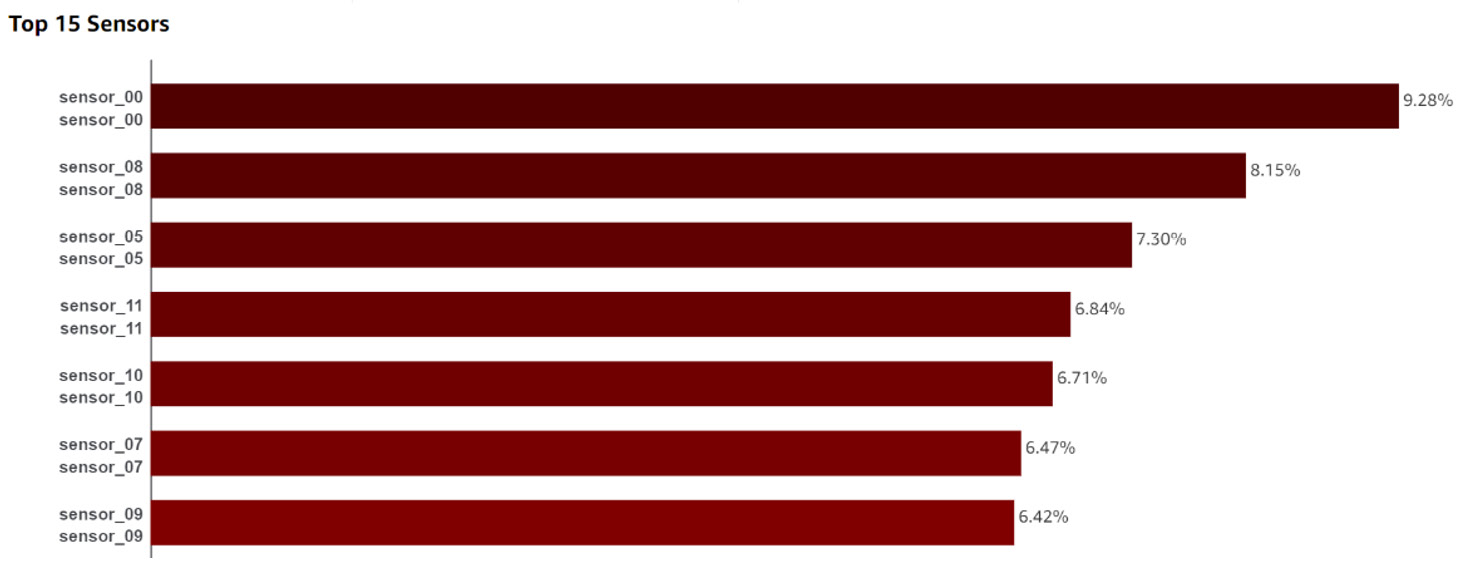
Figure 10.20 – Event details – Top sensors
This chart displays up to 15 sensors. For each sensor, you can see the following:
- The component and the name of the sensor as the label for each horizontal bar on the left-hand side.
- A horizontal bar with the top contributor sensors by decreasing magnitude.
- A percentage number on the right, indicating how much a given sensor is contributing to a detected event according to Amazon Lookout for Equipment.
Note
Although this chart displays no more than 15 sensors, the Service API allows you to programmatically query the sensor importance for every sensor present in your dataset.
If you were to sum up the total contribution for every sensor, you would find 100% contribution. This means that you can easily compare the contribution of any sensor to what would have happened if every sensor was contributing equally. Let's take the example of our industrial pump dataset. This dataset includes 50 sensors. For any given event, if each sensor had the same contribution as the other, the sensor importance should be 100% / 50 = 2%. In Figure 10.20, you can see that sensor_00 has a contribution magnitude of 9.28%, which is significantly higher than the 2% average. In addition, you can also see that the top 7 sensors (out of the 50 provided) already have a contribution magnitude of more than 50% for this particular event. This knowledge is very useful if you wish to have a maintenance team focus on the right location in an industrial environment.
Since this difference is significant from a statistical point of view, you may find it interesting to start investigating the piece of equipment or process step this sensor is attached to.
There are several ways you can use this raw information to derive more insights to manage your equipment or process:
- If you used the data schema components to regroup your sensors according to a process step, a piece of equipment, or a subsystem, you can sum their feature importance and group them by component. You could then build another horizontal bar chart showing the importance of each component concerning any selected event.
- You can also plot the evolution over time of the sensor importance for each tag. This kind of plot can help you understand which signals are consistently top contributors for a group of events and will provide more robust insight that you can leverage in your anomaly investigation.
- In addition, the plot evolution can visually display different patterns that a skilled process engineer could help you use to perform some anomaly classification. The following screenshot shows an example of a sensor evolution plot for another dataset:
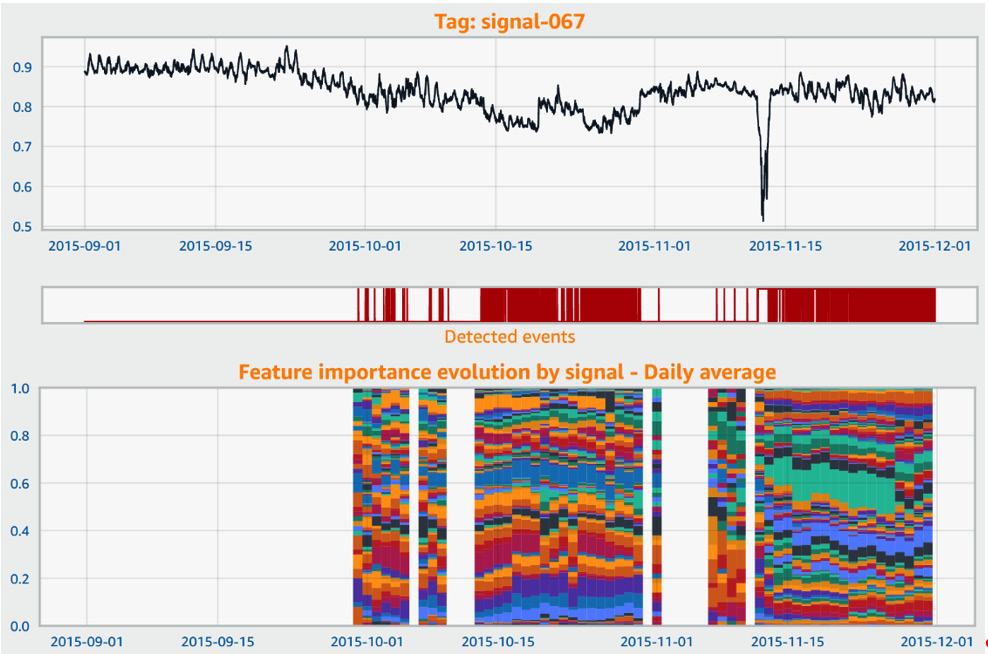
Figure 10.21 – Sensor importance post-processing
Note
To learn more about how you can build such dashboards, check out Chapter 12, Reducing Time to Insights for Anomaly Detections.
In the preceding screenshot, from top to bottom, you can see the following:
- A line plot for a given signal. You can easily see a dip shortly before November 15 where it looks like an anomaly occurred.
- A strip chart with the events detected by Amazon Lookout for Equipment. You can see that it fires some events before the actual anomaly and that these events appear as soon as mid-October. An investigation of the equipment around that time may have helped prevent the anomaly on November 15.
- A feature importance evolution over time. The sensor contributions are only visible when an event is detected. Here, you can easily see that the patterns of the events that were detected before, during, and after the anomaly are very different.
As you can see, learning how to post-process the outputs from Amazon Lookout for Equipment can yield rich insights that can help facilitate proactive inspection or maintenance of your manufacturing process or industrial equipment.
Summary
In this chapter, you learned how to train your first anomaly detection model with Amazon Lookout for Equipment. Using the dataset you created in the previous chapter, you were able to configure and train a model.
One of the key things you learned from this chapter is how Amazon Lookout for Equipment leverages provided optional labels. Although the service only uses unsupervised models under the hood, these label ranges are used to rank the ones that are best at finding abnormal behaviors located within these ranges.
Last but not least, we took a deep dive into how to read the evaluation dashboard of a trained model and how valuable it can be to go beyond the raw results that are provided by the service.
In the next chapter, you are going to learn how to use your trained model to run regularly scheduled inferences on fresh data.