
Chapter 12: Reducing Time to Insights for Anomaly Detections
In the previous chapters, you learned how to prepare multivariate datasets, how to train and evaluate an anomaly detection model, and how to configure an inference scheduler. To get the most from Amazon Lookout for Equipment, you can partner with a data engineer or a data scientist who will help you improve your model performance and go further in the post-processing of results.
The main objectives of this chapter are to point you in the right direction to visualize and monitor your models. This will be very valuable to detect any drift that would trigger either retraining or further investigation. In addition, you will learn how to build an automation pipeline, which will be critical to iterate as fast as possible without having to manually navigate through multiple console screens.
In this chapter, we're going to cover the following main topics:
- Improving your model's accuracy
- Processing the model diagnostics
- Monitoring your models
- Orchestrating each step of the process with a serverless architecture
Technical requirements
No hands-on experience in a language such as Python or R is necessary to follow along with the content from this chapter. However, we highly recommend that you read this chapter while connected to your own AWS account and open the different AWS service consoles to run the different actions on your end.
To create an AWS account and log in to the Amazon Lookout for Equipment console, you can refer to the technical requirements of Chapter 2, An Overview of Amazon Forecast.
Improving your model's accuracy
In Chapter 10, Training and Evaluating a Model, you trained an anomaly detection model and visualized the outputs over an evaluation period. Depending on what your business objectives are, here are several areas you may want to improve the obtained results:
- Too many false positives: After evaluating the events triggered by Amazon Lookout for Equipment against reality, you might see some events as false positives you would like to discard.
- Too many false negatives: In some cases, you might know about some anomalous events that were not detected in the evaluation period.
- No or too short forewarning time: Sometimes, anomalies are detected but too late and you want to get a longer forewarning time so that your end users have enough time to take the appropriate mitigation actions.
Reducing the occurrences of these situations will increase the trust your end user puts in the insights provided by the service and increase the added value you get from it. Every situation, piece of equipment, or industrial process is different and you will likely have to work closely with a subject matter expert to improve your anomaly detection models. Here are a few areas of investigation I have found useful when it comes to anomaly detection/prediction model improvement:
- Reducing the number of signals
- Using the off-time conditions
- Selecting the best signals
Let's start by looking at how you can reduce the number of signals to train a model.
Reducing the number of signals
Amazon Lookout for Equipment can build models with up to 300 signals. However, the more time series signals you use, the more likely you will generate some multivariate noise, making it difficult for a machine learning model to capture what is a normal operating condition and what is the normal variability of a given process.
If you start training with many signals, identify which signals are often present in the signals ranking from the Amazon Lookout for Equipment dashboard and try to train with the top 15 or 30 signals. In the following screenshot, you can see that the top 12 signals have a 50% contribution to a particular event that lasted more than 50 hours. Looking at other significant events in your evaluation period will help you select the signals that keep coming up whenever an event is detected.
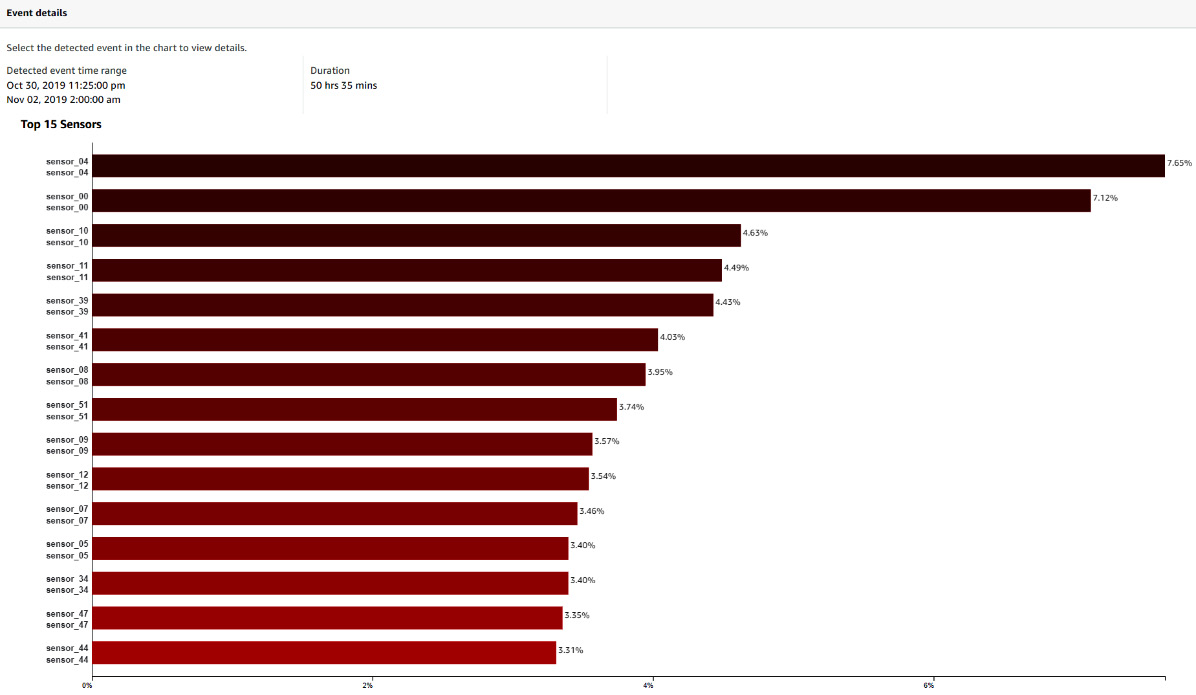
Figure 12.1 – Trained model dashboard – Event details
You may also keep only the signals whose feature importance is higher than the average. If you have 50 signals, 100% / 50 = 2% is actually the feature importance each signal would have if they were contributing equally to any given event. Any signal with a significantly higher contribution than 2% will be a good candidate to keep for a second version of your model.
Using the off-time conditions
When training a model, Amazon Lookout for Equipment allows you to select a signal that will be used to identify when a process or a piece of equipment is off, as shown in the following screenshot:

Figure 12.2 – Off-time detection feature
When you configure this parameter, Lookout for Equipment will remove the signals from these periods as they are not relevant to find any anomalies. If you leave this data while training, the periods where your asset or process is down will likely be marked as anomalies and you will end up with many false positives.
Selecting the best signals
Not all time series signals have good predictive power when it comes to anomaly detection. Plot and visualize the top signals that contribute to your most important events. Look especially for signals that support the following behavior:
- Many missing values: This might indicate a sensor failure or a data collection issue. Although this may be a valid situation to investigate, you may want to drop these sensors when your train a new model.
- Constant values: This situation is very similar to the previous ones. Signals with constant values do not add any value to the modeling. However, if such a signal were to start evolving differently in the future, this would be easily picked up by Amazon Lookout for Equipment. Consider dropping this type of signal if you are confident this won't happen.
- Categorical data: In most anomaly detection settings, many false positives will be triggered if your categories are imbalanced. I recommend not using these signals as is. You might want to use them for additional preprocessing or to engineer new features of interest.
- Chaotic behavior: Some measurements may be all over the place without any steady behavior that's easy to capture. These kinds of signals add a lot of noise that makes it hard for an anomaly detector to separate what is normal from abnormal. Consider dropping these signals.
- Monotonically increasing: This might indicate a measurement such as operating hours or be linked to how long an asset has been running. I recommend that you avoid using these types of sensors.
- Seasonal data: Some signals may be impacted by seasonality. In this case, make sure you include enough data in the training period to visualize a whole cycle. For instance, if your data displays yearly seasonality, consider training over at least a year to capture this behavior.
- Level shifts: When the evaluation period displays normal operating modes that are different from the training period, Amazon Lookout for Equipment will likely fire up many anomalies. Consider changing the train/evaluation split to capture the additional operating modes of interest.
Once you are happy with the signals you have discarded, you can train a new model while using most of the training period and reducing the evaluation period to 1 day (this is the minimum you can set at the time of writing this book). This will ensure your model is built with the freshest data at inference time.
Processing the model diagnostics
When you train an anomaly detection model with Amazon Lookout for Equipment, you can visualize the results obtained over an evaluation period. These results are available in the console and you can also query an API to integrate and further post-process these results for your own needs.
At inference time, the inference scheduler reads new data from an input location on Amazon S3 and outputs the model results in an output location. Each inference execution creates a new directory named after the timestamp at which the scheduler woke up and each directory contains a single file in JSON Lines format. In Chapter 11, Scheduling Regular Inferences, you learned how to locate, download, and interpret the results contained in these files.
In this section, you will use a CloudFormation template that will deploy a CloudWatch dashboard that you can use to visualize training and inference results from Amazon Lookout for Equipment. You will then see how you can use these dashboards. The last part of this section will be dedicated to using these dashboards to derive more insights from the raw Lookout for Equipment results.
Deploying a CloudWatch-based dashboard
As a first step, make sure you log in to the AWS Console. Once this is done, and depending on the AWS region where you are using Amazon Lookout for Equipment, you can click on one of the following links to start the deployment process:
- US East (N. Virginia): https://tinyurl.com/vp3da3t2
- Europe (Ireland): https://tinyurl.com/vj3kcdx5
- Asia Pacific (Seoul): https://tinyurl.com/44e4ua48
After you have clicked on one of the previous links, you will be brought to the Create stack screen from the AWS CloudFormation console. To continue with your deployment, follow these steps:
- Start by clicking Next at the bottom of the first screen.
- On the parameters page, you will have to fill in the following:
- Stack name: Let's call our stack LookoutEquipmentDashboard.
- SnapshotBucket: A name for the bucket where the dashboard snapshots and temporary files will be collected. Remember that your bucket name must be unique across all the accounts of the AWS Cloud. Add a random string at the end of the name you choose if you get an error telling you your bucket already exists at deployment time.
- SnapshotRuns: The frequency (daily or weekly) at which the inference dashboard snapshot will be taken and sent by email.
- TargetEmail: The email where the snapshots will be sent.
- The target email must be registered in Amazon Simple Email Service (SES). To do this, take the following steps:
- Open a new tab or window in your browser and navigate to the SES console. You can use the Services dropdown located at the top of any AWS Console page and search for Amazon Simple Email Service in the Business Applications section.
- In the left menu, click on Verified identities and then click on Create identity.
- Select Email address and fill in the address you want to use. Click Create identity.
- You will shortly receive an email in your inbox: click on the link to verify your address.
- Once you have registered your email address, go back to the tab with your CloudFormation parameters and click the Next button.
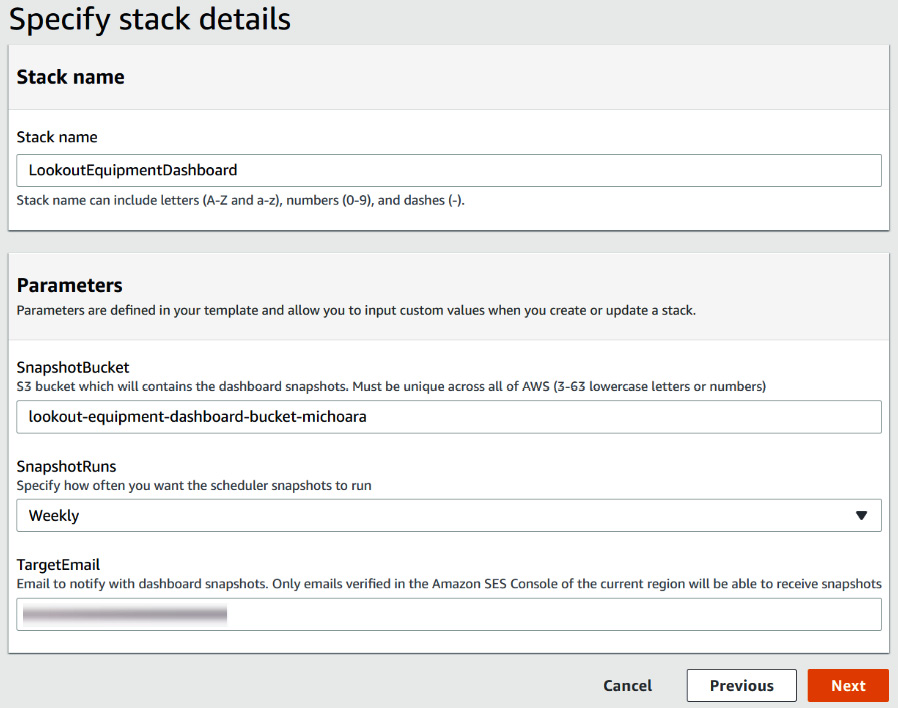
Figure 12.3 – Parameters for the Lookout for Equipment dashboard deployment
- The next page will also be fine with the default values. Click Next to proceed to the Review page. Scroll again to the bottom, check the box to enable the template to create new IAM resources, and then click on Create stack.
- CloudFormation will take a few minutes to create all the resources on your behalf. Once it is completed, you will see a green CREATE_COMPLETE message next to the name of the stack (on the left panel of the CloudFormation console), indicating that the deployment is completed, as shown in the following screenshot:

Figure 12.4 – Template deployed
After deployment, the following resources will have been deployed in your account.

Figure 12.5 – Lookout for Equipment dashboard deployment overview
Now that the template is deployed, you can start using it immediately.
Using the Lookout for Equipment dashboards
Once the template is deployed, use the Services drop-down menu on the top left of the screen to bring up the list of AWS services. In the Management & Governance section, look for the CloudWatch service and click on its name to go to its console. There, click on the Dashboards link on the left menu bar. This will bring you to a page with a list of all the CloudWatch dashboards you have access to in your account, as shown in the following screenshot. You should find two new dashboards that you are going to use to visualize your Amazon Lookout for Equipment models and schedulers.
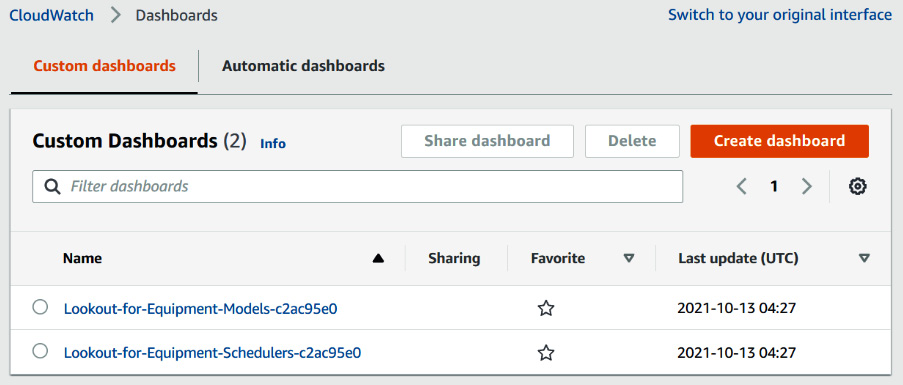
Figure 12.6 – New CloudWatch dashboards
You can use the dashboard with a name starting with Lookout-for-Equipment-Models to manage the models trained in Amazon Lookout for Equipment in your account. The other dashboard will let you do the same with any schedulers configured in your account.
Using the model dashboard
Click on the dashboard with a name starting with Lookout-for-Equipment-Models. This will open a dashboard summarizing all the models that exist in your account.
Important Note
This dashboard uses the CloudWatch Custom Widget feature, which calls a Lambda function in the background to display custom plots. The first time you open such a dashboard, you will see a warning message asking you if you trust these functions before executing them. Click on the Execute them all button located at the top right of the dashboard to run these functions and plot the widget's content.
By default, only the last 50 models trained in the past 3 months are shown, as follows:
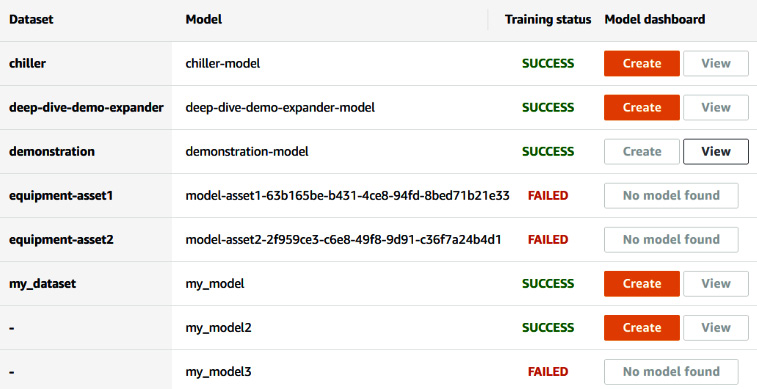
Figure 12.7 – Lookout for Equipment model dashboard
Important Note
Ensure you are running this CloudWatch dashboard in the same AWS region where you created your models.
You can use the date picker on the top right of your screen to limit the models shown. This date picker will use the model training date to filter which ones to display. In this widget, your models' information will be displayed as follows:
- The first column will list all the datasets from the current AWS region in your account.
- The model names are listed in the second column. If several models are built using the same dataset, the dataset name is shared between them and is not repeated.
- In the third column, a training status will let you know whether this model was successfully trained. Only successful training will give you access to the actions of the fourth column.
- The last column gives you two possible actions to perform on successfully trained models:
- You can request the creation of a specific dashboard for a trained model. This will create a new CloudWatch dashboard specifically for this model and will also configure and start a CloudWatch Synthetics canary that will send you a dashboard screenshot to the email you configured when you deployed the CloudFormation template. The dedicated model dashboard and the Synthetics creation can take a few seconds. Then the model list dashboard will be refreshed and the View button will be enabled.
- The View button is enabled when a dashboard exists for a given model (the Create button will then be disabled). Click on this button to navigate to this model's specific CloudWatch dashboard.
When you click on the View button of any trained model, you are brought to another CloudWatch dashboard dedicated to this model. Several widgets will be preconfigured for each of these dashboards:
- Model details
- Detected anomalies
- Aggregated signal importance
- Signal importance evolution
To read more about the insights you can derive thanks to these widgets, check out the Post-processing detected events results in building deeper insights section.
Using the scheduler dashboard
From the CloudWatch dashboard home page, click on the dashboard with a name starting with Lookout-for-Equipment-Schedulers: this will open a dashboard summarizing all the schedulers that exist in your account. As with the model dashboard, only the last 50 schedulers created in the current AWS region in the past 3 months are shown by default, as shown in the following screenshot:
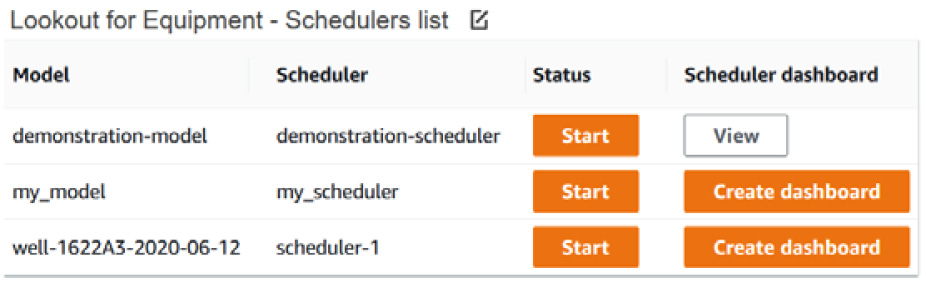
Figure 12.8 – Lookout for Equipment scheduler dashboard
From this dashboard, you can either Start or Stop the schedulers.
Important Note
Bear in mind that running schedulers incurs costs: do not forget to stop a scheduler that you have no more use for.
As with the trained models' evaluation, you can also request the creation of a specific dashboard dedicated to a scheduler. When you create a scheduler's dashboard, you also create a CloudWatch Synthetics canary that will send you a weekly (or daily) dashboard screenshot to the email you configured when you deployed the CloudFormation template. This canary is configured by default to run every Monday morning at 6 a.m. UTC (or on every workday morning at 6 a.m. UTC if you chose the daily option).
The CloudWatch dedicated dashboard and Synthetics canary can take a few seconds to create, then the scheduler list dashboard will be refreshed, and the View button will be enabled.
When you click on the View button of an existing inference scheduler, you are brought to another CloudWatch dashboard dedicated to this scheduler. A couple of widgets are preconfigured:
- Scheduler details
- Last execution diagnostics
In the following section, you will read more about the insights you can derive from these widgets.
Post-processing detected events results in building deeper insights
In this section, you will read about the kind of insights you can derive from post-processing the raw results delivered by Amazon Lookout for Equipment.
Model details
This widget just gives you a reminder of the dataset name, the training period, and the evaluation period, as shown in the following screenshot:

Figure 12.9 – Model details example
Detected anomalies
The detected anomalies are displayed for the evaluation period of the selected model. The dropdown at the top of the widget lets you select which signal you want to plot above the Detected anomalies ribbon to help you relate a given time series behavior with the actual events detected by Amazon Lookout for Equipment.

Figure 12.10 – Detected anomalies example
This widget also plots the following:
- The number of daily events detected: In some situations, you will see the number of events gradually increase before reaching a maximum value. This may be a good indicator of a potential future anomaly.
- The average duration of the detected events.
Aggregated signal importance
This horizontal bar chart aggregates the average importance of up to 15 signals across the evaluation period.
While the native console from Amazon Lookout for Equipment lets you click on every event detected to plot the associated signal importance, this plot lets you understand whether there is a systematic bias toward the same sensors when any event is detected.
In the following screenshot, you can see that sensor_51 is contributing, on average, a lot more than the other signals to the events detected. Plotting this signal will help you understand why this particular sensor has such a large contribution. It may also be an indicator that the sensor behavior is quite noisy and should be removed to train a more robust model.
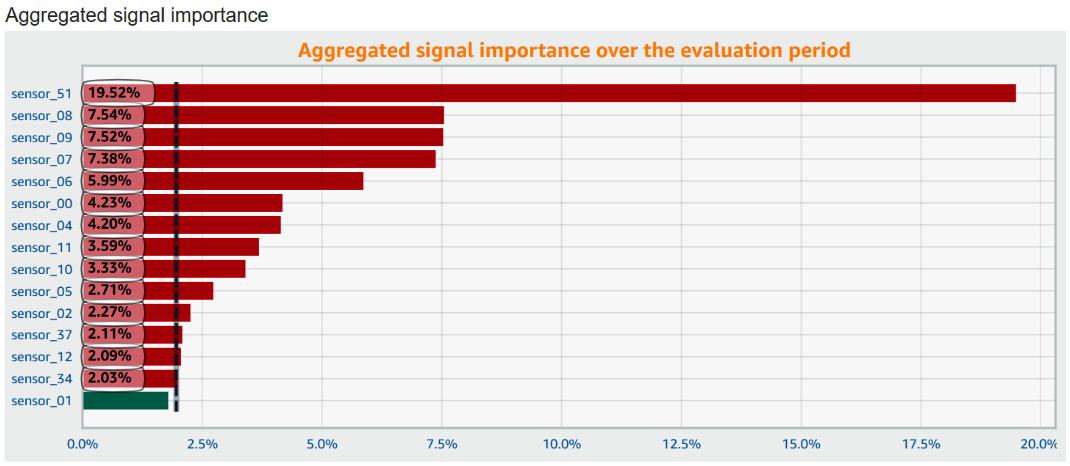
Figure 12.11 – Aggregated signal importance example
The vertical dotted line (located around 2% in the preceding screenshot) materializes the value that each signal importance would have if they were all equally contributing to every anomaly detected. The dataset illustrated here had 50 signals. If every signal was contributing the same way, they would each be ranked at approximately 1/50 = 2.0%. We can now say that the higher contributions from the top 5 signals are definitely statistically significant.
Every signal higher than the black dotted line will have a red bar, whereas the other ones will have a green bar.
Signal importance evolution
The last widget plots the evolution of the feature importance of each signal over time. When numerous events are detected, this plot can become very crowded. At this stage, the feature importance is aggregated at the daily level to help better understand the dynamics of each signal, as shown in the following screenshot:

Figure 12.12 – Signal importance evolution example
In the preceding screenshot you can see the following:
- During the period ranging from 2015-10-15 to 2015-11-01, you can actually see a different dynamic than during the last period.
- This widget will help you understand whether it is possible to match the signal contributions' relationships to different types of failure. Using these as high-quality features leading to anomaly classification will help you further reduce the analysis time for your end users.
Scheduler details
This widget reminds you of the scheduler name and how it is configured.
It also details what it expects as an input (the format and location of the input CSV file to run the inference with). This can be useful when you run into issues with a scheduler that doesn't seem to find your fresh data.

Figure 12.13 – Scheduler details example
Last execution diagnostics
This widget displays the signal ranking for the last anomaly caught by Amazon Lookout for Equipment, as shown in the following screenshot:

Figure 12.14 – Last execution diagnostics example
With these dashboards, you are now equipped to visualize your Lookout for Equipment results quickly and derive valuable insights to help you improve the way you operate the monitored assets or processes. Let's now have a look at some of the best practices you can leverage to monitor your models and detect any drift once your models are deployed.
Monitoring your models
You should also make sure to monitor any potential shift in your data. To do this, you can follow this process:
- Build and store a dataset with the training data of all the time series that you want to use to build an anomaly detection model.
- Compute the statistical characteristics of each time series (for example, average, standard deviation, and histograms of the distribution of values).
- Train your models with these initial datasets and save the performance metrics (how well they capture the anomalies you are interested in).
- When new data comes in, compute the same statistical characteristics and compare them with the original values used at training time.
- You can display these statistics next to the predictions for your analysts to take the appropriate decisions. This will help them better trust the results generated by Amazon Lookout for Equipment. In particular, visualizing a potential distribution shift from training to inference time will help pinpoint whether the model should be retrained with new, fresh data or whether something must actually be investigated from a process perspective.
Once you have this process set up, you will be able to organize regular reviews to analyze any shift in the data or any drift in the performance of your anomaly detection models to decide when is a good time to amend your training datasets and retrain a fresh model.
Automating your training process will be key to making this continuous improvement task as painless as possible. In the next section, you will configure a pipeline that will be able to automatically orchestrate this process.
Orchestrating each step of the process with a serverless architecture
In the preceding chapters, you have been working mainly with the Amazon Lookout for Equipment console, building each step mostly manually. In this section, you will learn how you can build an automatic workflow that will take care of all these steps and inform you when it is finished. You will implement and deploy the components shown in the following screenshot:

Figure 12.15 – Amazon Lookout for Equipment automation diagram
To achieve this, we will focus on the implementation of each key part of this architecture diagram. Namely, we will dive into the following:
- First, you will get an overview of the AWS Step Functions orchestration service.
- Then you will build the key components of your Step Functions workflow (leveraging an AWS Lambda function and orchestrating the different Amazon Lookout for Equipment tasks).
- To trigger your workflow automatically, you will need to know about other AWS cloud services. We will go through a high-level description of AWS CloudTrail and Amazon EventBridge and you will configure them to enable the automatic trigger of your Step Functions workflow when a new file is uploaded in an Amazon S3 bucket containing your training data.
- Finally, you will use Amazon Simple Notification Service, which will send you an email when your workflow is done (either successfully or not).
You will have the option to implement most of these components yourself so that you get a good understanding of each of these components and how they are articulated with each other.
Assembling and configuring the AWS components
In this section, you will learn how to build and configure each service to automate your anomaly detection training workflow. Let's start with an overview of the different services that you will need to use (beyond Amazon Lookout for Equipment and Amazon S3, with which you are already familiar):
- AWS Step Functions: This is a low-code visual workflow service that you can use to orchestrate AWS services and automate any business process. Using this service, you can manage failures, service integrations, and focus on your business logic. You are going to use this service to orchestrate the different steps needed to build a dataset, train a model, and configure an inference scheduler.
- AWS Lambda: This is a computing service that lets you run your code without provisioning and managing any underlying services or infrastructure. You will write a Lambda function that will build the dataset schema based on the actual training data located in an Amazon S3 bucket.
- AWS CloudTrail: This service monitors and records account activity across all your infrastructure and services. It records every API call so that you can react to them. You will configure a trail that will monitor your S3 bucket and trigger an event when a new configuration text file is uploaded at the root of your bucket.
- Amazon EventBridge: This serverless event bus makes it easy to connect event-driven applications using events generated by your applications or any AWS services. You will use EventBridge to trigger your workflow or send a notification whenever this workflow goes through a status change.
- Amazon Simple Notification Service: This messaging service can be used to send messages between applications or between applications and persons. You will use this service to send notifications whenever your training and deployment workflow goes through a status change.
Equipped with this overview, you can now head safely into the first step of your automation journey: assembling the model training and deployment workflow.
Building the anomaly detection workflow
Let's now build the following part of our automation architecture:

Figure 12.16 – Automation pipeline, focusing on the Step Functions
First, we need to create the Lambda function, which will be used to build a data schema to create a dataset in Amazon Lookout for Equipment. As an input, the step function will receive the location of the data and this location will be passed to the AWS Lambda function. This Lambda function will need the same access to the data located in S3 as Amazon Lookout for Equipment. Let's start by updating your access role.
Updating the access role
You will need to update the IAM role you created in Chapter 9, Creating a Dataset and Ingesting Your Data, and you will then need to create your Lambda function. To do all of this, follow these steps:
- If you went through the Technical requirements prerequisites at the beginning of this chapter, you should already be logged in to the AWS console, otherwise, fire up your favorite browser and log in to the AWS console.
- At the top left of your console, you will see a Services drop-down menu that will display all the available AWS services. In the Security, Identity & Compliance section, look for the IAM service and click on its name to go to the IAM console. On the left menu bar, click on the Roles menu and then search for your LookoutEquipmentIndustrialPumpDataAccess role in the list on the right.
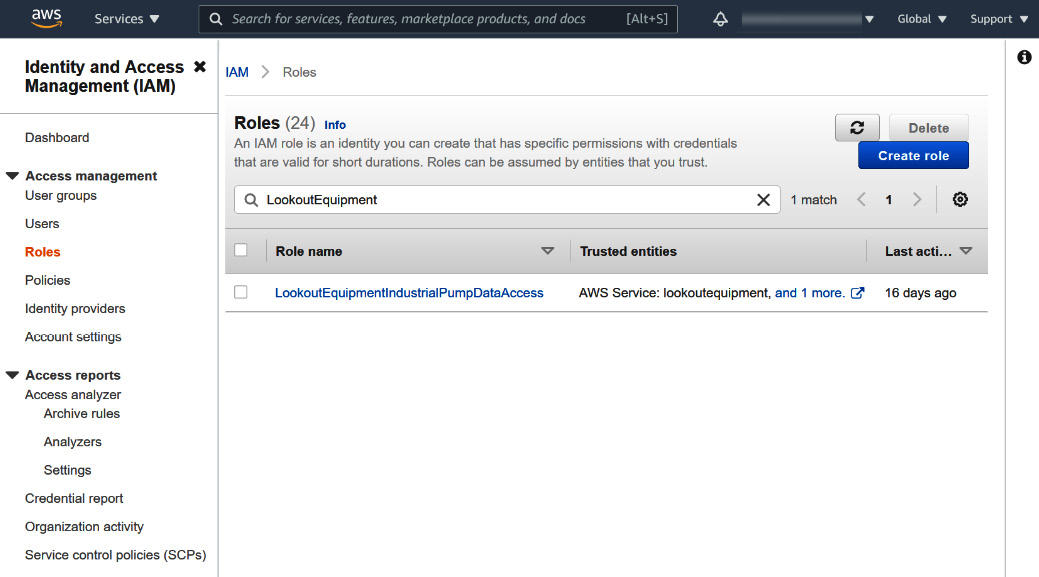
Figure 12.17 – IAM role list
- Click on the name of your role and then click on the Trust relationships tab. Then, click on the Edit trust relationship button.

Figure 12.18 – IAM role trust relationships list
- Update the policy document from your role with the following code. Notice the additional service (lambda.amazonaws.com) that must be allowed to assume this role and access your data in Amazon S3:
{
"Version": "2012-10-17",
"Statement": [
{
"Sid": "",
"Effect": "Allow",
"Principal": {
"Service": [
"lookoutequipment.amazonaws.com",
"lambda.amazonaws.com"
]
},
"Action": "sts:AssumeRole"
}
]
}
- Click on the Update trust policy button. This will bring you back to the role overview.
Your role is now up to date and ready to be used by the AWS Lambda service.
Creating the Lambda function
You can now create the first component of your workflow, namely, a Lambda function that will create the appropriate data schema in JSON format for an input location on Amazon S3. To do so, you will need to follow these steps:
- Use the Services drop-down menu at the top left of the screen to bring up the list of AWS services. In the Compute section, look for the Lambda service and click on its name to go to the AWS Lambda console. By default, you should see a list with all the functions available in your account, otherwise, click on the Functions item in the left menu bar. Then, click on the Create function button.

Figure 12.19 – AWS Lambda console landing page
- Next, you will author a new function from scratch (called create-lookout-equipment-schema) and you will fill in the following fields on the function creation page:
- Function name: Let's call this function create-lookout-equipment-schema.
- Runtime: You will use Python 3.9.
- Select Use an existing role for Execution role.
- In the Existing role dropdown, select the LookoutEquipmentIndustrialPumpDataAccess role you updated earlier.
At the bottom right of this screen, you will find a Create function button; click on it to go to the next page.
- On the next page, at the top right of the Code source section, there is an Upload from drop-down list. Click on it and select Amazon S3 location.

Figure 12.20 – Uploading a Lambda function from Amazon S3
- In the window appearing there, enter the following URL pointing to the code this function will run and click on the Save button:
s3://packt-publishing-timeseries-on-aws-michaelhoarau/part2-amazon-lookout-for-equipment/create-lookout-equipment-schema.zip
Important Note
Make sure to be in the same region as your initial S3 bucket when creating your Lambda function with this zip package. If not, you will see a region-related error.
- You are then brought back to the Code tab from your Lambda function, where your source code should be updated. Click on the Configuration tab and then on the Edit button at the top right.

Figure 12.21 – Lambda function configuration
- Enter 256 MB for Memory and select 10 seconds for Timeout. This should be enough for the processing that happens in this function (mainly opening the first row of several CSV files to look for their header content). Then, click on the Save button.

Figure 12.22 – Lambda function basic settings
- When you are back to the Lambda function overview, click on the Copy ARN button located at the top right of the screen and paste it into a text file that you will keep handy for the next section (where you will create a workflow starting with this function). Your ARN will have a format similar to this: arn:aws:lambda:eu-west-1:<<ACCOUNT-ID>>:function:create-lookout-equipment-schema (where <<ACCOUNT-ID>> will be replaced by the ID of your AWS account).
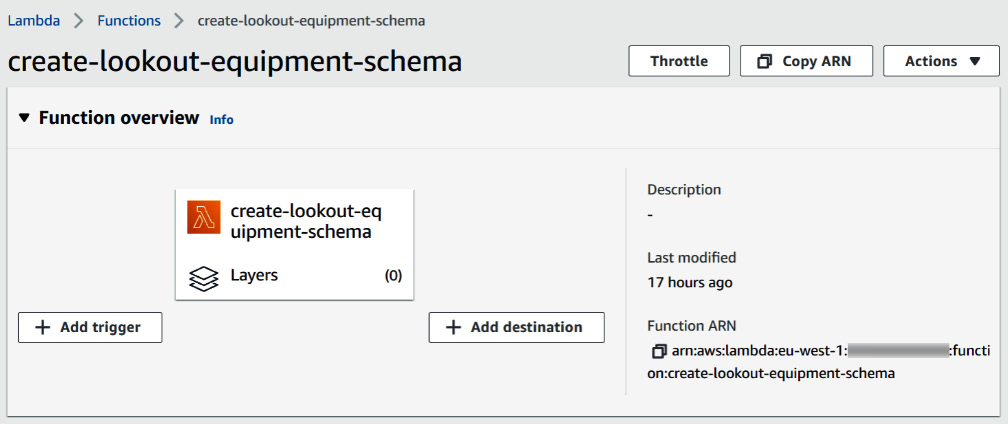
Figure 12.23 – Lambda function overview
We have now configured a Lambda function and can now configure the actual workflow.
Building the workflow
We will build the actual workflow, using the AWS Step Functions service. To do so, let's follow these steps:
- Use the Services drop-down menu at the top left of the screen to bring up the list of AWS services. In the Application Integration section, look for the Step Functions service and click on its name to go to the AWS Step Functions console. Click on the hamburger menu (the three horizontal lines) at the top left of the window and then click on the State machines tab and finally, on the Create state machine button.

Figure 12.24 – State machines list
- On the Define state machine screen, select Write your workflow in code at the top and select the Standard type.
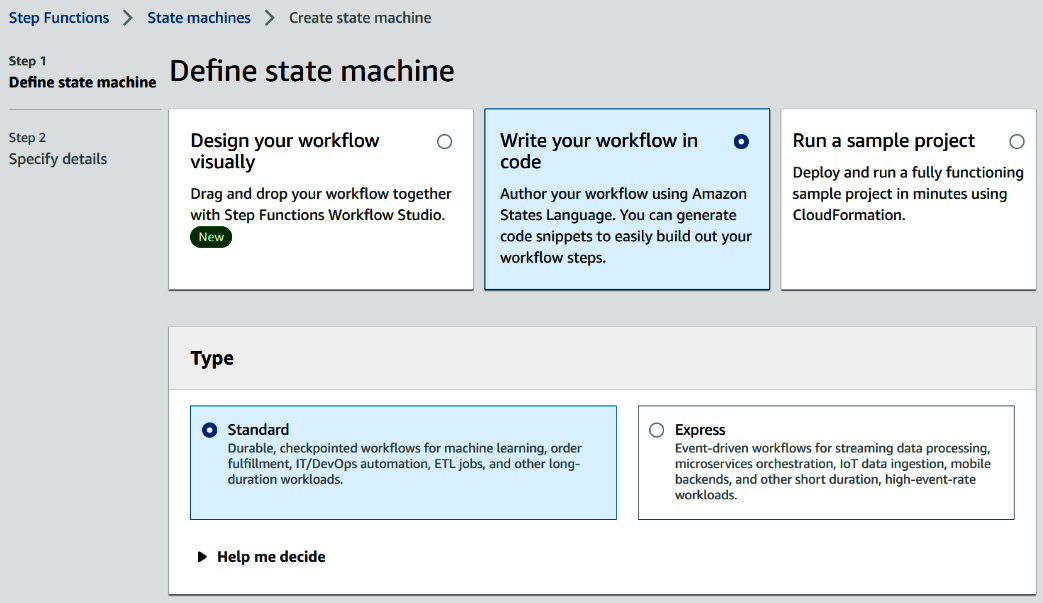
Figure 12.25 – State machine definition
- Download the following file:
- Open the preceding text file and search for the following string: <<LAMBDA_ARN>>. Replace this string with the ARN of the Lambda function you copied previously (at the end of the Lambda function definition).
- Copy the whole content of your text file (with the updated Lambda function ARN) into the Definition area of your state function. The workflow on the right is updated with the actual flow of the state machine.

Figure 12.26 – State machine definition
- Click on the Next button located at the bottom right. This will bring up a second screen where you will be able to specify other details for your workflow.
- On the next screen, you can specify a name for your state machine. I called mine LookoutEquipmentAutomationPipeline. Leave all the other fields as their default values and click on the Create state machine button located at the bottom of your screen.
- This will bring you to a screen with the details of your newly created state machine. Click on the Edit role in IAM button at the top to update the role used by the state machine so that it can call the Amazon Lookout for Equipment API function.
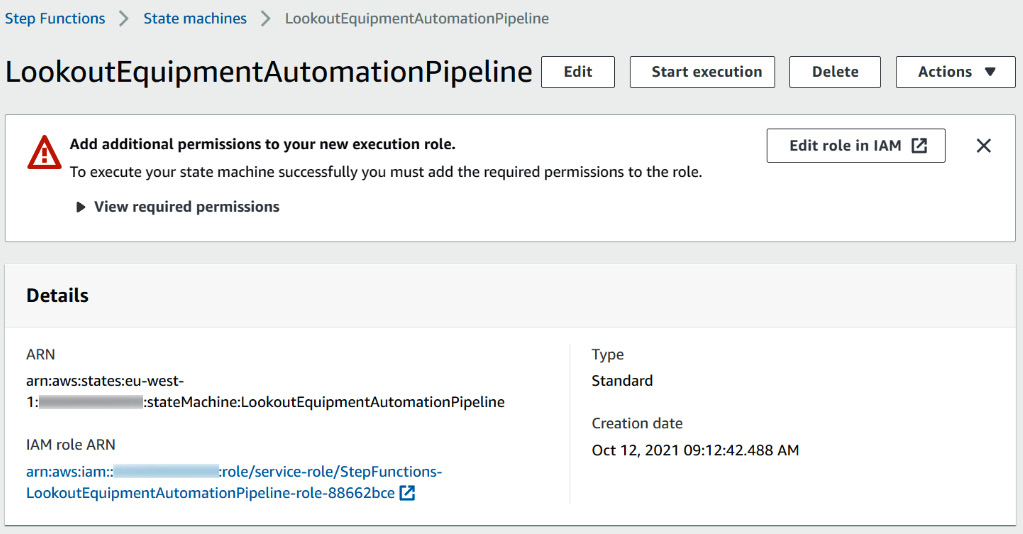
Figure 12.27 – State machine details
- The default role created by the AWS Step Functions service will have the ability to call the Lambda function but is not authorized to call the Amazon Lookout for Equipment API (as a reminder, for security reasons, AWS services only have permissions that you explicitly give them). On the Roles Permissions tab, click on Attach policies.
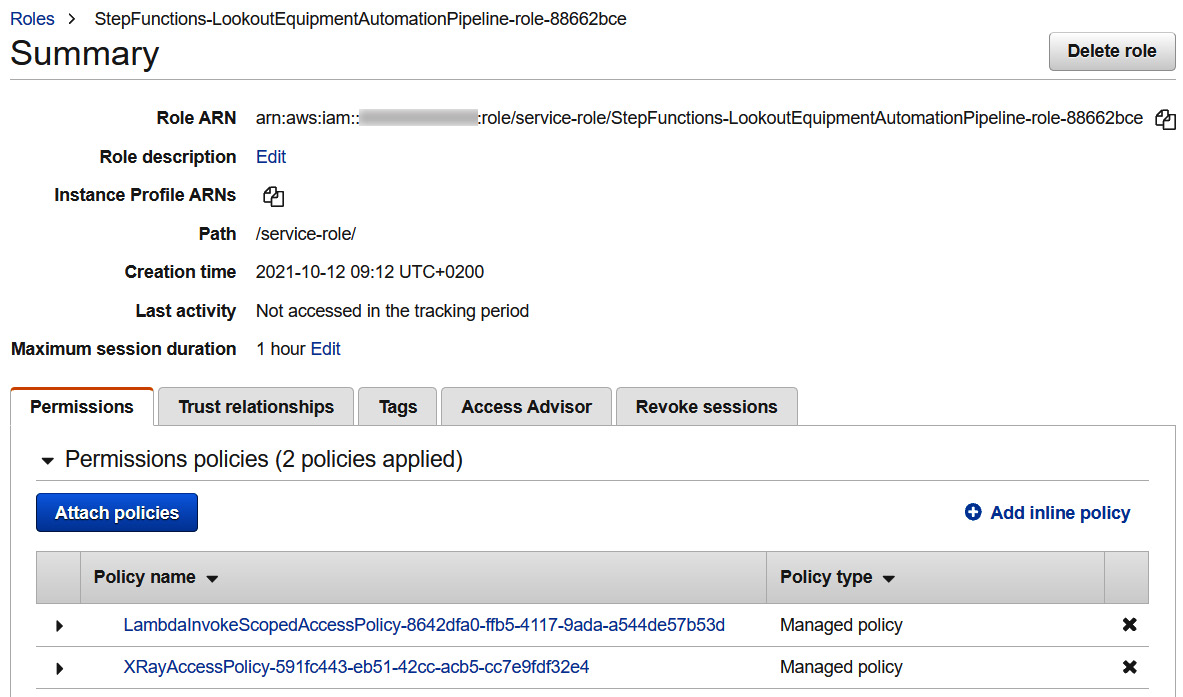
Figure 12.28 – State machine default role definition
- Search for the LookoutEquipment string in the Filter policies field at the top of the screen and check the box next to AmazonLookoutEquipmentFullAccess. Then, click on the Attach policy button located at the bottom of the screen:
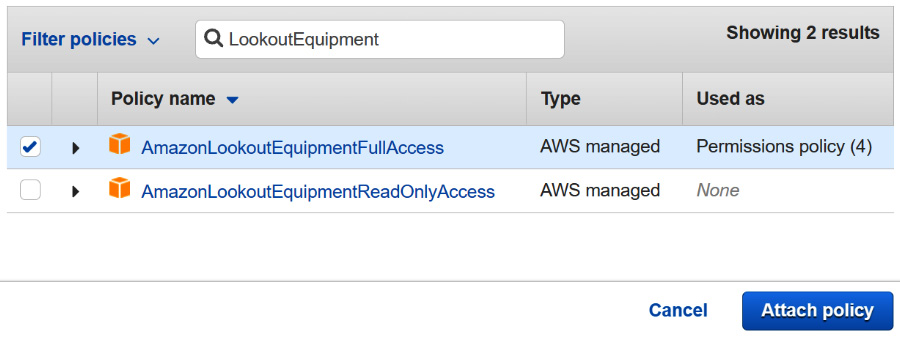
Figure 12.29 – Attaching a new policy to the state machine role
In this section, you performed the following tasks:
- You updated the role you already used to access data in Amazon S3 to allow a Lambda function to assume this role.
- Then, you created a Lambda function that is used to create a valid data schema ready to be used by Amazon Lookout for Equipment to create a new dataset.
- You then proceeded to create a state machine (or workflow) in AWS Step Functions to orchestrate the different steps in your automation pipeline.
- You finished the process by making sure your workflow has all the permissions it needs to call Lambda functions and Amazon Lookout for Equipment API methods.
You will now set up an automatic trigger to react to a new file uploaded to an S3 bucket: this trigger will launch the workflow you just defined.
Configuring the automatic trigger
We will now build the following part of our automation pipeline:
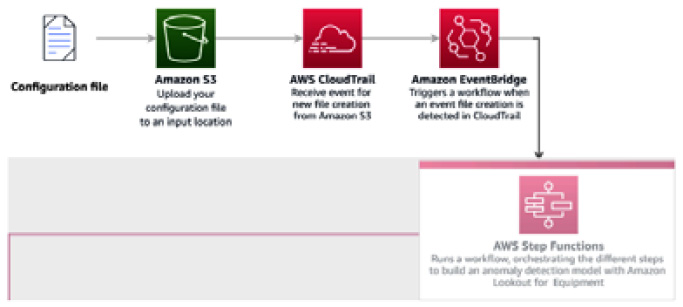
Figure 12.30 – Automation pipeline, focusing on the trigger step
You already have an Amazon S3 bucket that you have been using to store your training and inference data. We are going to create a trail in AWS CloudTrail that will log every event happening in this bucket. To do this, follow these steps:
- Use the Services drop-down menu at the top left of the screen to bring up the list of AWS services. In the Management & Governance section, look for the CloudTrail service and click on its name to go to its console. From the service dashboard, click on the Create trail button.
- For Trail name, enter LookoutEquipmentAutomationS3Event.
- Disable the Log file SSE-KMS encryption checkbox if you do not want to encrypt the log files of the trail (if you do, you will have to provide an encryption key). Scroll down to click on the Next button.
- On the second step of the trail creation, uncheck the Management events checkbox and check the Data events checkbox.

Figure 12.31 – Events type selection for new trail creation
- In the Data event section of the screen, select S3 for Data event source and uncheck the Read and Write checkboxes for All current and future S3 buckets. Then, under Individual bucket selection, fill in the name of your bucket and add /config- after your bucket name. In my case, I will use the following value for this parameter: timeseries-on-aws-lookout-equipment-michaelhoarau/config-. This will tell CloudTrail that we only want to monitor events associated with the uploading of a file with a name that starts with config- and located at the root of our bucket. Then, just check the Write boxes (we only want to detect when a new file is created).
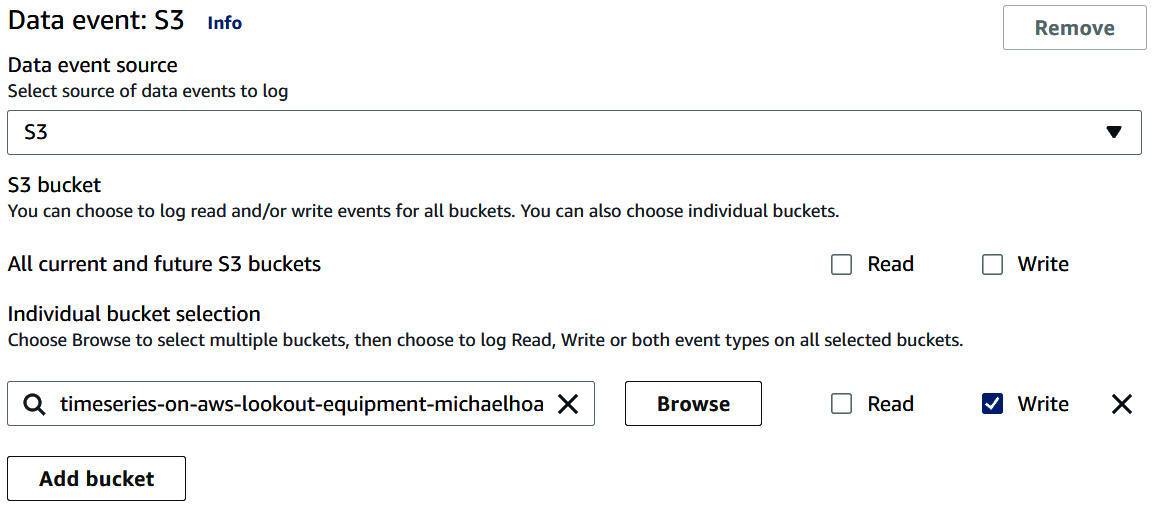
Figure 12.32 – Data event configuration
- Scroll down and click on the Next button at the bottom. As the last step, scroll all the way down and click on Create trail.
Now that a trail has been configured, all the events captured in this trail are also sent to Amazon EventBridge.
Configuring Amazon EventBridge
Let's now navigate to Amazon EventBridge to actually catch this event and trigger our workflow:
- Use the Services drop-down menu at the top left of the screen to bring up the list of AWS services. In the Application Integration section, look for the Amazon EventBridge service and click on its name to go to its console. From the service home page, click on the Create rule button.
- Give a name to your rule: LookoutEquipmentPipelineTrigger.
- In the Define pattern section, select the Event pattern radio button and then Pre-defined pattern by service. Select AWS for the Service provider field, Simple Storage Service (S3) for Service name, and Object Level Operations for Event type:

Figure 12.33 – EventBridge pattern definition
- Select the Specific operation(s) radio button and select the PutObject operation from the drop-down list. Then, select Specific bucket(s) by name and fill in the name of your bucket (timeseries-on-aws-lookout-equipment-michaelhoarau in my case).

Figure 12.34 – EventBridge operations to be captured
- Scroll down to the Select targets section of the screen. Select Step Functions state machine for Target and choose LookoutEquipmentAutomationPipeline in the State machine dropdown. Leave all the other parameters untouched (including the new role creation).

Figure 12.35 – EventBridge target selection
Your trigger is now ready. The last step is to set up a notification once the step function is done.
Configuring the notification
We will now build the last part of our architecture, the notification service configuration. To achieve this final task, you will once again use Amazon EventBridge and use it to send a message to an Amazon Simple Notification Service (SNS) queue each time your workflow status changes. To do this, you can take these actions:
- Use the Services drop-down menu at the top left of the screen to bring up the list of AWS services. In the Application Integration section, look for Simple Notification Service and click on it to go to its console. From the service home page, set Topic name to LookoutEquipmentWorkflowStatusUpdate and click on the Next step button.
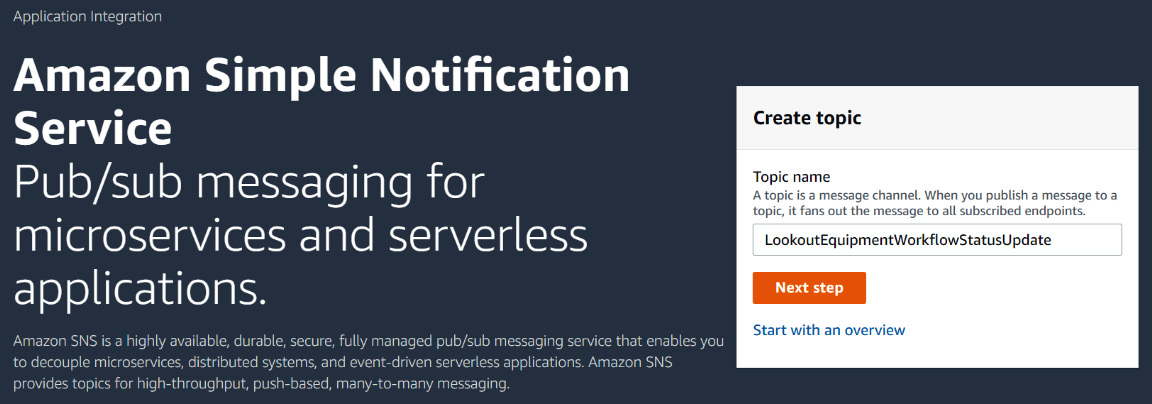
Figure 12.36 – Creating a new SNS topic
- On the next screen, leave all the fields as their default values, scroll down to the bottom of the page, and click on the Create topic button. Your topic will be created and a summary dashboard will be displayed. In the Subscriptions section, click on Create subscription.
- In the Details section of the Create subscription screen, enter Email for Protocol and your email address for Endpoint.

Figure 12.37 – Creating a subscription to an existing SNS topic
- Scroll down and click on the Create subscription button. You will receive an email after a few seconds with the subject titled AWS Notification – Subscription Confirmation. Click on the Confirm subscription link that you will find in this message: your email address is now subscribed to this SNS topic. This means that any message sent to this topic will be delivered to your email address.
Now that your notification delivery is configured, you will go back into Amazon EventBridge to connect your workflow status change to this topic. To do this, follow these steps:
- Use the Services drop-down menu at the top left of the screen to bring up the list of AWS services. In the Application Integration section, look for the Amazon EventBridge service and click on its name to go to its console. From the service home page, click on the Create rule button.
- Give a Name to your rule: LookoutEquipmentPipelineStatusChange.
- In the Define pattern section, select the Event pattern radio button and then Pre-defined pattern by service. Select AWS for Service provider, Step Functions for Service name, and Step Functions Execution Status Change for Event type. Then, select Specific state machine ARN(s) and enter the ARN of the workflow you created earlier. This ARN will have the following format: arn:aws:states:eu-west-1:<<ACCOUNT_ID>>:stateMachine:LookoutEquipmentAutomationPipeline, where <<ACCOUNT_ID>> is your AWS account ID.
- Scroll down to the Select targets section of the screen. Select SNS Topic for Target and choose LookoutEquipmentWorkflowStatusUpdate in the Topic dropdown. Leave all the other parameters untouched (including the new role creation).

Figure 12.38 – Event target definition
Your notifications are now ready to be triggered. Let's test your pipeline!
Testing the pipeline
Your automation pipeline is ready – let's test it! Open your favorite text editor and write the following in it:
{
"train_prefix": "train-data/",
"label_prefix": "label-data/",
"sampling_rate": "PT5M",
"dataset_name": "pump",
"model_name": "pump_model",
"scheduler_name": "pump_scheduler",
"access_role": "LookoutEquipmentIndustrialPumpDataAccess",
"training_start": "2018-04-01",
"training_end": "2018-10-31",
"evaluation_start": "2018-11-01",
"evaluation_end": "2020-05-04"
}
Then, to test your pipeline, you will follow these steps:
- Save this file under the name config-example.txt (or any name that starts with config-).
- Connect to the AWS Console and navigate to the Amazon S3 service. Find your bucket and click on its name.
- Upload the text file you just created at the root of your bucket. Your bucket files list should look similar to the following screenshot:

Figure 12.39 – Amazon S3 bucket files list
- Navigate to the AWS Step Functions console and click on the name of the state machine you created earlier. In the Executions list section, you should see an execution with the Running status. Click on this execution.
- In the Graph inspector section, you should see your process running and, after a while, your process should be successful with all the steps highlighted and marked as successful.
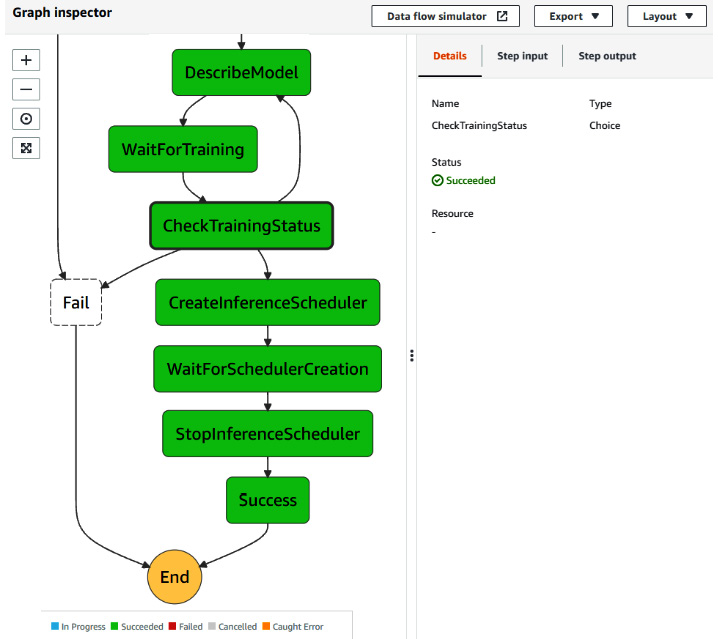
Figure 12.40 – Successful automation pipeline
- Check your email. You should have received two new messages, one when your workflow started running, and the other when the workflow was done.
Note
We did not customize the content of the notification email: they are rather nondescript for a non-developer as you receive the actual JSON payload as a raw notification. In an actual production system for business users, you might want to customize these emails to make them more user friendly. You would achieve this by expanding the Configure input section when you define the target in Amazon EventBridge. There, you can select Input transformer to transform this JSON raw data into an actual English sentence.
Congratulations for reaching the end of this section! You now have all the tools to automate a whole anomaly detection pipeline for your industrial time series!
Summary
In this final chapter dedicated to Amazon Lookout for Equipment, you learned how to build dashboards that will be useful to get detailed visualizations of your model and inference results. You also built your first automation pipeline, to let the AWS orchestration services do all the heavy lifting for you while you focus on the model results.
This chapter was especially important to understand how to improve your anomaly detection models and how to automate most of the tasks to iterate as fast as possible.
In the next chapter, you will switch to another anomaly detection managed service, but dedicated to business metrics instead of industrial time series: Amazon Lookout for Metrics.