Chapter 8: An Overview of Amazon Lookout for Equipment
In this chapter, you will learn what Amazon Lookout for Equipment can do, how it works, and the kinds of applications it's better suited for. You will also understand, at a high level, how to prepare your dataset and how to integrate the service results into your own business process.
Along with Amazon Forecast and Amazon Lookout for Metrics (which you will learn about in the last part of this book), Amazon Lookout for Equipment is one of the artificial intelligence (AI)-/machine learning (ML)-managed services dedicated to problems that are structured around time series data. Amazon Lookout for Equipment is an anomaly detection service that can provide valuable insights into industrial equipment and predictive maintenance teams.
In this chapter, we're going to cover the following main topics:
- What is Amazon Lookout for Equipment?
- What are the different approaches to tackle anomaly detection?
- The challenges encountered with multivariate time series data
- How does Amazon Lookout for Equipment work?
- How do you choose the right applications?
Technical requirements
No hands-on experience in a language such as Python or R is necessary to follow along with the content of this chapter. However, we highly recommend that you follow along in the AWS console, where you can access the Amazon Lookout for Equipment service.
If you already have an AWS account, you can connect to the AWS console, click on the search bar at the top, and enter Lookout for Equipment in the Services section. Then, click on Amazon Lookout for Equipment to bring up the landing page of the service console.
If you don't have an AWS account, you will need to create one before you can log in to your console. To create an AWS account and log in to the Amazon Forecast console, please refer to the Technical requirements section of Chapter 2, An Overview of Amazon Forecast.
Now you are ready to use Amazon Lookout for Equipment!
What is Amazon Lookout for Equipment?
Amazon Lookout for Equipment is one of the AI/ML-managed services available on the AWS Cloud platform. This service leverages the data from sensors on your industrial equipment and automatically trains unsupervised ML models based on the specific data from this equipment without the requirement of any ML expertise. Amazon Lookout for Equipment analyzes your incoming sensor time series data to flag early warning signs (such as events) that could lead to an anomaly or a failure in your equipment or manufacturing process. Amazon Lookout for Equipment is asset agnostic. This means that beyond the time series data, you do not need to provide the characteristics of the process or equipment (for example, the make and model of the equipment, the units of measure of the time series data, the age of the asset, and more) that you are monitoring to use the service.
Managed services are services where only end-users bring their data and configure the parameters to suit their needs. All the other tasks, considered to be undifferentiated heavy lifting, are performed on the users' behalf by the service. This includes the automation of all the infrastructure management. As an Amazon Lookout for Equipment user, you don't have to provision and manage virtual machines, configure user accounts, implement security, plan for scalability if your request volume increases, or decommission unused resources.
In the case of AI/ML managed services, some data preparation, ingestion tasks, and model management activities are also performed under the hood, allowing you to focus primarily on the problem to solve. Amazon Lookout for Equipment is a scalable, managed service that automates the whole end-to-end anomaly detection pipeline from data ingestion to model deployment and serving inference results. Additionally, the service deals with data preparation under the hood. Amazon Lookout for Equipment can perform the following functions:
- It can fill missing values in your datasets for you.
- It can deal with misaligned timestamps (that is, time series that don't share a common date time index between them).
- It can prepare the time series so that it can be ingested by multiple algorithms. Amazon Lookout for Equipment can prepare the appropriate time series dataset for both deep learning or statistical models suitable for anomaly detection.
- It can compute a smart threshold based on your historical time series data to decide whether a given data point should be flagged as an anomaly or not. Many unsupervised approaches require you to provide a contamination level, that is, the ratio of outliers or anomalies present in the dataset. This contamination level is used to define a threshold for the decision function that will determine whether a given data point is normal or not. Unfortunately, this is a parameter that you have to provide, and that will likely depend on your datasets. Changing this value can yield significant changes in the result, making the approach difficult to scale beyond one use case. Amazon Lookout for Equipment abstracts away this challenge for you.
- It can perform hyperparameter tuning to find the best parameters for you.
Now that you have a good understanding of what Amazon Lookout for Equipment can do for you, let's dive deeper into the challenges arising with anomaly detection when you want to tackle it without using this type of service.
What are the different approaches to tackle anomaly detection?
Before we dive into Amazon Lookout for Equipment, first, we are going to look at a few definitions. In this section, you will read about the different types of anomalies before getting a high-level overview of the different methods you can use to build your own anomaly detection models.
What is an anomaly?
An anomaly in a time series is usually defined as an observation or sequence of observations that do not follow the expected behavior of the series. For example, you could have point anomalies (in other words, single events that are only recorded at a single timestamp):

Figure 8.1 – Single-event anomalies
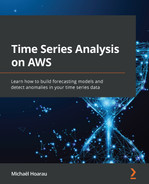
Additionally, you might have a sequence of data points that can be viewed as a suspicious event with a longer time range:

Figure 8.2 – Event range anomalies
These sequences of anomalies are more challenging to identify than point anomalies as they can vary in duration.
Additionally, you might have a whole time series that is considered an anomaly: the ECG200 dataset is often used as a benchmark for time series classification. The electrical activity recorded during human heartbeats can be labeled as normal or ischemia (myocardial infarction). Each time series, as a whole, is either characterized as normal or abnormal, as shown in the following screenshot:

Figure 8.3 – Heartbeat activity for 100 patients (the ECG200 dataset)
In the remaining part of this chapter, we are going to focus on single-event and event range anomalies, as time series classification is not the purpose of Amazon Lookout for Equipment. Such classification can be performed through dimensionality reduction or dissimilarity techniques.
Now, let's take a look at the different families of approaches you can leverage to build anomaly detection systems.
Model-based approaches
Model-based methods detect anomalies by computing the distance between an actual observation (or a set of observations for a multivariate dataset) and its expected value. An observation, ![]() (which can either be a single value in the univariate case or a vector in the multivariate case), is considered an anomaly if its distance from the expected value,
(which can either be a single value in the univariate case or a vector in the multivariate case), is considered an anomaly if its distance from the expected value, ![]() , is greater than a given threshold,
, is greater than a given threshold, ![]() . Each method has its own way of computing this threshold and the expected values of a given time series.
. Each method has its own way of computing this threshold and the expected values of a given time series.
Estimation models
Estimation models use past and future values of ![]() . Examples of estimation model-based methods use median or median absolute deviation to compute
. Examples of estimation model-based methods use median or median absolute deviation to compute ![]() . Other methods model univariate time series data using smoothing methods such as B-splines, kernels, exponentially weighted moving averages, slope constraints, and Gaussian mixture models (https://doi.org/10.1109/SPW.2017.9). You can find an implementation of the Gaussian mixture in scikit-learn at https://scikit-learn.org/stable/modules/generated/sklearn.mixture.GaussianMixture.html.
. Other methods model univariate time series data using smoothing methods such as B-splines, kernels, exponentially weighted moving averages, slope constraints, and Gaussian mixture models (https://doi.org/10.1109/SPW.2017.9). You can find an implementation of the Gaussian mixture in scikit-learn at https://scikit-learn.org/stable/modules/generated/sklearn.mixture.GaussianMixture.html.
Isolation forest algorithms can be applied to a whole time series to assign an anomaly score to each observation. It is then up to you to define the appropriate threshold that will help you isolate the anomalies of interest for your business case. An example implementation of isolation forest can be found in scikit-learn at https://scikit-learn.org/stable/modules/generated/sklearn.ensemble.IsolationForest.html.
A robust variant of isolation forest can also be found in the built-in SageMaker Random Cut Forest algorithm at https://docs.aws.amazon.com/sagemaker/latest/dg/randomcutforest.html.
In a multivariate setting, an autoencoder is a type of neural network that learns the normal behavior of a set of signals and generates large reconstruction errors when encountering anomalies. As such, autoencoders can be considered a semi-supervised approach; this is because you only need to ensure the model is fed with a time series that has no anomalies (you don't need to precisely label each anomaly).
Prediction models
These models only use past values of ![]() . This family of methods can be used to stream data where future values are not known when inference is requested. Several statistical and neural network methods have been devised in this family, as follows:
. This family of methods can be used to stream data where future values are not known when inference is requested. Several statistical and neural network methods have been devised in this family, as follows:
- For instance, some methods leverage ARIMA models under the hood to fit the data and predict the expected values of the time series.
- DeepAnT is an example of a deep learning model (https://doi.org/10.1109/ACCESS.2018.2886457) from this family. DeepAnT can be leveraged on both univariate and multivariate time series. To model both the temporal dependency and the correlation between multiple time series of a dataset, the Contextual Hidden Markov Model (CHMM) has been devised.
- Extreme value theory is leveraged in the Streaming Peak-over-Threshold (SPOT) and DSPOT (that is, SPOT with drift) methods for univariate time series (please refer to http://dx.doi.org/10.1145/3097983.3098144) and in Variational Autoencoders (VAEs) for multivariate cases. Extreme value theory allows these models to automatically select the right threshold value to mark observations as normal or anomalies.
Other anomaly detection methods
Other univariate and multivariate methods have been designed to capture anomalies based on different representations (or encodings) of both univariate and multivariate datasets, as follows:
- Density-based methods: These types of methods classify any given observation as an outlier if less than N observations lie within a certain distance from them. When dealing with time series data, several authors have suggested slicing the time series into successive sliding windows to take the temporality of such data into account.
- Histogram-based methods: The histogramming technique creates a compact representation of a time series by replacing the time series with an HB histogram with B bins. For instance, it is possible to collapse the values of consecutive data points into a single value (for example, their average).
- Dissimilarity-based methods: These multivariate methods have been devised to measure the pairwise dissimilarity between multivariate points. For instance, you can measure the similarity of each consecutive vector and classify any anomalies when the dissimilarity is higher than a certain threshold.
Using univariate methods with a multivariate dataset
In the previous review, we hinted at several methods that have been expressly built for multivariate datasets. However, given that a multivariate time series dataset is an assembly of many univariate time series, you can also apply any of the univariate methods discussed in the preceding section. However, note that the dependencies between the different signals of a multivariate dataset would be lost, leading to methods where the dataset is simplified from multiple (potentially) correlated time series into a lower number of independent univariate time series.
Dimensionality reduction methods can be applied to achieve this outcome before you apply your univariate anomaly detection technique of choice to discover multivariate anomalies.
Now that we have reviewed a selection of approaches to tackle anomaly detection in a time series, we will focus on the specific challenges you might encounter when dealing with multivariate time series.
The challenges encountered with multivariate time series data
You can find both single-event and event range anomalies across multivariate time series data. However, the multivariate nature of your problems also gives you more context, and you could start seeing some anomalies because the relationships between the different signals start to diverge from their normal conditions. Let's dive deeper into the following figure (also Figure 8.2):
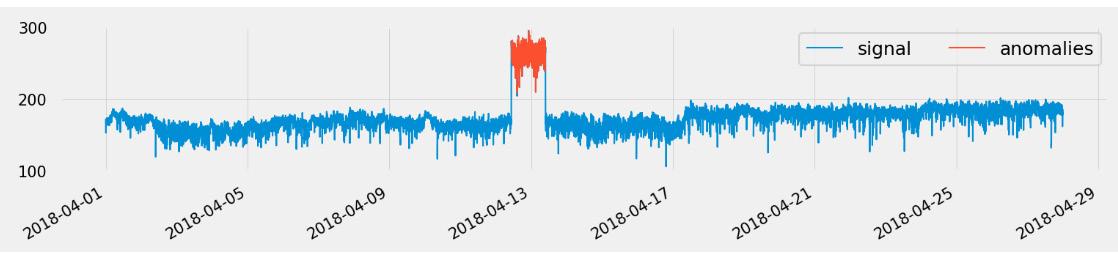
Figure 8.4 – Event range anomalies
This signal is actually part of a multivariate dataset with 51 sensors collecting data from a pump in a water treatment facility. Let's plot this same signal along with a second one, as follows:
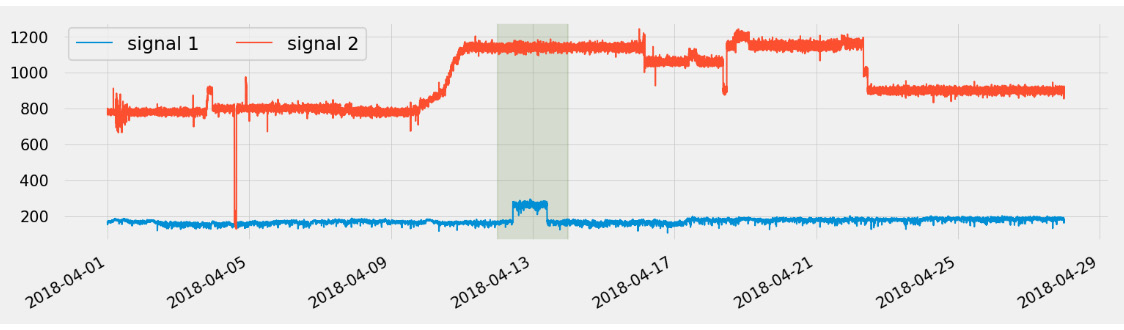
Figure 8.5 – Multivariate time series anomalies
As you can see, when adding this contextual information, you might not label the highlighted area as an anomaly, as this might be the normal behavior of signal 1 (the one at the bottom), when signal 2 (at the top) shifts from an average of 800 to an average of 1,150. On the other hand, it appears as though something is happening around April 17, so you might have to expand this context and plot other signals to confirm this hunch.
As you can see, defining anomalies in a multivariate setting now becomes very challenging as it requires you to build a holistic view of every single signal while keeping in mind the relationship of each signal with every other signal. This is where the capability of deep learning algorithms to uncover complex non-linear relationships between multiple time series signals comes in handy!
Now you are ready to dive into how Amazon Lookout for Equipment can help you to tackle all of these challenges.
How does Amazon Lookout for Equipment work?
In this section, you will learn how Amazon Lookout for Equipment works by first looking at the different concepts manipulated by the service. Then, you will dive deeper into how these concepts are orchestrated together to build anomaly detection models. This section will then end with an overview of the pricing model used by this service.
Defining the key concepts
To build anomaly detection models, Amazon Lookout for Equipment deals with the following concepts and resources:
- Tags: A tag is the name of a time series and can be linked to a sensor, an equipment-monitored condition, or a process variable. In this chapter, we will use the terms tags, signals, and sensors indifferently.
- Datasets: A dataset is a container to host your time series data. The Amazon Lookout for Equipment algorithms use these datasets to train their models. Each dataset is defined by a schema where you can define the list of time series tags.
- Components: When defining the data schema of a dataset, you have the ability to group tags into components. This is an artificial construct that has no impact on the modeling process. However, it will give you the ability to easily train models on subsets of sensors linked to different components. Depending on what you are trying to model, you can use the component level to structure your sensors into different pieces of equipment on a single manufacturing line, regroup them in different facilities, or choose to organize them depending on their unit of measure.
- Labels: Although Amazon Lookout for Equipment only uses unsupervised approaches, you can also feed the training process with known time ranges, where you understand the time series behavior is not representative of the normal operating modes of your asset or process. Usually, these labels cover historical maintenance periods or known anomalous ranges that will be used to rank the tested algorithms at training time (please refer to the Amazon Lookout for Equipment workflow overview section in this chapter).
- Models: Amazon Lookout for Equipment has access to more than 28,000 combinations of models and hyperparameter configurations. The service has access to this bank of models when selecting the one that is more suitable for your dataset given the presence of labels or no labels. The algorithm choice is abstracted away from you, and the applied science team behind Amazon Lookout for Equipment tirelessly researches new algorithms and combinations to enrich this model bank.
- Schedulers: Once a model has been trained, you have the ability to schedule regular inferences every 5, 10, 15, 30, or 60 minutes. The inference scheduler will wake up at the chosen interval to look for new data in a certain location on Amazon S3, run it through your trained model, and store the inference results back on Amazon S3 where they will be available for further processing.
Now, let's take a look at how all these concepts are used by Amazon Lookout for Equipment to train and run anomaly detection models.
Amazon Lookout for Equipment workflow overview
Building an unsupervised anomaly detection process involves two steps:
- We start by looking at historical time series to model the normal behavior of your equipment or process as characterized by this data. This establishes the baseline of the asset.
- Then, we use this knowledge to flag any deviation in the relationships between the multivariate time series as an anomaly.
As depicted in the following diagram, Amazon Lookout for Equipment provides an approach to tackle the two preceding steps:
Figure 8.6 – An overview of Amazon Lookout for Equipment
Let's dive into this diagram to explain the different steps you have to go through to use Amazon Lookout for Equipment:
- Uploading and ingesting data into the service: This will be thoroughly detailed in Chapter 9, Creating a Dataset and Ingesting Your Data. Amazon Lookout for Equipment can use data that is located in Amazon Simple Storage Service (S3; a scalable data storage infrastructure used to store any kind of object or dataset). At ingestion time, Amazon Lookout for Equipment inspects your data and returns any errors that might prevent the proper training of an anomaly detection model (such as missing signals concerning your dataset schema or signals with too few values).
- Training a model, as described in Chapter 10, Training and Evaluating a Model: Depending on the performance obtained, you can iterate over the data ingestion and training steps a few times to achieve the desired performance.
- Once you have a model that you are happy with, you can start scheduling inferences for it. When you configure and start a scheduler, Amazon Lookout for Equipment will regularly wake it up to feed it with newly available data. The inference results will be returned to Amazon S3 for further postprocessing.
You should now have a high-level understanding of how you can leverage this service to integrate it into your own anomaly detection systems. The last piece of information you will need is a clear understanding of the pricing model so that you can better optimize the way you use this service.
Pricing
As with many AWS services, you only pay for what you use with no upfront commitment. Although the cost of the service is minimal to build a proof of concept (especially if you can benefit from the free tier), there are three dimensions to consider when operationalizing an anomaly detection pipeline with Amazon Lookout for Equipment. These are as follows:
- Storage: Data is ingested and prepared to ensure the fastest training time by Amazon Lookout for Equipment. Storage is priced for each GB of historical data ingested in the service to train your model. There is no ingestion charge for the data used for inferencing.
- Training hours: Each time you train a new custom model based on your data, you are billed for the number of hours of training. Amazon Lookout for Equipment will provide the appropriate number of compute resources to train multiple models in parallel and pick the best one more quickly. For instance, if your model is ready within an hour and the service has provisioned a compute resource that is 4 times the baseline, the actual number of hours billed will be equivalent to the number of compute resources actually provisioned (that is, 4 hours).
- Inference hours: You are billed for each hour of inference that a scheduler is running for, regardless of the configured frequency. The inference charges are rounded up to the nearest hour.
If this is the first time you use Amazon Lookout for Equipment with any given account, you have access to a free tier that will allow you to use the service for free for 1 month. During this period, you will not be charged if you use the following services:
- Storage: Less than 50 GB of historical data ingestion
- Training hours: Less than 250 training hours
- Inference hours: Less than 168 hours of scheduled inference
AWS service developers work relentlessly at reducing the operational costs of the services, and price reductions happen regularly. At the time of writing, the pricing of these components are as follows:
- Storage: $0.20 per GB
- Training hours: $0.24 per hour
- Inference hours: $0.25 per hour
For the most up-to-date pricing, you can check the Amazon Lookout for Equipment pricing page:
https://aws.amazon.com/lookout-for-equipment/pricing/
This pricing overview ends my presentation of Amazon Lookout for Equipment. In the next section, you will look at the different requirements your applications need to satisfy to successfully leverage the capability of this service.
How do you choose the right applications?
You have successfully framed your ML project as an anomaly detection problem, and you have collected some historical time series datasets. So, is Amazon Lookout for Equipment a good candidate to deliver the desired insights? Let's review some considerations that will help you to determine whether Amazon Lookout for Equipment is suitable for your anomaly detection scenario:
- Latency requirements
- Dataset requirements
- Use case requirements
Latency requirements
With Amazon Lookout for Equipment, training must happen in the cloud. If your data is not available in cloud storage such as Amazon S3, the first step will be to transfer it there.
At prediction time, inference will also happen in the cloud. You will need to send your most recent data to the cloud, and the trained model will be generated and also stored in the cloud. As inference happens in the cloud, you will depend on the network latency between your local systems and the internet. If you need anomaly detections in near real time to feed optimization algorithms in a factory, Amazon Lookout for Equipment will likely be the wrong choice, and you should explore building a custom anomaly detection model that you can deploy at the edge (for instance, leveraging Amazon SageMaker and its Edge Manager feature to compile, deploy, and manage ML models on local machines).
Dataset requirements
To train a model, you will need all your time series signals to have at least 180 days worth of data. On top of this, you will probably want to evaluate your model. We recommend having at least 9 months to 1 year of data to comfortably train and evaluate an anomaly detection model with Amazon Lookout for Equipment. If some of your time series have too much missing data, you might trigger an error as you will have less than 180 days of data available to train your model.
Too much missing data will also block the process at ingestion time. If you provide labeled time ranges for past maintenance periods or known anomalous periods, you will also want to take these into consideration, as these periods will be removed from the data for both the training and evaluation periods. Each signal must have at least 50% of the data present in both the training period and the evaluation period.
Last but not least, your data must have a compatible time interval. Although Amazon Lookout for Equipment can deal with datasets that have been left with their raw sampling rate, the service can resample your data from 1-second to 1-hour intervals, with the most common intervals being 1 minute or 5 minutes. High-frequency datasets (for example, sensor data collected at a sampling rate of 10 milliseconds) will require you to aggregate the data to ensure your training data is below 1.5 million rows over 6 months (as mentioned previously, the minimum range is 6 months).
On the other end of the spectrum, if your use case only provides data at a sampling rate that is higher than 1 hour, Amazon Lookout for Equipment might have a hard time spotting early warning events, as this frequency will cut off the many weak signals the service feeds from to detect any useful events.
Use case requirements
Throughout this chapter, you read through multiple anomaly detection examples. Additionally, you saw how much heavy lifting Amazon Lookout for Equipment is performing on your behalf. However, there are situations and use cases for which Amazon Lookout for Equipment is not the best match:
- Univariate data: Amazon Lookout for Equipment gives its best when it can establish a baseline relationship by looking at multiple interrelated time series data.
- Equipment is not operating continuously: Amazon Lookout for Equipment was built for industrial processes driven by continuously running equipment and low variability in operating conditions. If your process runs with industrial rotating machines such as turbines, compressors, motors, and pumps, Amazon Lookout for Equipment will likely be a good match. If your process runs sporadically (for example, a car that is parked most of the time, a manually operated piece of equipment, or a CNC machine with a highly variable process), the predictive power of the intrinsic time series collected on these processes will be less likely picked up by Amazon Lookout for Equipment. As a rule of thumb, the more variations your normal operations go through, the more challenging it is for your system to be modeled by such a service.
- Batch processes: Framing batch data so that it can be leveraged by Amazon Lookout for Equipment is an additional preprocessing step that involves the appropriate domain expertise to guide the feature engineering step. Batch processes are not good candidates for Amazon Lookout for Equipment out of the box. However, if your feature engineering can be scaled across multiple production lines, products, and factories, you can automate this step and feed these calculated fields to Amazon Lookout for Equipment.
- Less than 6 months of data: Historical process and equipment data must be available for at least 6 months to train an Amazon Lookout for Equipment model. If you want to evaluate the trained model, you might also need a few more weeks' worth of data.
- When known anomalies are not available: If you want to evaluate the capability of the service to capture anomalies that are important for your business process, you need to ensure that the examples of such anomalies are present at least in the evaluation time range (and, ideally, in both the training and evaluation time ranges). If you know there are some anomalies but are not able to label them precisely, you can still use the service to help you identify them more precisely.
Now you should have a good understanding of how to frame your anomaly detection problem to leverage Amazon Lookout for Equipment. Additionally, you can use this section to identify how to enrich your existing datasets to successfully use this service (such as labeling anomaly ranges, adding more sensors, or extracting a longer period of data).
Summary
Amazon Lookout for Equipment is an AI-/ML-managed service running in the cloud. It leverages multiple algorithms to perform anomaly detection on multivariate datasets while abstracting away all the ML decisions you need to take when building your own custom models (for example, questions such as How do I set the threshold to actually capture the anomalies I'm interested in?).
The service is also fully unsupervised. This means that you do not need to spend valuable time to label massive amounts of multivariate time series data. Amazon Lookout for Equipment makes it easy to build whole farms of models that can be applied to each of your individual assets. This allows the service to learn the specific behavior that each asset has developed over the course of the year depending on how it has been manufactured, operated, and maintained.
In this chapter, you learned about the many approaches multivariate anomaly detection can take and the challenges Amazon Lookout for Equipment tackles on your behalf. You discovered the key constructs manipulated by the service and should also have a good understanding of which applications are good candidates to leverage Amazon Lookout for Equipment.
In the next chapter, we will create our first anomaly detection project by creating a dataset and ingesting some time series data.