Chapter 14: Creating and Activating a Detector
In the previous chapter, we identified the type of anomaly detection problems that are of interest when dealing with business or operational metrics structured as univariate time series. In this chapter, we are taking a dive into using Amazon Lookout for Metrics with an e-commerce dataset that contains the evolution of the number of views and revenues over the course of a year. This dataset is hosted publicly by Amazon Web Services on the Amazon Lookout for Metrics public sample repository:
By the end of this chapter, you will have a good understanding of this dataset and you will know how to ingest it into Amazon Lookout for Metrics and use it for both backtesting and live detection purposes.
In this chapter, we're going to cover the following main topics:
- Preparing a dataset for anomaly detection purposes
- Creating a detector
- Adding a dataset and connecting a data source
- Understanding the backtesting mode
- Configuring alerts
Technical requirements
No hands-on experience in a language such as Python or R is necessary to follow along with the content from this chapter. However, we highly recommend that you read this chapter while connected to your own AWS account and open the Amazon Lookout for Metrics console to run the different actions on your end.
If you already have an AWS account, you can connect to the AWS console, click on the search bar at the top, enter Lookout for Metrics in the services section, and click on Amazon Lookout for Metrics to bring up the landing page of the service console.
To create an AWS account and log in to the Amazon Lookout for Metrics console, you can refer to the Technical requirements section of Chapter 2, An Overview of Amazon Forecast.
You are now ready to use Amazon Lookout for Metrics!
Preparing a dataset for anomaly detection purposes
Throughout this chapter and the next one, we are going to focus on an e-commerce dataset in which we will detect potential anomalies and identify some root causes to help us investigate the problems and deliver a faster route to remediation.
In the sub-sections that follow, we are going to look at the following steps in detail:
- Download the e-commerce dataset and split your data into a training dataset (that you will use for backtesting purposes) and a testing dataset (that you will use to monitor simulated live data to understand how the continuous mode of Amazon Lookout for Metrics works).
- Upload your prepared CSV files to Amazon Simple Store Service (S3) for storage. Amazon S3 lets you store files and is often used as a file datastore for many AWS services such as Amazon Lookout for Metrics.
- Authorize Amazon Lookout for Metrics to access your data in Amazon S3. This is optional as you can let Amazon Lookout for Metrics do it for you while you ingest new data. However, this will give you better control over the authorization aspects and can help you debug permission errors in your future work with Amazon Lookout for Metrics.
- Use backtesting to train a detector on your dataset and switch to continuous mode to monitor live data.
Let's now start by downloading the dataset and getting an overview of its content.
Collecting the dataset
We are going to use the following dataset as an e-commerce dataset hosted by AWS on the Amazon Lookout for Metrics GitHub samples repository:
Once unzipped, this archive contains both a dataset to be used for backtesting purposes (input.csv) and a live folder structured in a way that Amazon Lookout for Metrics can understand it to detect anomalies in it.
Note
At the time of writing this book, the demonstration live data extends until the end of February 2022. This dataset is regularly updated by the maintainers of this repository and should be updated regularly to ensure that the demo content you can find in this location stays up to date.
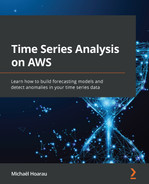
The backtest part of this dataset contains the number of daily views and revenue for a fictitious e-commerce website that sells globally. The data included exposes the number of views and revenue for each marketplace (organized by country code) and for each consumer platform (web, mobile app, or mobile web). The backtest data is available from 2021-01-01 to 2022-01-18. Here, for instance, is the revenue collected for the US marketplace from mobile web customers:
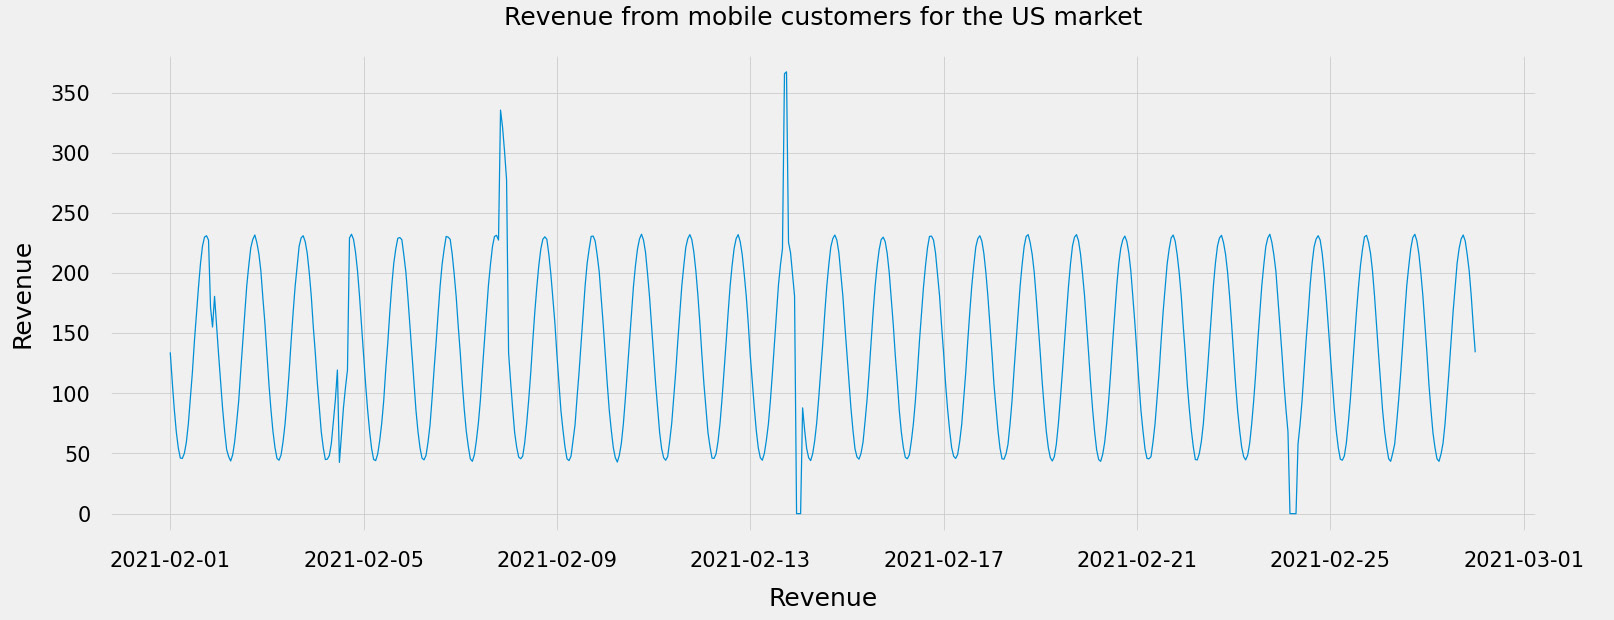
Figure 14.1 – Revenue from mobile web customers for the US market
Within this synthetic dataset, you will notice some artificial anomalies have been added here and there (for instance, around 2021-02-07 on the preceding plot). This dataset is ready to be ingested in Amazon Lookout for Metrics. Let's start by uploading it to Amazon S3.
Uploading your data to Amazon S3 for storage
In this section, you will create an Amazon S3 bucket used to store your raw dataset before ingesting it into Amazon Lookout for Metrics. You will then proceed with the actual dataset upload.
Amazon S3 bucket creation
Equipped with our prepared datasets, let's create a bucket on Amazon S3 and upload our data there as follows:
- If you went through the technical requirements prerequisites at the beginning of this chapter, you should already be logged in to your AWS console, otherwise, fire up your favorite browser and log in to your AWS console.
- At the top left of your console, you will see a Services drop-down menu that will display all the available AWS services. In the Storage section, look for the S3 service and click on its name to go to the S3 console. From here, we are going to click on the Create bucket button located at the top of your buckets list section.
- You are now on the bucket creation page. Choose a name for your bucket. This name must be unique across the whole S3 service. I will call mine timeseries-on-aws-forecast-michael-hoarau. That should be unique enough. Also, select an AWS region where your data will be fetched from by Amazon Lookout for Metrics. I selected the Europe (Ireland) region for mine.
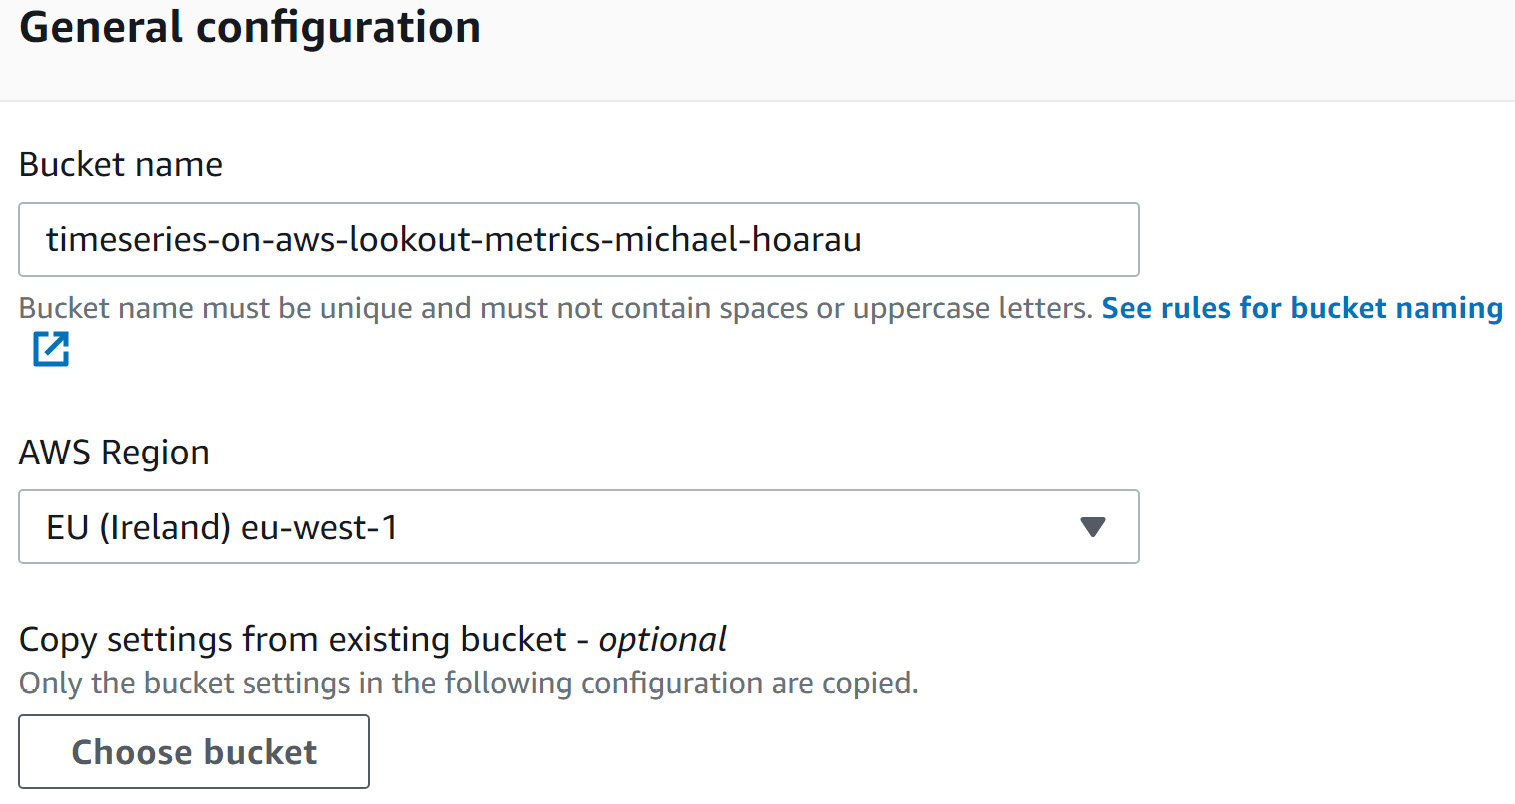
Figure 14.2 – Amazon S3 bucket creation form
Important Note
At the time of writing this book, Amazon Forecast is only available in the following regions: US East (N. Virginia), US East (Ohio), US West (Oregon), Asia Pacific (Singapore), Asia Pacific (Sydney), Asia Pacific (Tokyo), Europe (Frankfurt), Europe (Ireland), and Europe (Stockholm). Make sure you select one of these regions to create your bucket or you won't be able to ingest your data into Amazon Lookout for Metrics.
- You can keep all the other fields at their default values and click on the Create bucket button located at the bottom right of the screen. You are brought back to the S3 home page and you should see your newly created bucket in the buckets listing. A green message at the top of the window will confirm that your bucket was successfully created.
Your Amazon S3 bucket is now created, so we can start uploading our CSV files to this location.
Uploading your dataset to Amazon S3
To upload your dataset, complete the following steps:
- Click on the name of the bucket you just created in the buckets list that appears on the S3 home page. This page lists all the objects available in this bucket. If you already used it previously (when going through the Chapter 2, An Overview of Amazon Forecast or Chapter 8, An Overview of Amazon Lookout for Equipment
- chapters earlier in this book), you may already have some objects listed here. Otherwise, it will be empty, as shown in the following screenshot:
Figure 14.3 – Amazon S3 empty objects listing from your new bucket
- From here, click on the Create folder button and enter lookout-for-metrics for the Folder name field. Then, click on the Create folder button at the bottom of this page.
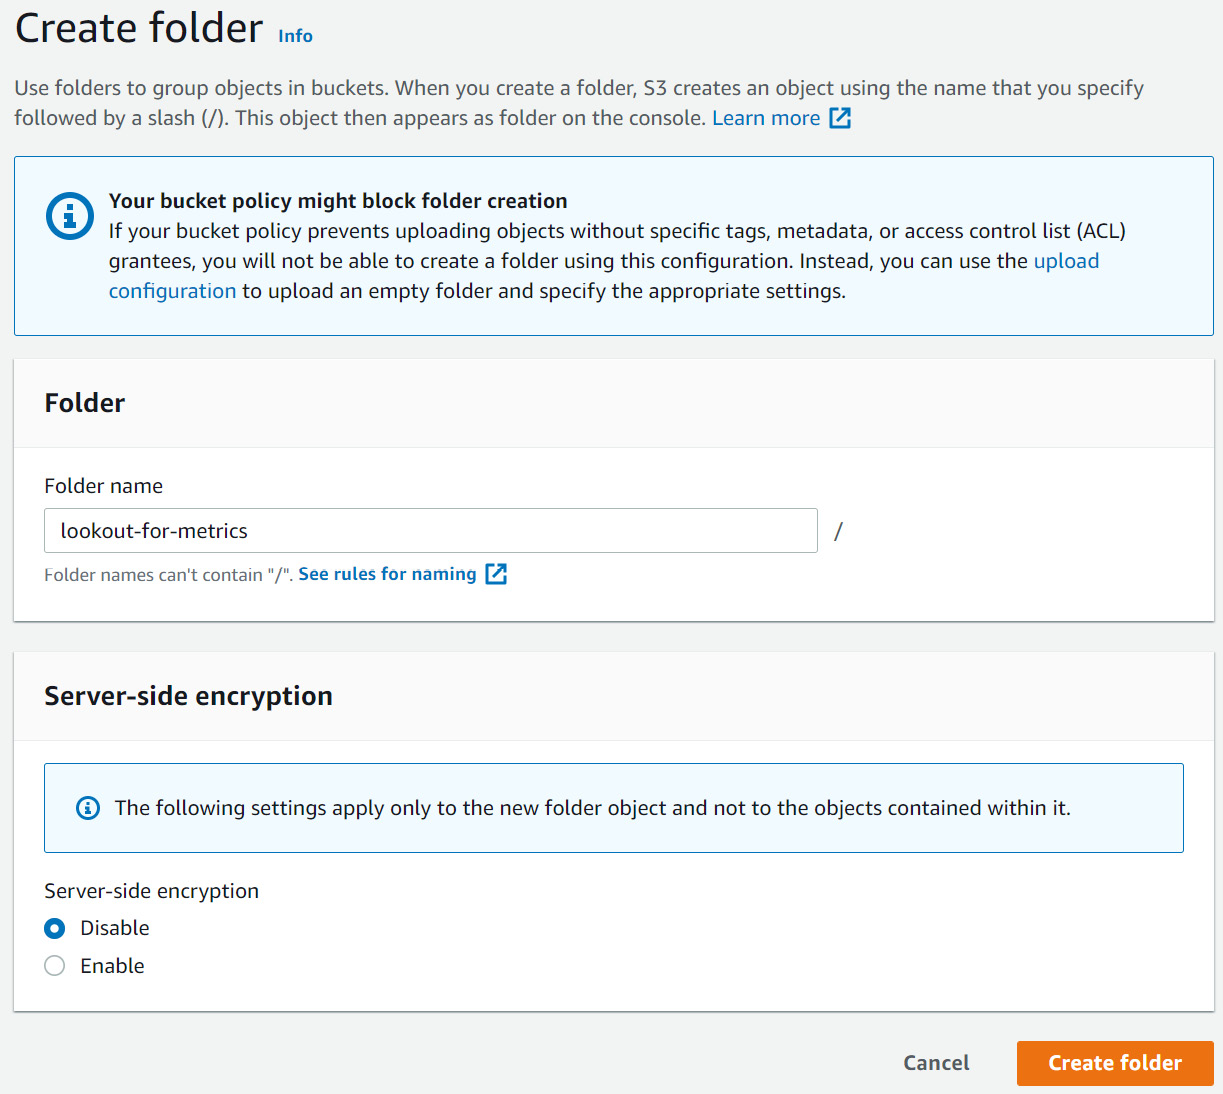
Figure 14.4 – Creating a new folder for hosting Amazon Lookout for Metrics data
- You will be brought back to the objects listing page of your bucket. Click on the name of the folder you just created. From here, click on the Upload button at the top of the objects list. You will be brought to the upload page where you can either click on the Add files button or drag and drop the CSV files unpacked from the archive you downloaded previously.
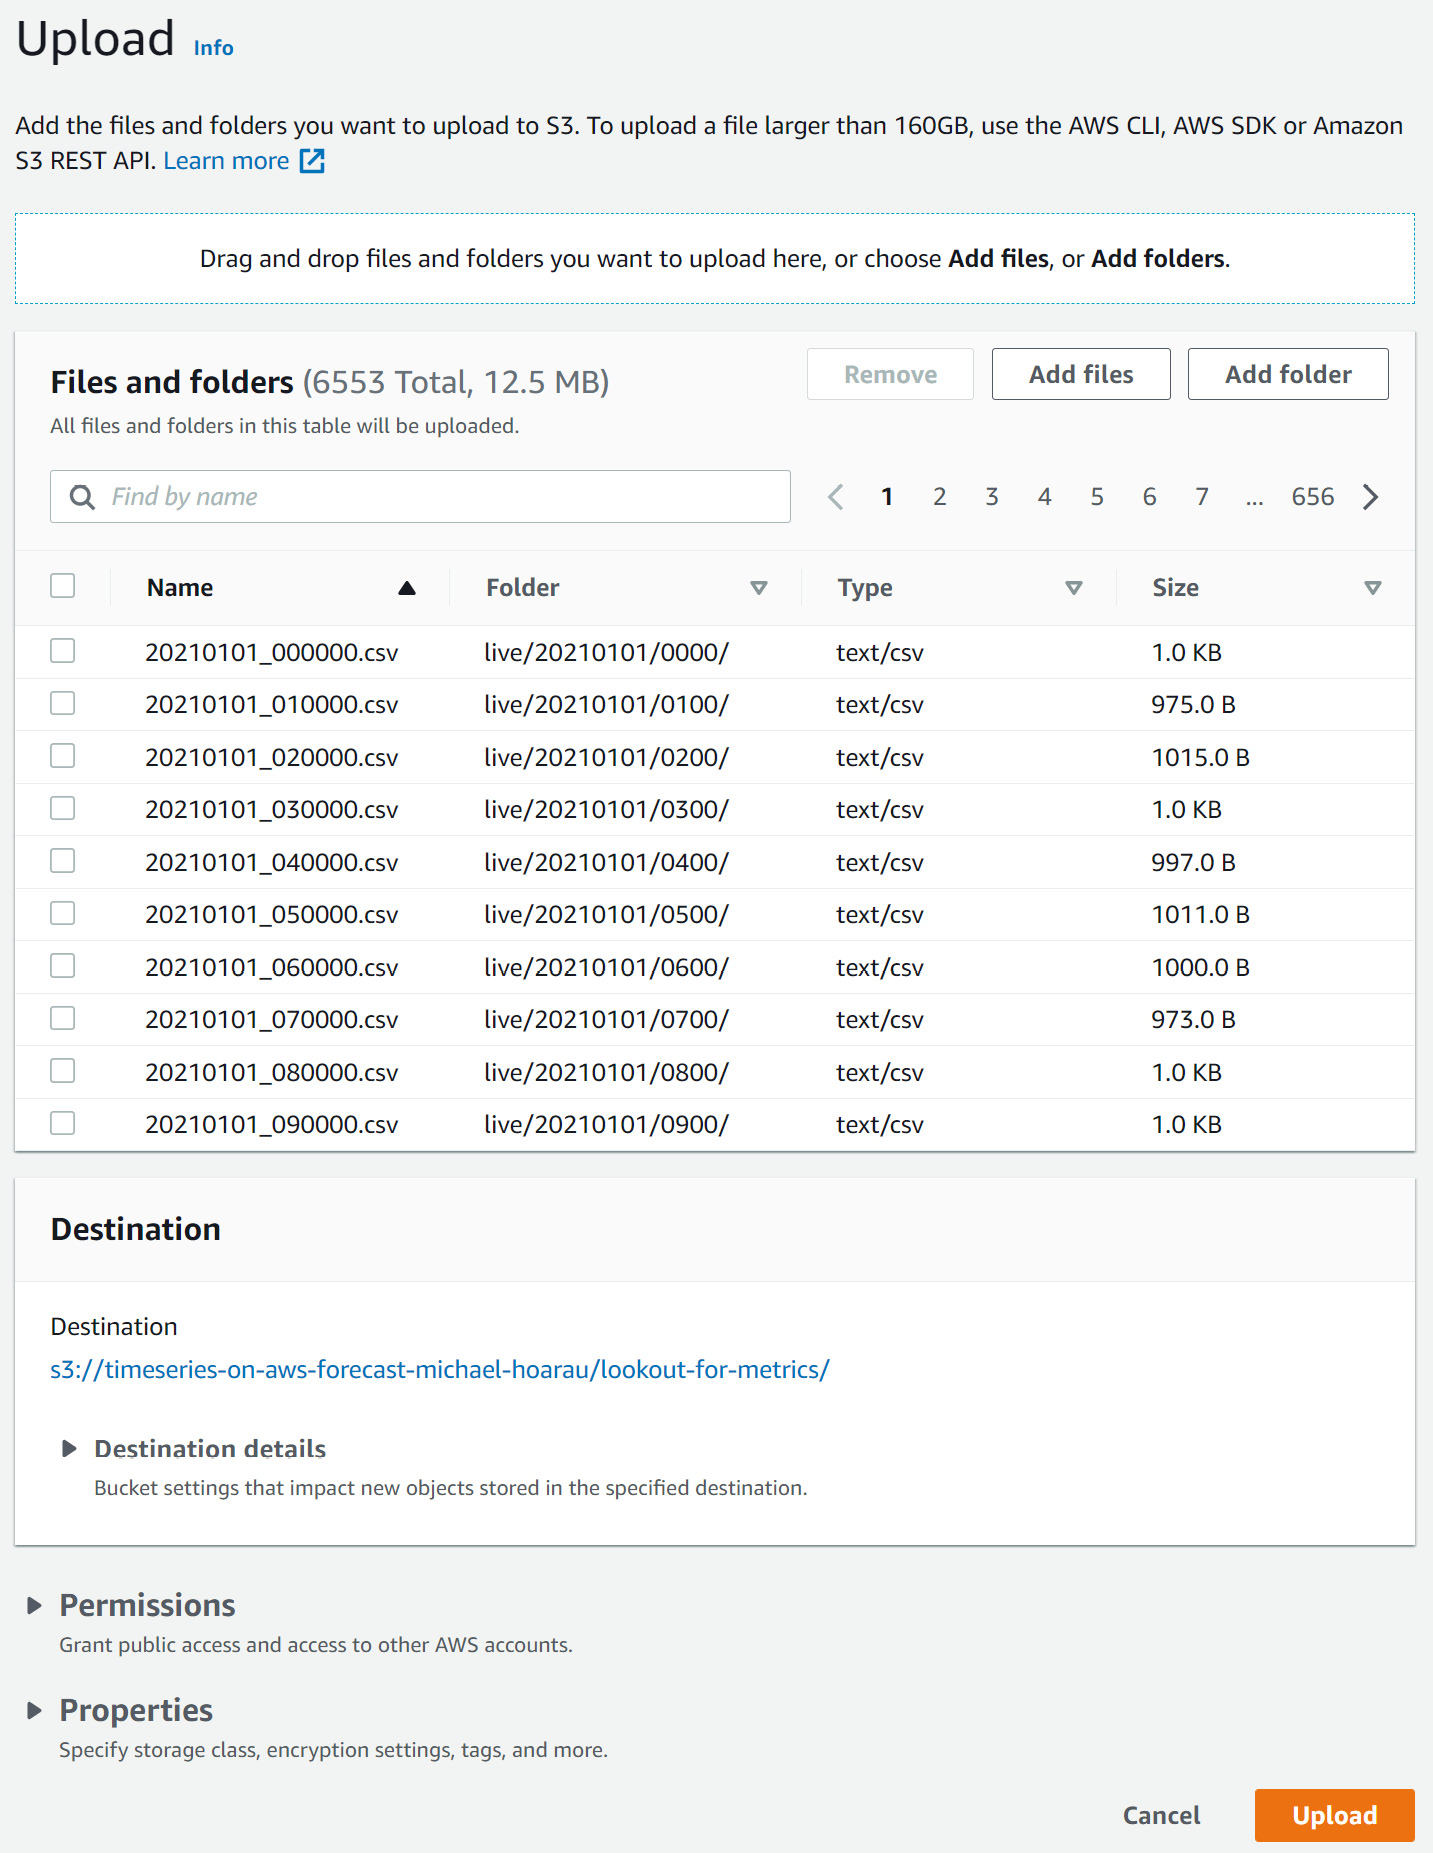
Figure 14.5 – E-commerce dataset upload on Amazon S3
- Leave all the other fields at their default values, scroll to the bottom of the screen, and click on Upload to start uploading the files. There is a total of 12.5 MB and 6,553 files to upload. This may take a while depending on your internet upload bandwidth. An upload status page is displayed while the transfer is in progress.
Note
If you feel the transfer of 6,553 files is too slow using the browser, I recommend using the AWS Command Line Interface to optimize your upload speed: https://docs.aws.amazon.com/cli/latest/userguide/install-cliv2.html. Another option would be to use AWS CloudShell to open a command line in your browser while connected to your console: https://docs.aws.amazon.com/cloudshell/latest/userguide/welcome.html.
- Once this is done, you can click on the Exit button to be brought back to the objects list at the root of your newly created folder.
Once your upload is complete, you should see two subfolders in your objects listing, one called backtest and the other named live.
Giving access to your data to Amazon Lookout for Metrics
By default, the security mechanisms enforced between different AWS services will forbid any service other than Amazon S3 to access your data. From your account, you can upload, delete or move your data from the bucket you just created. Amazon Lookout for Metrics, however, is a different service and will not be able to access this data. We need to specify that Amazon Lookout for Metrics can access any data in this bucket.
Note
You can configure this access directly from the Amazon Lookout for Metrics console during the ingestion step. However, if you want to have more control over the roles and the different accesses created within your account, you can read through this section. Otherwise, feel free to skip it and come back here later.
To enable access to your S3 bucket to the Amazon Lookout for Metrics service, we are going to use the AWS Identity and Access Management (IAM) service to create a dedicated IAM role as follows:
- At the top left of your console, click on the Services drop-down menu and search for the Security, Identity, and Compliance section. Click on the IAM service name to go to this service console.
- On the left panel menu, click on Roles and then click on the Create role button on the top left of this screen.
- On the Create role screen, select AWS service as the type of trusted entity:
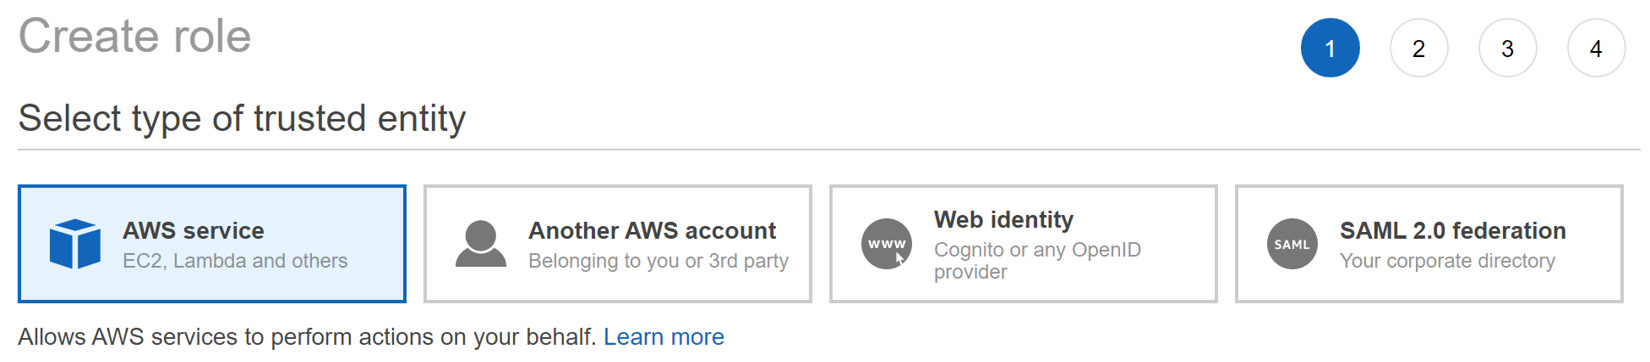
Figure 14.6 – IAM role creation – Trusted entity type selection
- In the following section (Choose a use case), locate Forecast and click on the service name.
- In the last section (Select your use case), select Allows Amazon Forecast to access data in S3.
Important Note
At the time of writing this book, Amazon Lookout for Metrics does not have a ready-to-use use case in the IAM service. This is why you are selecting Forecast in the previous two steps. You can adjust the role created later to match the service for which you want to configure access.
- Click on the Next button until you reach the last step (Review). Give a name and a description to your role (I called it LookoutMetricsAccessRole).
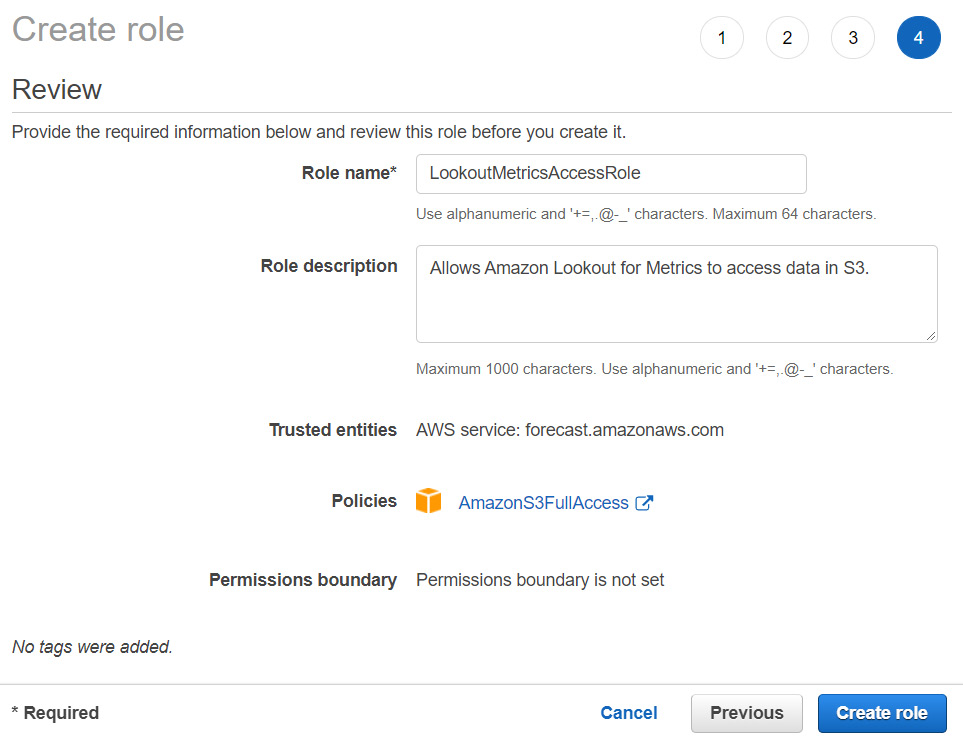
Figure 14.7 – IAM Role creation – Review step
- Click on Create role. Your role is created and a success message is displayed at the top of the screen where you can click on the name of your role. You are then presented with a summary of your role. At the top of this screen, you will see a Role ARN (Amazon Resource Name) field. Copy this ARN and paste it somewhere handy. We will need it when we ingest your data into the service.
- Now, you will adjust this role to limit access to your S3 bucket specifically. To do this, locate the AmazonS3FullAccess row in the Permission policies section and remove it by clicking on the X icon on the right. A confirmation box will ask you to confirm that you actually want to detach this policy from this role. Click on the Detach button to confirm this.
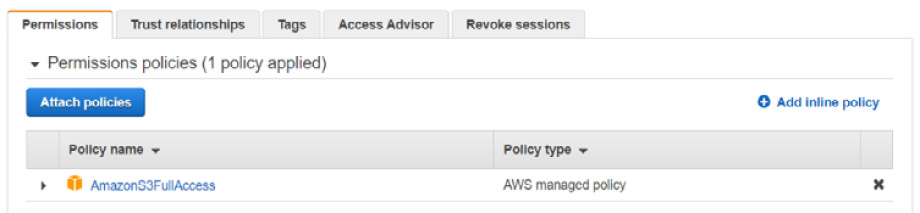
Figure 14.8 – IAM Role creation – Detaching the full access policy
- Next, click on the Add inline policy link and then on the JSON tab. Copy and paste the following policy document in the editor. Don't forget to adjust the <<YOUR-BUCKET>> string to match the name of the bucket you created earlier:
{
"Version": "2012-10-17",
"Statement": [
{
"Effect": "Allow",
"Action": [
"s3:ListBucket",
"s3:GetBucketAcl"
],
"Resource": [
"arn:aws:s3:::<<YOUR-BUCKET>>"
]
},
{
"Effect": "Allow",
"Action": [
"s3:GetObject",
"s3:GetBucketAcl"
],
"Resource": [
"arn:aws:s3:::<<YOUR-BUCKET>>/*"
]
}
]
}
- Scroll down to the bottom of the policy definition screen and click on the Review policy button.
- Give a name to your policy (for instance, LookoutMetricsDatasetAccess) and click on Create policy.
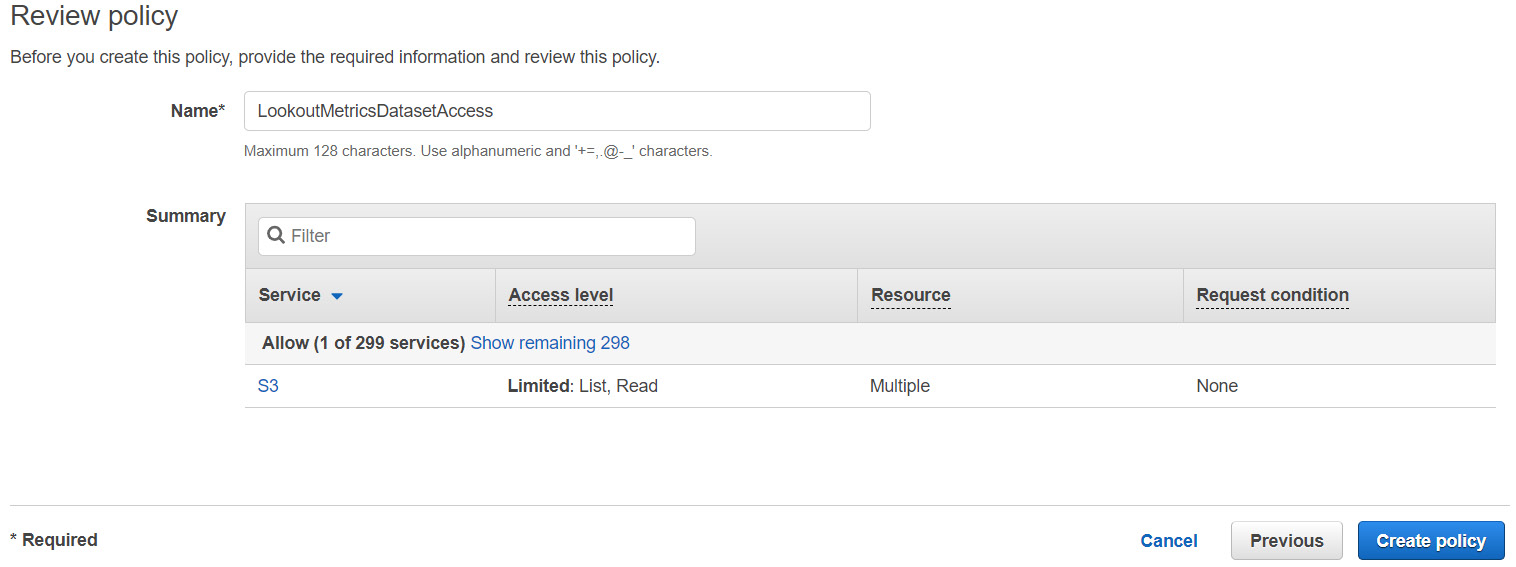
Figure 14.9 – IAM role creation – Adding a least privilege access policy
- Let's now adjust this role to match the right service (Amazon Lookout for Metrics instead of Amazon Forecast). To do this, click on the Trust relationships tab and then on the Edit trust relationship button. In the Edit trust relationship policy document, paste the following JSON document and click on the Update Trust Policy button:
{
"Version": "2012-10-17",
"Statement": [
{
"Sid": "",
"Effect": "Allow",
"Principal": {
"Service": [
"sns.amazonaws.com",
"lookoutmetrics.amazonaws.com"
]
},
"Action": "sts:AssumeRole"
}
]
}
- Your trust relationships should now look like this:
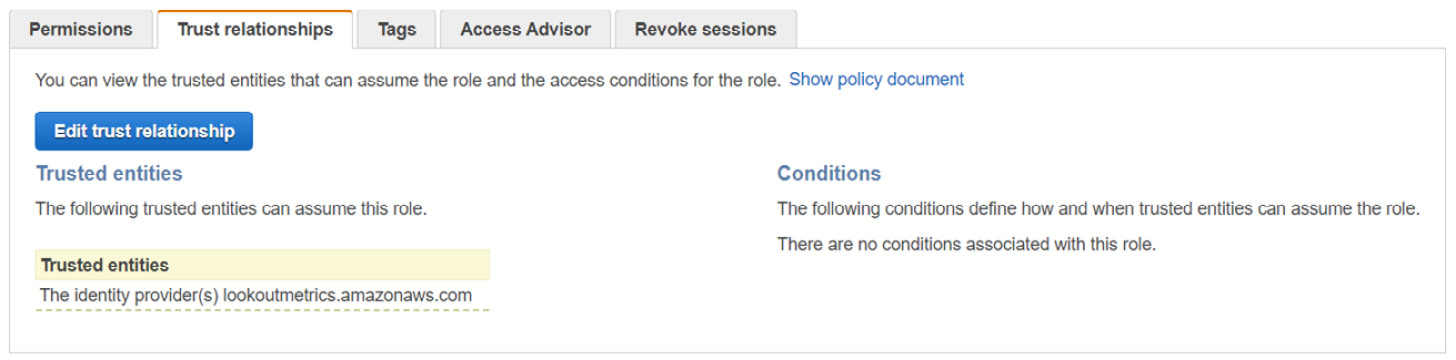
Figure 14.10 – IAM role creation – Updated trust relationship
When Amazon Lookout for Metrics will try to read the datasets you just uploaded in S3, it will request permissions from IAM by using the role we just created. The policy you defined to give access to your S3 bucket is what IAM will use to authorize Amazon Lookout for Metrics to access your dataset. On the other hand, the trust relationship you defined will allow other services (such as Amazon SageMaker) to run Amazon Lookout for Metrics APIs for you. You may have noticed that we also added the SNS service to the trust relationships.
Later in this chapter, you will use Amazon Simple Notification Service (SNS) to create a notification when severe anomalies are detected. We will use this trust relationship to give Amazon Lookout for Metrics the ability to call Amazon SNS APIs.
You are now ready to connect your dataset to Amazon Lookout for Metrics.
Creating a detector
As mentioned in Chapter 13, An Overview of Amazon Lookout for Metrics, a detector is a machine learning model that monitors your dataset to find anomalies and help you analyze their impact. To create your first detector, complete the following steps:
- Log in to your AWS console and search for Lookout for Metrics in the search bar at the top.
- Click on Amazon Lookout for Metrics and go to the home page.
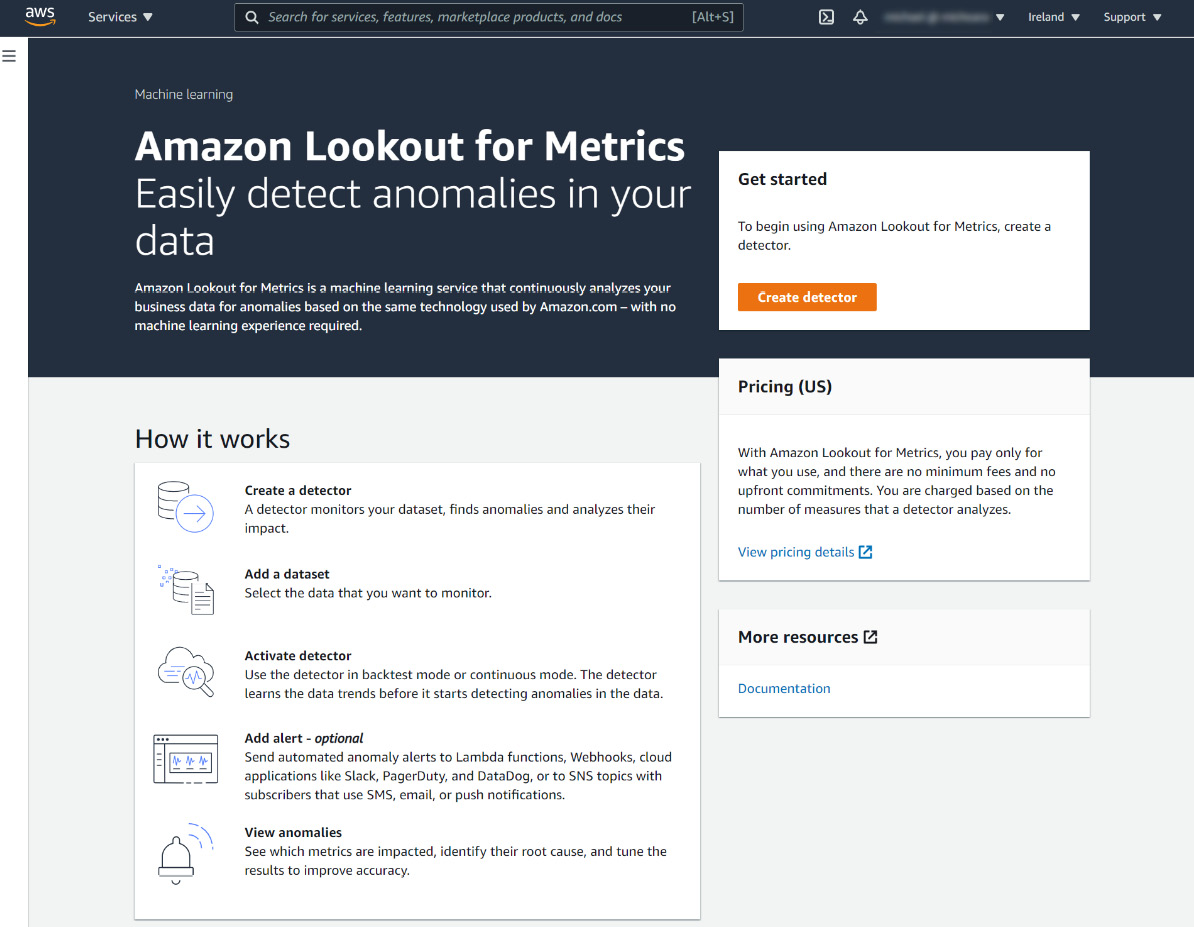
Figure 14.11 – Amazon Lookout for Metrics home page
- On this page, you can either click on the Create detector button on the right side of the screen or click the hamburger icon (the one with three horizontal lines) on the top left to open the left panel, where you can click on Detectors. You will land on a page listing all the detectors visible from your AWS account. If this is your first time using the service, your list will be empty (as shown in the following screenshot). Click on the Create detector button at the top right.
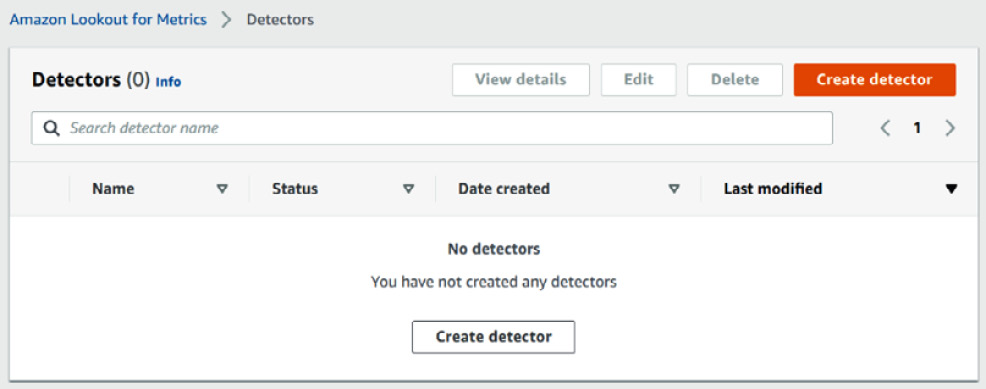
Figure 14.12 – Amazon Lookout for Metrics detectors list
- Following a reminder to check the AWS region you are going to create a detector in, you are asked to provide a name for your detector (let's call it sales-anomaly-detector), an optional description, and the amount of time between each analysis (1-hour intervals). Leave all the other options at their default values, scroll down to the bottom of the screen, and click on the Create button.
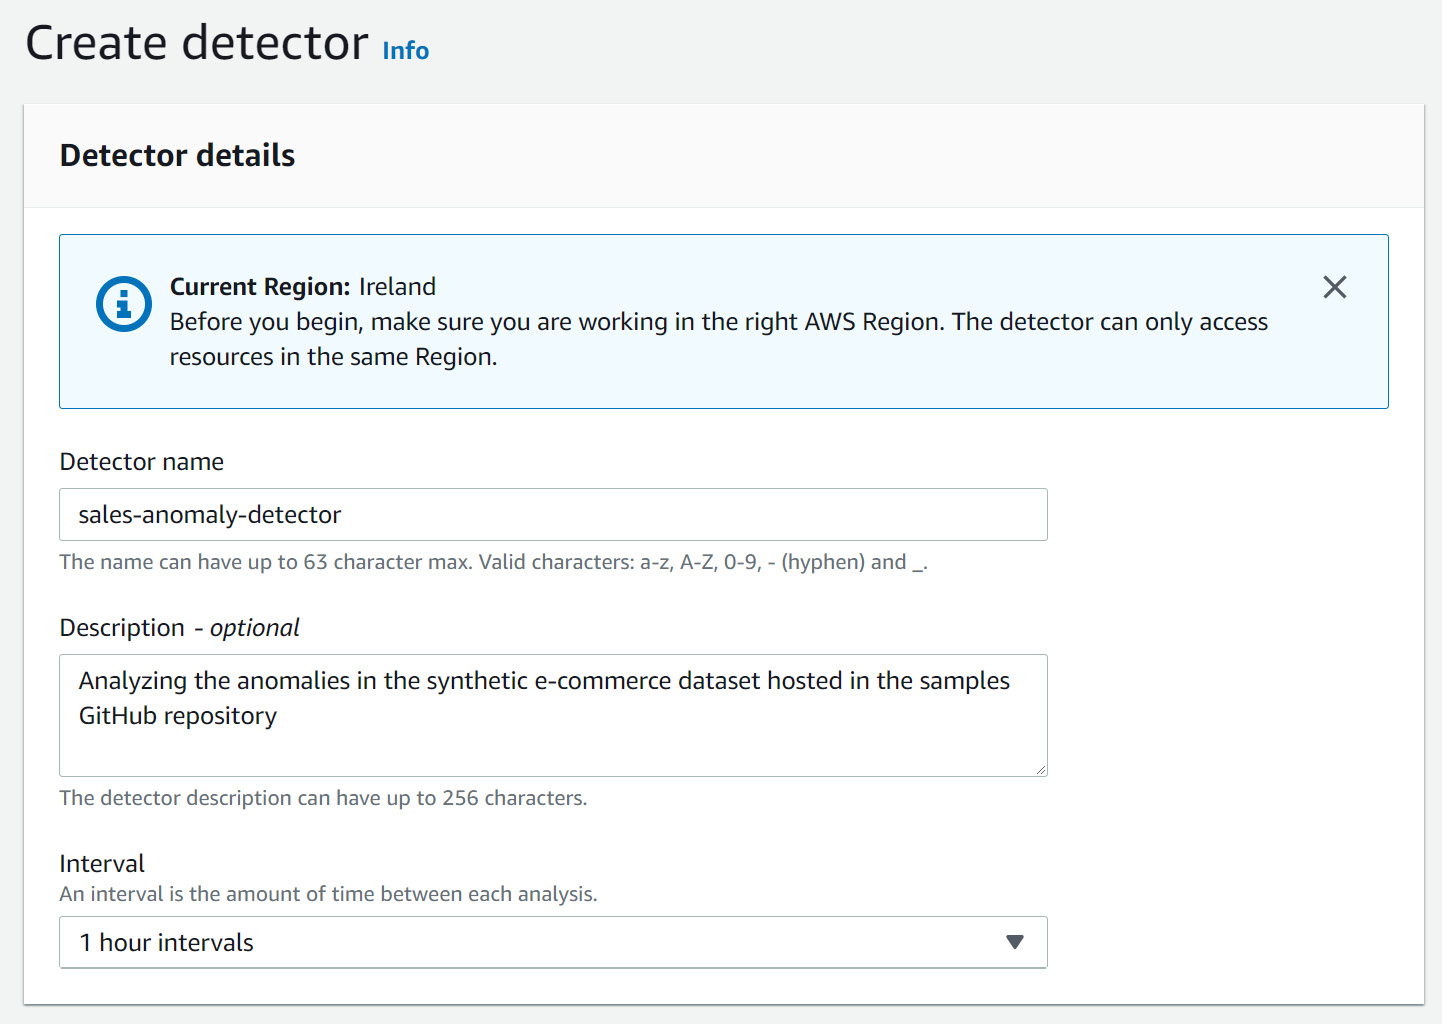
Figure 14.13 – Amazon Lookout for Metrics detector creation screen
You are brought to the detector dashboard screen where you can see the first step completed (Create a detector). A success message is also shown in a green ribbon at the top of the dashboard.
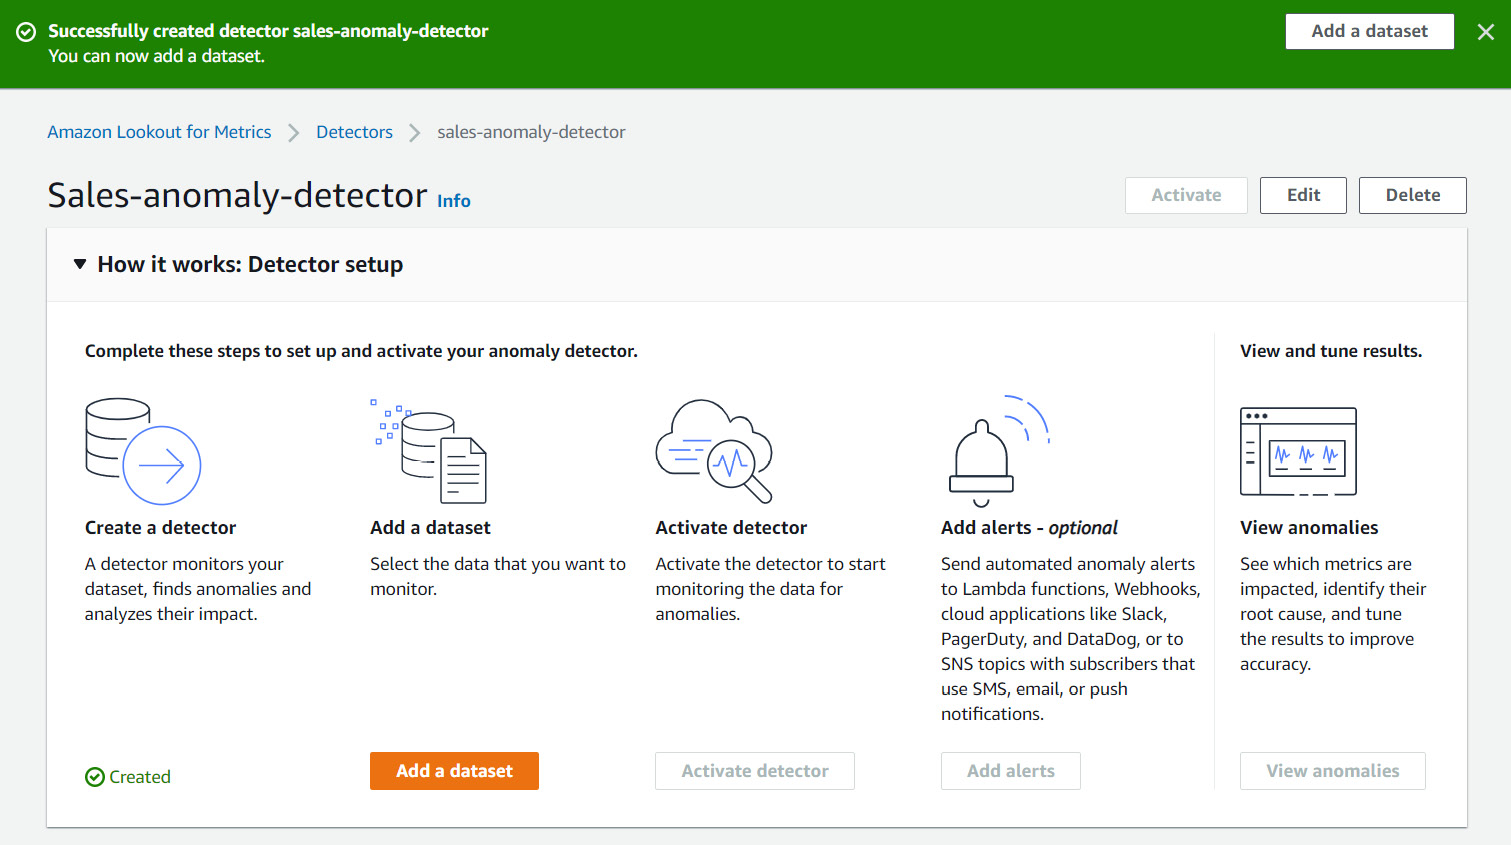
Figure 14.14 – Detector dashboard at creation time
Your detector is now ready and configured, so it is time to connect it to your dataset to start detecting anomalies!
Adding a dataset and connecting a data source
We are going to ingest our data into Amazon Lookout for Metrics to start detecting anomalies in it. To do this, complete the following steps:
- On the detector dashboard, click on the Add a dataset button.
- In the Basic information section, just give a name to your dataset (I called mine ecommerce-dataset).
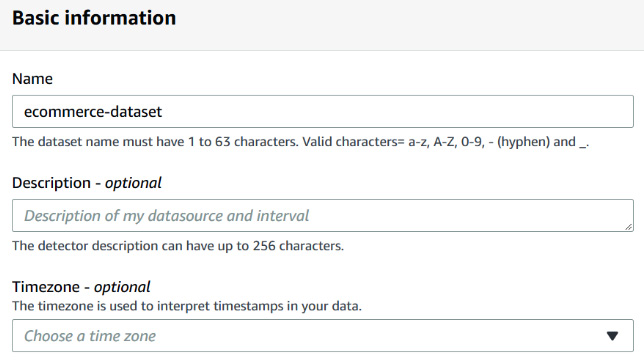
Figure 14.15 – Dataset basic information
- In the Datasource details section, we are going to start the backtest mode to find anomalies in historical data. To do this, select Amazon S3 in the Datasource dropdown and then select Backtest for Detector mode.
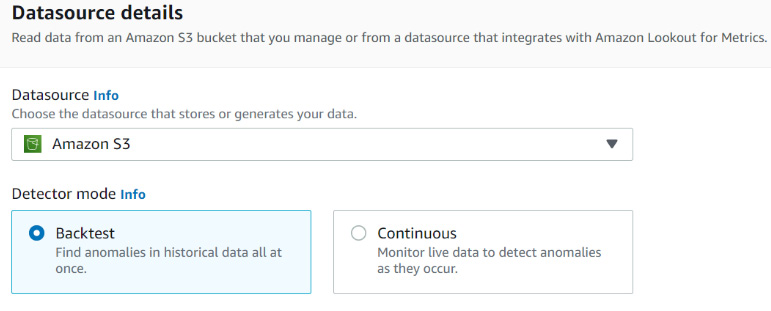
Figure 14.16 – Datasource details – Backtest mode selection
- Then, you will point Amazon Lookout for Metrics to your input dataset where you have your historical data. If you followed the dataset upload section earlier in this chapter, the S3 path to your historical data will have the following format: s3://<<YOUR-BUCKET>>/lookout-for-metrics/backtest/input.csv. Use this path to fill the Historical data field and leave all the other parameters at their default values as they are valid.
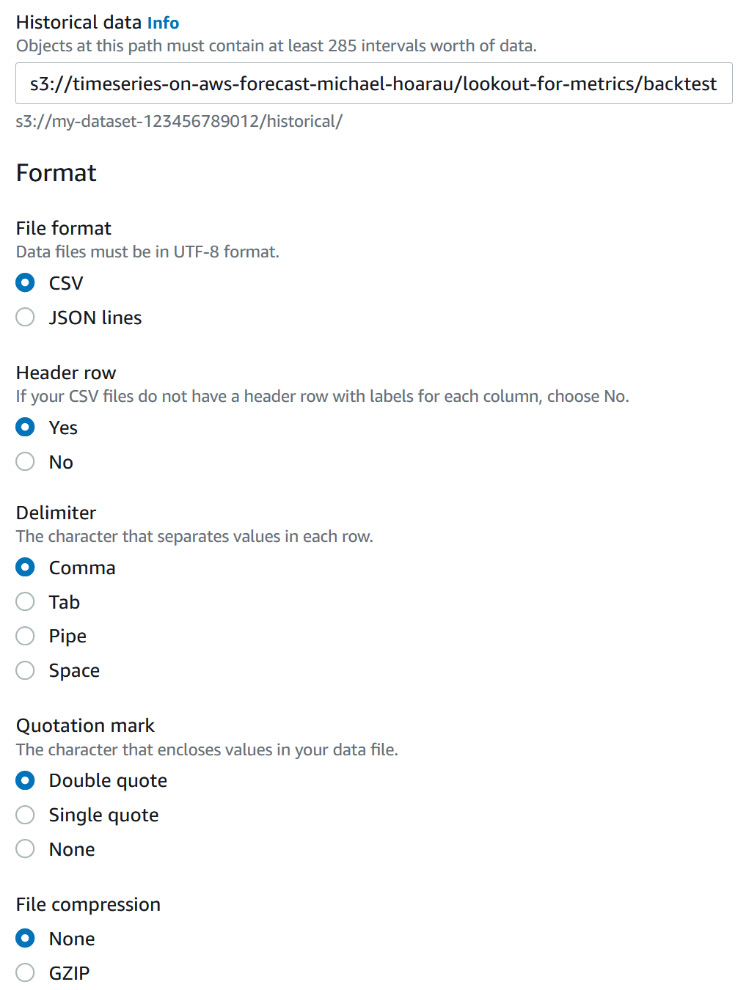
Figure 14.17 – Datasource details – Historical data configuration
- The last step is to specify Permissions. Select Enter the ARN of a role in the Service role section and then paste the ARN of the role you created earlier. Your role ARN should have the following format, arn:aws:iam::<<YOUR-ACCOUNT-ID>>:role/LookoutMetricsAccessRole, where <<YOUR-ACCOUNT-ID>> will be replaced by the ID of your AWS account.

Figure 14.18 – Datasource details – Permission definition
Note
As an alternative, you can also directly create a suitable role at this stage by selecting Create a role in the Service role dropdown. Amazon Lookout for Metrics will ask you to specify which Amazon S3 bucket you would like to give some permissions for and a role will be created on your behalf.
- Scroll down to the bottom of the screen and click on Next. Amazon Lookout for Metrics tries to access your data and validate your dataset. Once validation is complete, you get a success dialog box where you can click on OK to continue.
- On the next page, you will map the different fields of your dataset to the Measures and Dimensions of Amazon Lookout for Metrics. Let's start by adding two measures (you can have up to five of them). Your detector will track these fields of your CSV file for anomalies. You will map the views and revenue columns of your CSV file with Amazon Lookout for Metrics measures. For each of these fields, you will also request the service to perform a SUM aggregation across all dimensions.
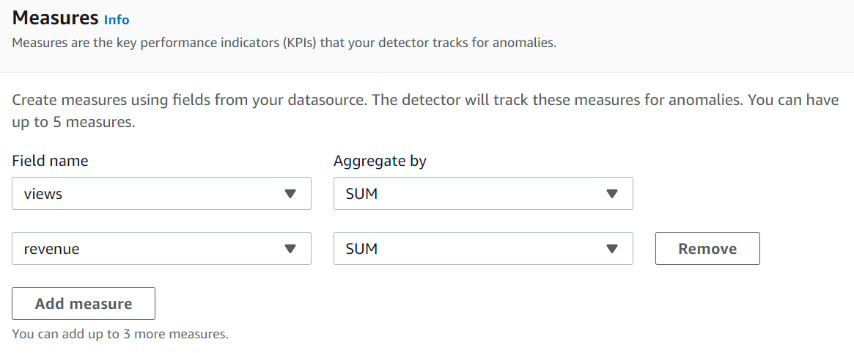
Figure 14.19 – Defining the measures in your dataset
Important Note
At the time of writing this book, Amazon Lookout for Metrics will just ignore time series with missing data. At this time, you will have to check that all the data exists and handle missing data before the service performs any analysis (you can put 0 for a missing data point, for instance).
- You will then define two dimensions by telling Amazon Lookout for Metrics that it can aggregate data across the different values for the platform and marketplace fields present in your dataset.
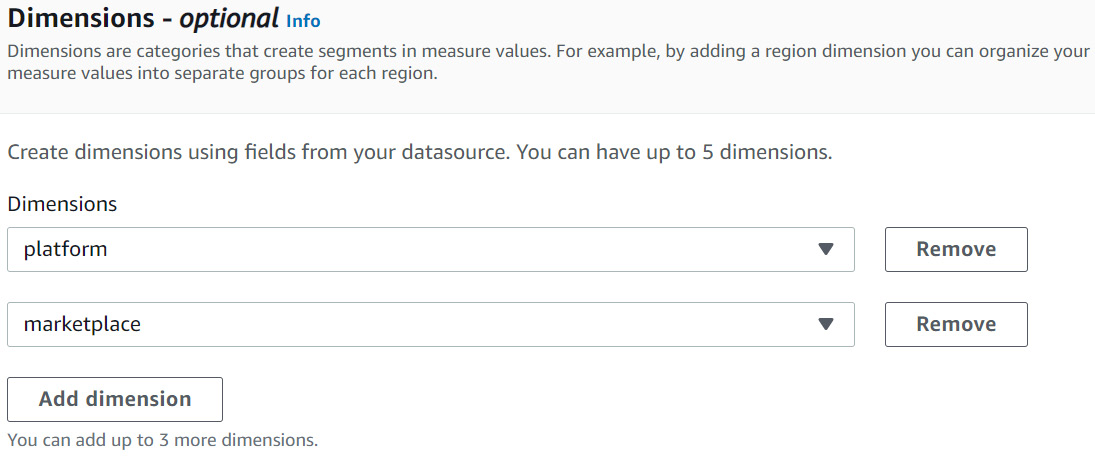
Figure 14.20 – Defining the dimensions in your dataset
- The last field to map is the timestamp. Select the timestamp column from your dataset and let Amazon Lookout for Metrics detect the format for you.
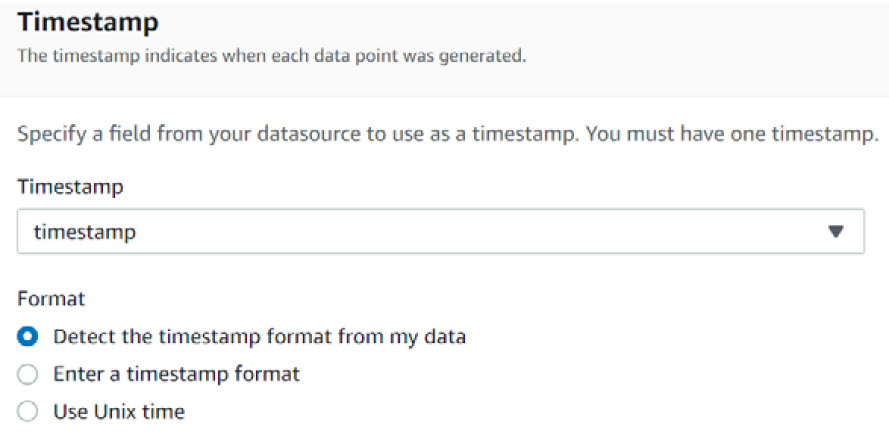
Figure 14.21 – Defining the timestamp in your dataset
- At the bottom of the screen, click on the Next button to review your data source configuration. If you're happy with the configuration of your dataset, click Save and activate to start detecting anomalies in this dataset. A dialog box is displayed to remind you that you're in backtest mode and that you will begin incurring costs once you start your detector. Type confirm in the dialog box and then click on Activate.
You are brought back to your detector dashboard, where you can see that you're in backtest mode and that your detector is learning from this initial dataset.
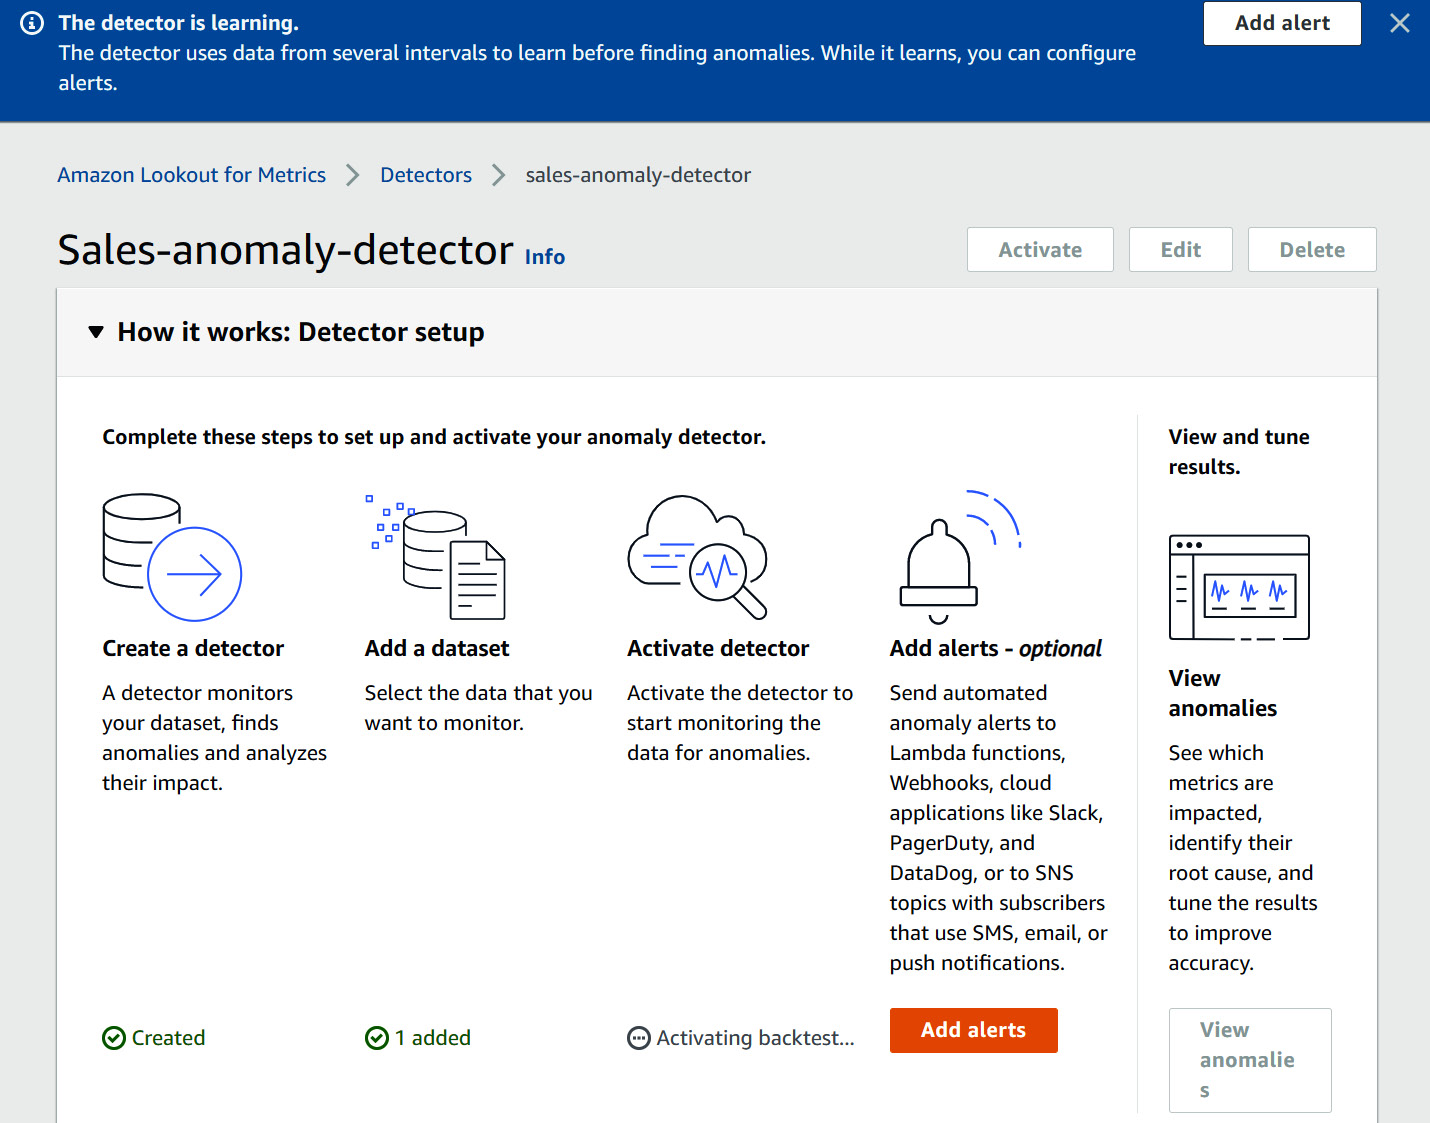
Figure 14.22 – Activating the dataset in backtest mode
You can see that your detector is currently activating its backtest mode. After a while, it will switch to a Backtest in progress status and later to Backtest complete. Some anomalies may have been detected and you will see how you can visualize them in Chapter 15, Viewing Anomalies and Providing Feedback.
Understanding the backtesting mode
When you add a dataset for backtest purposes, Amazon Lookout for Metrics uses it to analyze your data over multiple intervals to identify patterns and learn about expected variations. The backtest mode allows your detector to learn about your data before it starts processing continuous data. When you provide historical data, Amazon Lookout for Metrics uses 70% to learn from it and 30% to run a backtest.
The amount of data Amazon Lookout for Metrics can use to learn from historical data depends on the interval you configured when you added the dataset. The service will only look for up to 2,500 previous intervals that must fall within a certain timeframe:
- For 5-minute intervals, the previous intervals have to lie within the last 3 months.
- For 10-minute intervals, this timeframe will be 6 months.
- For 1-hour intervals, this timeframe will be 3 years.
- For 1-day intervals, this timeframe will be 5 years.
If you do not provide historical data and only live data, Amazon Lookout for Metrics will look into the live data location for past intervals. If it finds some, it will use this data to learn from it and this will reduce the time needed to start detecting anomalies in your live data.
Configuring alerts
Amazon Lookout for Metrics finds anomalies in your data. Depending on the severity of the anomalies detected, the service can send some notifications either to a Lambda function or to an SNS topic:
- AWS Lambda: This is a computing service that lets you run your code without provisioning and managing any underlying services or infrastructure. You can write a lambda function that will process any event generated by Amazon Lookout for Metrics to react to detected anomalies.
- Amazon SNS: This messaging service can be used to send messages between applications or between applications and persons (for instance, by sending text messages to an end user). You can use this service to send a notification whenever your detector finds an anomaly worthy of being reported.
To add an alert to a detector, complete the following steps:
- Open the Amazon Lookout for Metrics service home page and click on Detectors in the left-hand menu bar. Then, select your detector and click on Alerts in the left menu bar. You should be presented with a list of alerts configured for your detector. At this stage, this list will be empty. Click on the Add alert button in the top-right corner of this screen.
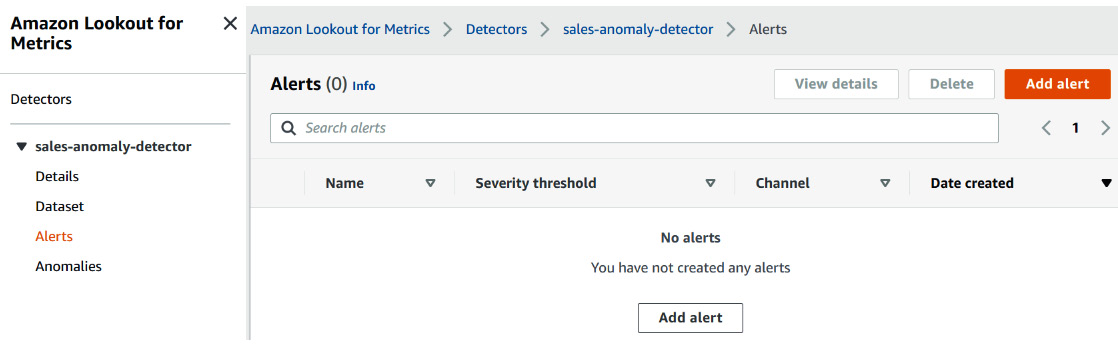
Figure 14.23 – List of configured alerts for a detector
- On the Alert details page, fill in the following details for your alert:
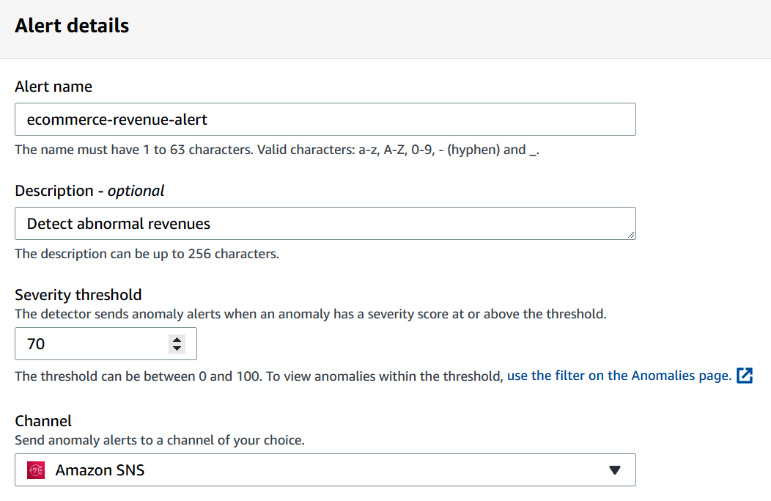
Figure 14.24 – Configuring alert details
You will need to enter the following mandatory details to define your alerts:
- Alert name: Let's call our alert ecommerce-revenue-alert.
- Severity threshold: Leave the default value of 70%. The severity level is a measure of the criticality of a detected anomaly. In Chapter 15, Viewing Anomalies and Providing Feedback, you will have the opportunity to learn more about severity levels.
- Channel: You will choose Amazon SNS as the delivery channel.
- In the SNS topic section, click on Create a topic to bring a new window into your browser. This will open the Amazon SNS service home page. Click on Topics in the left menu bar and then on the Create topic button in the top right. Select the Standard type and enter a name for your topic (for instance, revenue-anomalies-topic).
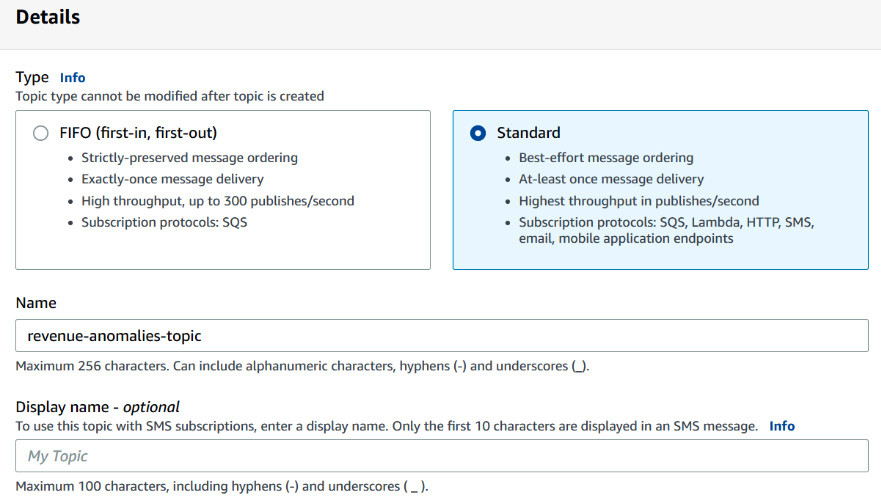
Figure 14.25 – Amazon SNS topic creation
- Leave all the other fields at their default values, scroll down to the bottom of the screen, and click on Create topic. You are brought to the topic details screen. Scroll down and click on the Create subscription button in the Subscriptions tab.
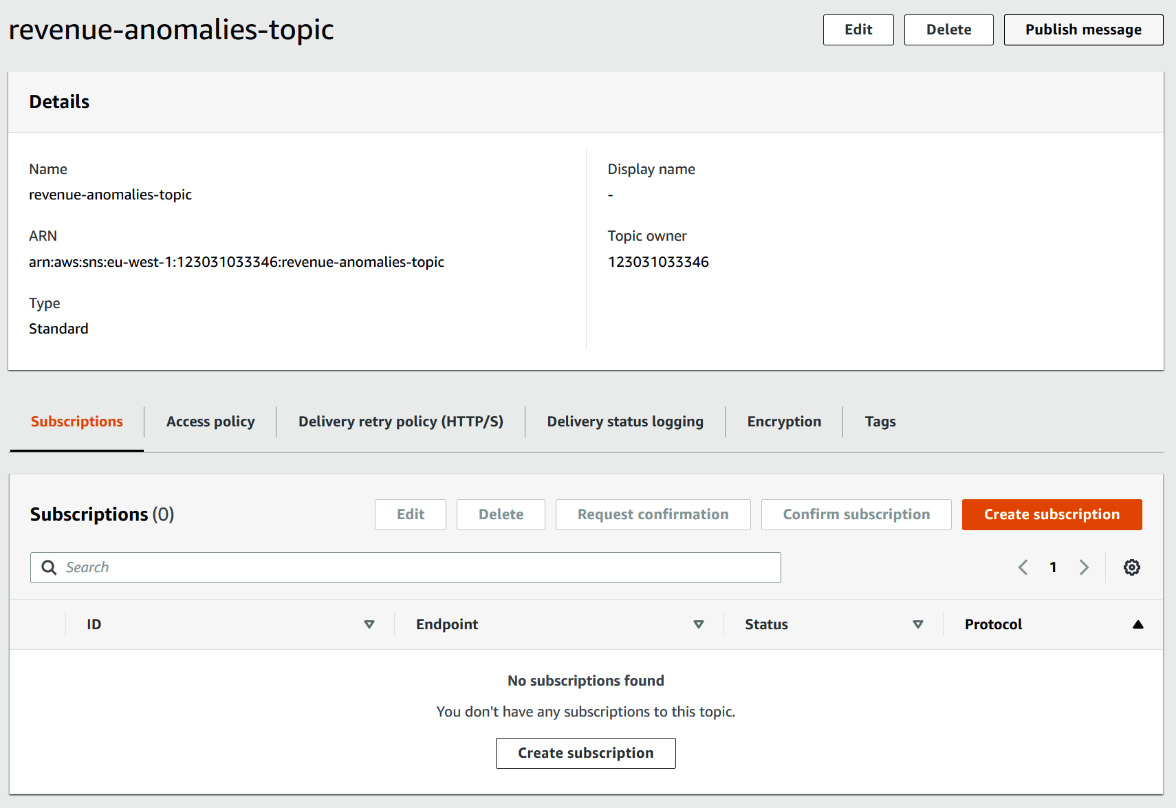
Figure 14.26 – Amazon SNS topic details screen
- In the subscription creation details, select Email for the Protocol field and fill in your email address. Then, click on Create subscription. You will receive an email within a few minutes and you will need to click on the link provided to confirm your subscription to this topic. By default, any message posted on this topic will be sent to your email address.
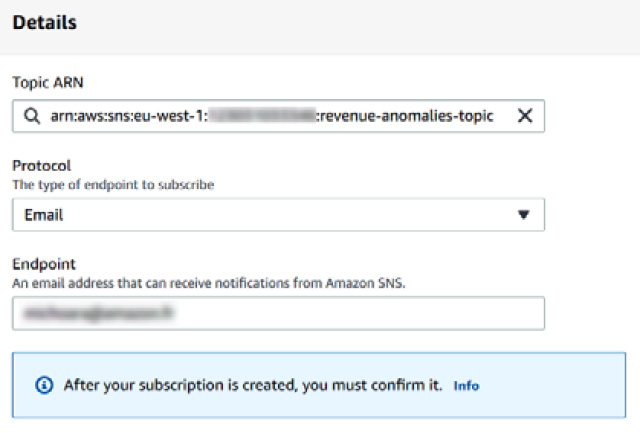
Figure 14.27 – Amazon SNS topic subscription configuration
- Your topic is now created and you can go back to the Amazon Lookout for Metrics alerts creation window. Click on the refresh button next to the SNS topic dropdown. You should now see your topic in the list and you can select it. For Service role, select Enter the ARN of a role and paste a Custom service role ARN. Your role ARN will have the following format, arn:aws:iam::<<YOUR-ACCOUNT-ID>>:role/LookoutMetricsAccessRole, where <<YOUR-ACCOUNT-ID>> will be replaced by the ID of your AWS account.
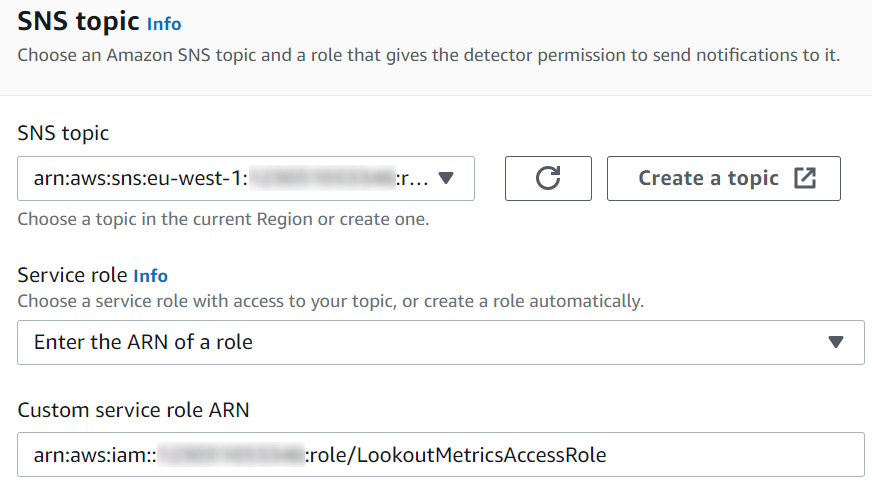
Figure 14.28 – Amazon SNS topic selection for the alert
Note
As an alternative, you can also directly create a suitable role at this stage by selecting Create a role in the Service role dropdown. Amazon Lookout for Metrics will ask you to specify which Amazon SNS topic you would like to give some permissions for and a role will be created on your behalf.
- Scroll down to the bottom of this screen and click on Add alert to create this alert.
Your alert is created and you can see it in the alerts list of your detector.
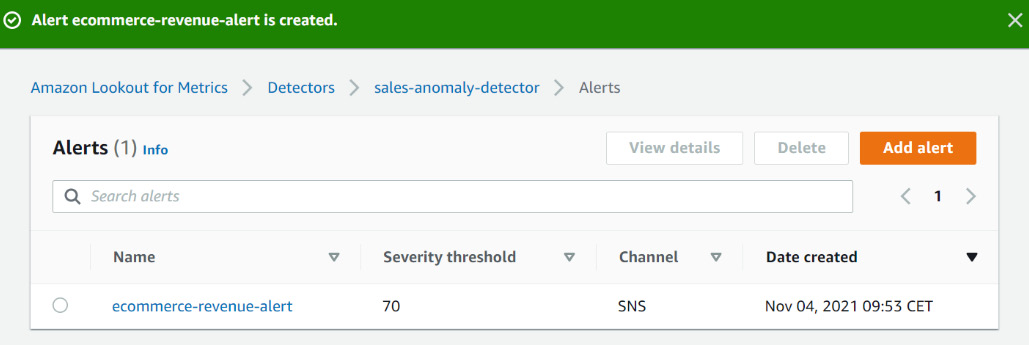
Figure 14.29 – Amazon Lookout for Metrics alerts associated with a given detector
Congratulations! You have successfully trained a detector and configured an alert to warn you whenever it detects an anomaly. Time to close up this chapter!
Summary
In this chapter, you learned how to prepare your historical data so that Amazon Lookout for Metrics can use it to perform backtesting. You also developed a good understanding of the e-commerce dataset that we will continue to use throughout this part dedicated to anomaly detection. You also got initial hands-on experience of Amazon Lookout for Metrics as you learned how to create a detector and how to connect it to a data source. You also learned how to configure an alert so that you can react when an anomaly is detected.
This chapter was key to understanding and manipulating the key concepts used by Amazon Lookout for Metrics (detectors, data source, alerts).
In the next chapter, you are going to switch your detector into a live detection mode and you are going to learn how to visualize the detected anomalies and provide feedback to the service.