
Chapter 18: Monitoring and Troubleshooting Virtual Networking
This chapter focuses on monitoring and troubleshooting network connectivity. In this chapter, we are going to focus on how you can monitor your virtual networks using Network Watcher. You will learn how to manage your virtual network connectivity and how you can monitor and troubleshoot on-premises connectivity as well as use Network Watcher. We will end this chapter by covering how to troubleshoot external networking.
In this chapter, we are going to cover the following main topics:
- Network Watcher
- Configuring Network Watcher
Technical requirements
To follow along with the hands-on material, you will need the following:
- Access to an Azure subscription with owner or contributor privileges. If you do not have access to one, you can enroll for a free account at https://azure.microsoft.com/en-us/free/.
- PowerShell 5.1 or later installed on a PC from which labs can be practiced; note that many examples can only be followed on a PC.
- Installation of the Az module, which can be performed by running the following in an administrative PowerShell session:
Set-ExecutionPolicy -ExecutionPolicy RemoteSigned -Scope CurrentUser
You can also run the following:
Install-Module -Name Az -Scope CurrentUser -Repository PSGallery -Force
Network Watcher
Azure Network Watcher is a network monitoring solution that provides tools to diagnose, monitor, and view metrics and logging for resources in an Azure virtual network. This includes application gateway traffic, load balancers, and ExpressRoute circuits.
Azure Network Watcher offers the following capabilities:
- Monitoring
- Network diagnostics
- Metrics
- Logs
- Tools for troubleshooting connection problems
Network Watcher will be automatically enabled when a new virtual network is created or updated. There is no extra charge for enabling Network Watcher inside a subscription.
Top Tip
To make use of Network Watcher, you will require the appropriate role-based access control (RBAC) role permissions, such as Contributor, Owner, or Network Contributor.
Monitoring
Monitoring provides several tools that are useful for monitoring your network traffic as well as creating visibility of your Azure Virtual Network (VNet) resources and how they communicate with each other. The following figure depicts the tools available under the Monitoring context in the Network Watcher blade:
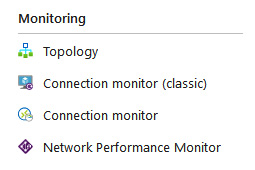
Figure 18.1 – Network Watcher, Monitoring
We describe each of these tools in more detail in the following subsections.
Topology
The Topology tool enables you to visually understand the interconnections between resources and how they are configured to communicate with each other within a VNet. This can be a great high-level overview of the VNet you are working with.
Connection monitor
This is a cloud-based hybrid network monitoring solution that can monitor the communication between virtual machines (VMs) and endpoints. An endpoint can be another VM, a URL, an IPv4 or IPv6 address, or a fully qualified domain name (FQDN). The network communication is monitored at regular intervals and information about latency, network topology changes, and the reachability between a VM and the endpoint is collected. If an endpoint becomes unreachable, Network Watcher will inform the user about the error. The reason for this can be a problem with the memory or CPU of a VM, a security rule for the VM, or the hop type of a custom route.
Network Performance Monitor
Network Performance Monitor (NPM) is a hybrid network monitoring solution. It can monitor network connectivity for on-premises and cloud networks, and between various points in your network infrastructure. It can detect issues such as routing errors and blackholing. The monitoring solution is stored inside Azure Log Analytics.
NPM can create alerts and notifications when network performance errors appear, and it can localize the source of the problem to a specific network device or segment.
It offers the following capabilities:
- Performance monitor: A performance monitor can monitor the network connectivity across cloud deployments and on-premises locations. It can also monitor connectivity between multiple data centers, branch offices, multi-tier applications, and microservices.
- Service connectivity monitor: You can identify the network bottlenecks inside the network infrastructure and detect the exact locations of the issues in the network. You can also monitor connectivity between users and services.
- ExpressRoute monitor: You can monitor the ExpressRoute connection between the on-premises locations and Azure.
Latency problems are also monitored. The connection monitor will provide the average, minimum, and maximum latency observed over time. The monitoring solution is capable of monitoring network performance between various points in the network infrastructure and it can generate alerts and notifications.
As of July 1, 2021, this has been considered a legacy service; you can no longer add new tests to an existing workspace, nor can you create new workspaces in NPM. You should now use the new Azure Connection Monitor instead and are advised to migrate any tests you had configured in NPM to Azure Connection Monitor.
Network diagnostic tools
There are several network diagnostic tools presented to you in Network Watcher. You can, for instance, diagnose network traffic filtering for VMs, determine the next hop of your traffic on route to an intended destination, or even identify why a VM is unable to communicate with other resources because of a security rule.
Using Azure Network Watcher, you can diagnose outbound connections from a VM. You can also diagnose problems with an Azure VNet gateway and connections, capture packets to and from a VM, view security rules for a network interface, and determine relative latencies between Azure regions and internet service providers.
The following tools are available as presented in the following screenshot:
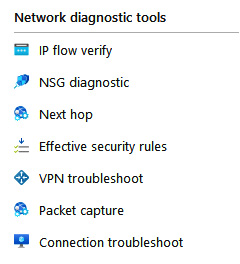
Figure 18.2 – Network Watcher, network diagnostic tools
Let's look at them in more detail.
IP flow verify
An IP flow can verify and test the communication and inform you as to whether the connection has succeeded or failed. It is used to assess traffic flow to and from the internet and on-premises environments. An IP flow can tell you which security rule allowed or denied the connection and communication. To use IP flow verify, you specify a source (local) and destination (remote) IPv4 address and port. Along with this, you enter the corresponding packet information such as your protocol transmission control protocol / user datagram protocol (TCP/UDP) and direction of traffic flow (Inbound/Outbound):
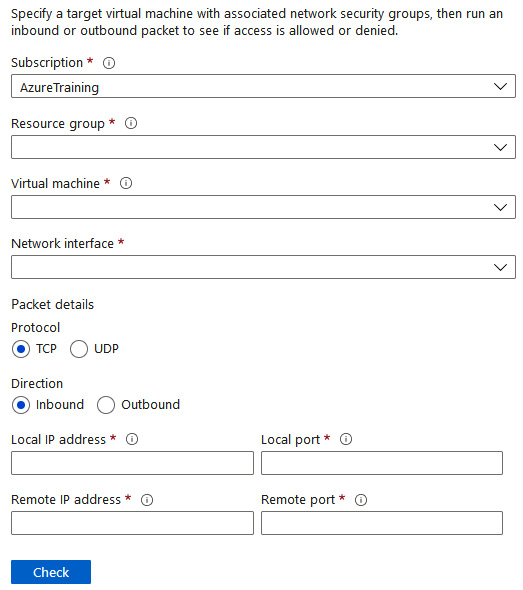
Figure 18.3 – Network Watcher, IP flow verify
NSG diagnostic
This tool enables you to identify the net effect of applied network security group (NSG) rules that apply as well as identify all NSGs that will be used. The output will expose the end result allow and deny status for the identified flow. To run NSG diagnostic, you again specify your source and destination. The source can be an IPv4 address or a Classless Inter-Domain Routing (CIDR) range, or it can be a service tag, whereas the destination specified is an IP address only. You also choose your port for the destination, specify your traffic protocol (TCP/UDP/ Internet Control Message Protocol (ICMP)/All) and direction. The diagnostic supports VMs, network interfaces, VM scale set network interfaces, and application gateways.
Next hop
Network Watcher can also diagnose network routing problems from a VM. When a VNet is created, there are several default outbound routes created for that VNet as well. Outbound traffic from all resources that are deployed in a VNet is routed based on Azure's default routes. In cases where you want to override the default routing rules or create additional rules, Next hop can be used to test the communication between the different routes. When the communication fails, you can then change, add, or remove a route to resolve the problem.
Effective security rules
This is used to determine the overall effective security rules applied to your VM and will combine all relevant NSG rules together to display the net rule effect. This can be extremely helpful when assessing why your traffic is blocked and where you have several NSGs.
VPN troubleshoot
This is used when there are issues between your VNet gateways and connection endpoints that require troubleshooting. Multiple gateways and connections can be troubleshot at the same time.
Packet capture
The packet capture feature in Network Watcher allows you to capture packets for traffic related to your VM, being both inbound and outbound from the VM. The capture enables you to have more visibility of your network traffic, garnering key insights such as intrusion detection traffic, network statistics, and other network-related communications and traffic. This is enabled as a VM extension and relieves you of running your own VM-hosted packet capture utilities to achieve the same results.
Connection troubleshoot
This tool enables you to assess TCP connections between a VM and either a VM, URI, IPv4 address, or even FQDN. The aim of the tool is to reduce the time required in identifying connectivity issues and assist with determining the root cause.
Metrics
The Metrics category primarily contains usage and quota data as per the following category:
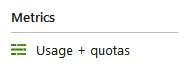
Figure 18.4 – Network Watcher, Metrics
Usage + quotas
This pane provides an easy mechanism to gain visibility of your usage against each quota, as well as providing the ability to request a quota increase for additional consumption of services:
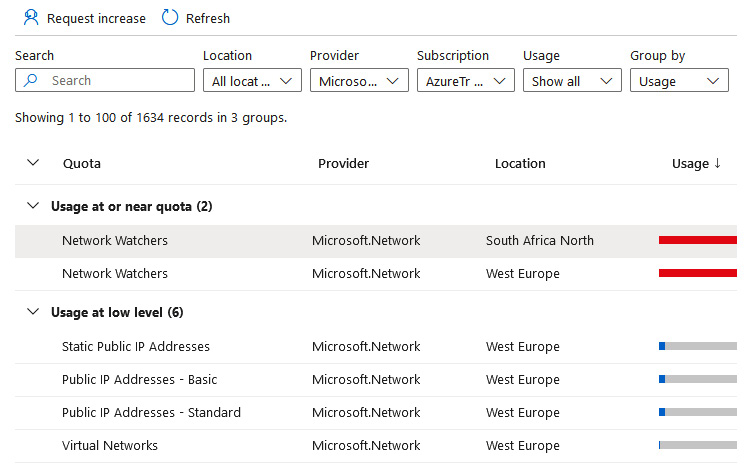
Figure 18.5 – Network Watcher, Usage + quotas
Next, we will explore what logs are and the types of logs we can collect.
Logs
Logs provide several logging tools that are useful for investigating usage and troubleshooting. These logs can be analyzed using several tools, such as the Traffic Analytics feature and Power BI:
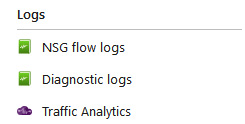
Figure 18.6 – Network Watcher, Logs
Next, we will explore the various log types found in the service.
NSG flow logs
NSGs are responsible for allowing or denying the inbound and outbound traffic to a network interface in the VM. The NSG flow logs feature can log the port, protocol, whether traffic is allowed or denied, and the source and IP address. The NSG flow logs feature is where you configure the logging of your flows.
Diagnostic logs
This pane allows you to configure the diagnostic logging settings for your resources; it will record NSG events and rule counts as NetworkSecurityGroupEvent and NetworkSecurityGroupRuleCounter. The logs can be stored in a variety of locations such as Log Analytics, Event Hubs, or an Azure storage account.
Traffic Analytics
Traffic Analytics can provide rich visualization of the data that is written to the NSG flow logs.
Top Tip
Network Watcher is a regional service, which means that you need to deploy it for each region that you require the service.
In the sections that follow, we are going to see Network Watcher in action.
Configuring Network Watcher
Now that you understand what Network Watcher is, we will explore in the following sections how to configure and use the various components available to the service.
Network resource monitoring
In this demonstration, we are going to monitor the network on VMs. For this demonstration, create three Windows Server 2016 data center VMs inside one VNet. We can use these VMs for monitoring. Before we are able to monitor the network using network resource monitoring, we need to install the Network Watcher agent on the three VMs. After that, we are going to inspect the network traffic.
Installing the Network Watcher agent
You will set up three VMs labeled networkwatcher1, networkwatcher2, and networkwatcher3. To install the Network Watcher agent on a VM in Azure, take the following steps:
- Navigate to the Azure portal by opening https://portal.azure.com/.
- Deploy a new resource group named AZ104-NetworkWatcher and a new VM deployed as follows:
- Subscription: Select a subscription.
- Resource group: AZ104-NetworkWatcher.
- Name: networkwatcher1.
- Region: A region of your choice (this must be the same for all subsequent resources in this chapter).
- Virtual Network: NetworkWatcherVnet.
- Subnet Name: NetworkWatcherSubnet.
- Network Security Group: NetworkWatcherSecurityGroup.
- Open Ports: 3389.
- Size: Standard DS1 v2.
- Once deployed, open the VM settings, and under Settings, select Extensions + applications, and then click the Add button:
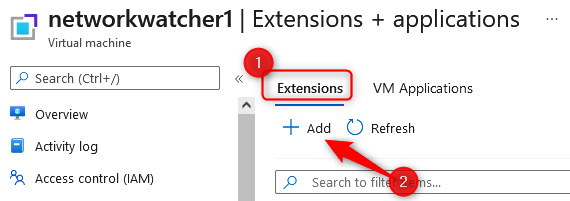
Figure 18.7 – Adding a VM extension
- Type network watcher in the search box, click the Network Watcher Agent for Windows icon, and click Next:
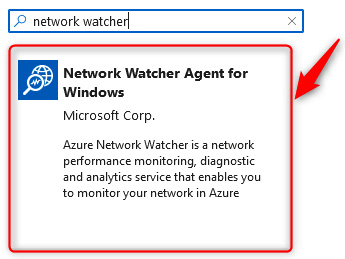
Figure 18.8 – Adding the Network Watcher Agent for Windows extension
- Click Review + create on the screen that follows, then click Create.
- Repeat these steps for the other two VMs as well and install the agent on them. Increase the count associated with the VM name as mentioned at the beginning of this exercise.
Now that Network Watcher Agent for Windows is installed on all the VMs, we can enable it for a specific region.
Enabling Network Watcher
To enable Network Watcher in a specific region, take the following steps:
- Navigate to the Azure portal by opening https://portal.azure.com/.
- Click the hamburger menu in the top-left corner of the Azure home screen. Select All services:
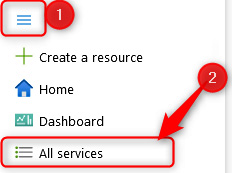
Figure 18.9 – Selecting All Services
- Type network watcher in the search bar, then click Network Watcher:
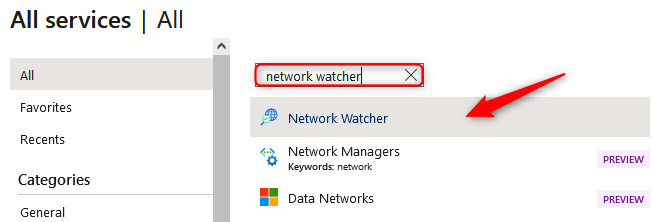
Figure 18.10 – Selecting network watcher
- On the Network Watcher Overview page, select the Network Watcher service with the Subscription and Location details that match the VM you deployed earlier. In my case, this is West Europe:
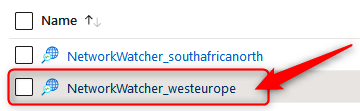
Figure 18.11 – Selecting your Network Watcher
Top Tip
Note that upon deploying your first VNet in an Azure region, Azure will automatically create the associated NetworkWatcher_<region> resource.
- If Network Watcher is not already deployed for your region, click + Add at the top of the screen. Select Subscription and Region and click Add:
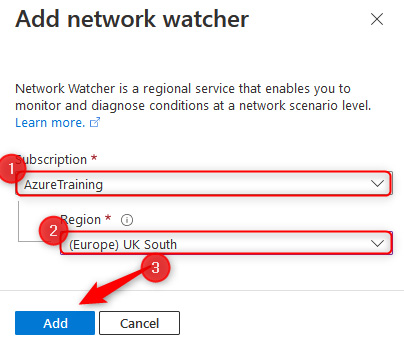
Figure 18.12 – Enabling a new Network Watcher region
Now that Network Watcher is enabled, we can actually start monitoring the network resources.
Monitoring network connectivity
Network monitoring can be used for monitoring connection reachability, latency, and network topology changes. To do this, you need to set up a Connection Monitor instance.
Take the following steps to set this up:
- With the Network Watcher resource still open, in the left menu under Monitoring, select Connection monitor. Click + Create.
- We are going to use the monitor resource for testing the connectivity between VM1 and VM2. Therefore, enter the following values and click Next: Test groups >>:
- Connection Monitor Name: VM1-VM2-Test.
- Subscription: Select the subscription where the VMs are deployed.
- Region: Select the region you chose for your VMs.
- Workspace configuration: Leave the default option checked (this will create a new workspace for you):
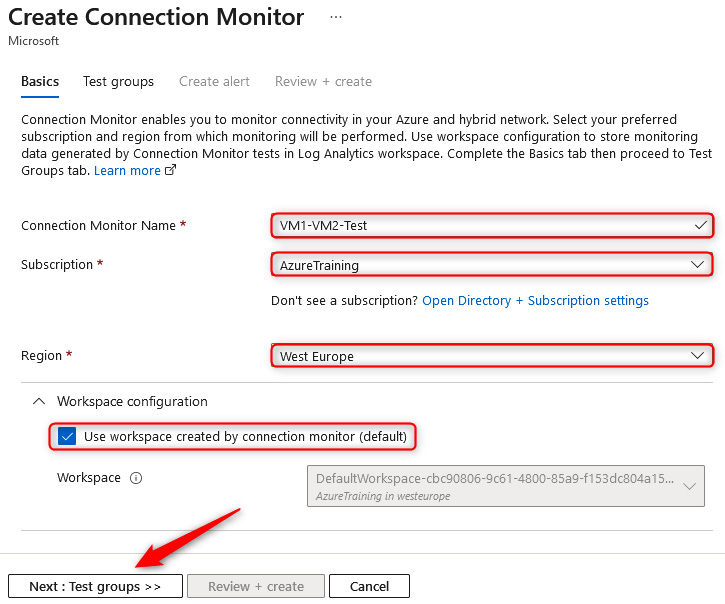
Figure 18.13 – Create Connection Monitor, Basics
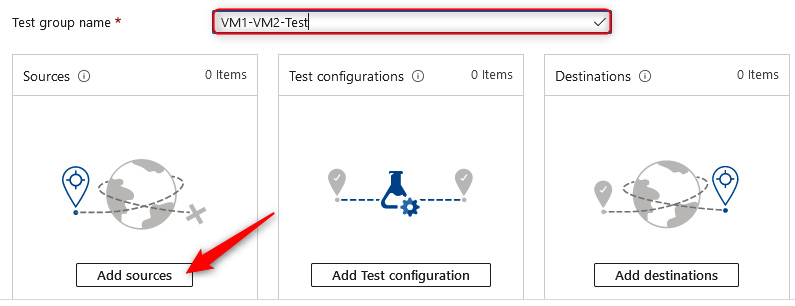
Figure 18.14 – Create Connection Monitor, Add sources
- On the Add Sources blade, select your networkwatcher1 VM, then click Add endpoints at the bottom of the screen:
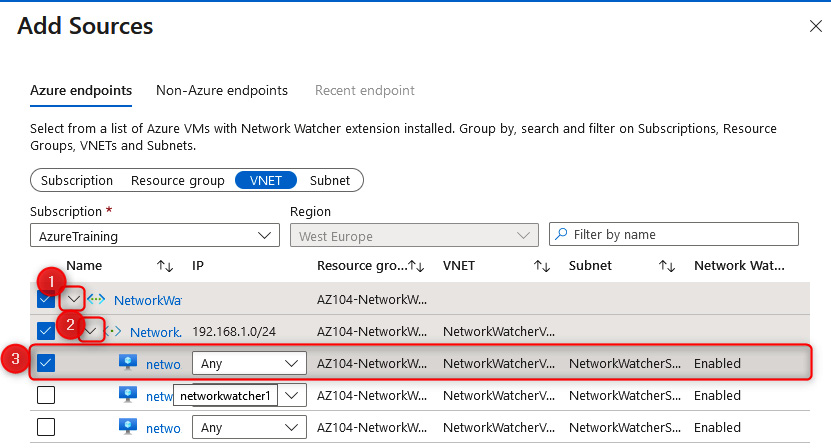
Figure 18.15 – Adding a Connection Monitor source
- Perform the same for Add destinations, this time selecting networkwatcher2. Click Add endpoints at the bottom of the screen:
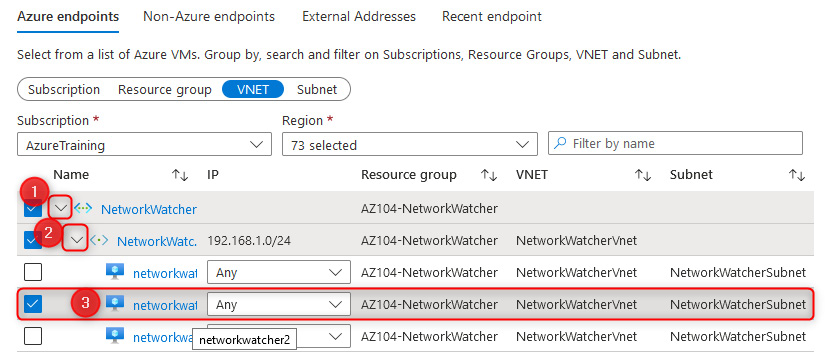
Figure 18.16 – Adding a Connection Monitor destination
- Click Add Test configuration, then enter the following into the blade. Click the Add Test configuration button at the bottom when done:
- Test configuration name: VM1-VM2-Test-Config.
- Protocol: TCP.
- Destination Port: 3389.
- Check the Listen on port checkbox.
- Test Frequency: Every 30 seconds.
- Checks failed (%): 5.
- Round trip time (ms): 100.
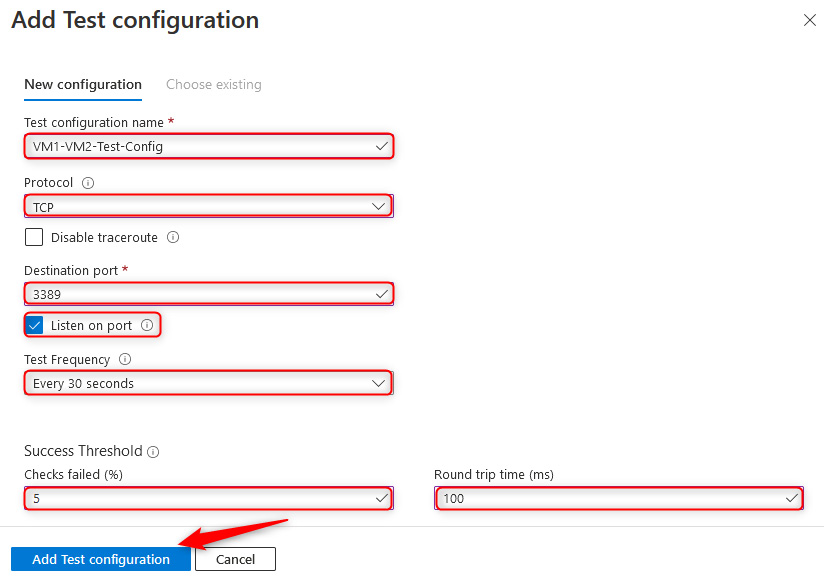
Figure 18.17 – Connection Monitor settings
- Click Add Test Group.
- Click Next: Create alert >>.
- Note that you can create an alert by clicking the Create alert checkbox at the top of the screen. Click Select action group near the bottom of the page. You can create an action group by entering your email address and clicking Create action group, or by selecting an existing one. Click Done.
- Click Review + Create, then click Create.
- You will notice after a few minutes that the connection is good and gets a pass:
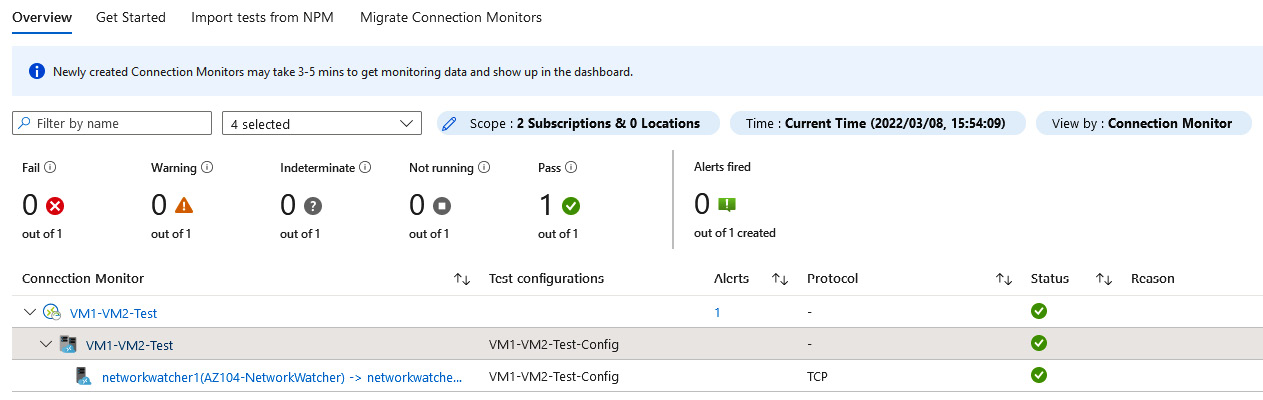
Figure 18.18 – Connection Monitor Overview
We are now able to monitor the network connectivity. In the next section, we are going to look at how to manage the connectivity.
Managing VNet connectivity
As you are now aware, you can manage your VNet connectivity from the Azure portal. In the upcoming section, we are going to look at the possibilities that the Azure portal has to offer to manage the VNet connectivity.
Network topology
The network topology section in the Azure portal displays an overview of the VNets inside an Azure subscription and a resource group. To view the network topology section, you have to take the following steps:
- Navigate to the Azure portal by opening https://portal.azure.com/.
- Click the hamburger menu in the top-left corner of the Azure home screen. Select All services.
- Type network watcher in the search bar, and click Network Watcher.
- Under the Monitoring context, select Topology.
- Select the required details in Subscription, Resource Group, and, if relevant, Virtual Network, as shown in the following screenshot:
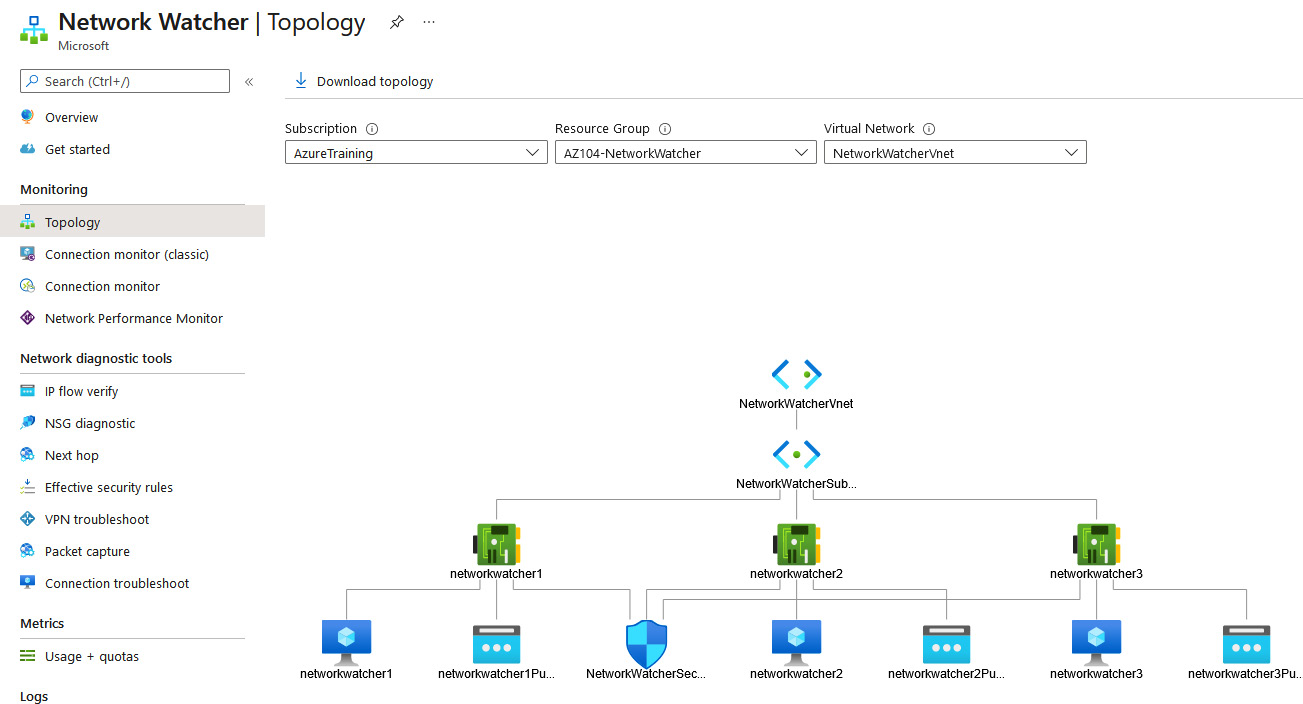
Figure 18.19 – Network Topology
Top Tip
Note that if you are not able to find your resource group in Topology under Network Watcher, you can also develop this by navigating to your VNet and selecting Diagram under the Monitoring context.
- You can now drill down into all the components of the network, such as the VNet, Network interface card (NIC), VMs, and IP address, by clicking on the items in the topology. This will take you to the settings of the different resources.
- You can download the topology as well, by clicking the Download topology button in the top menu:
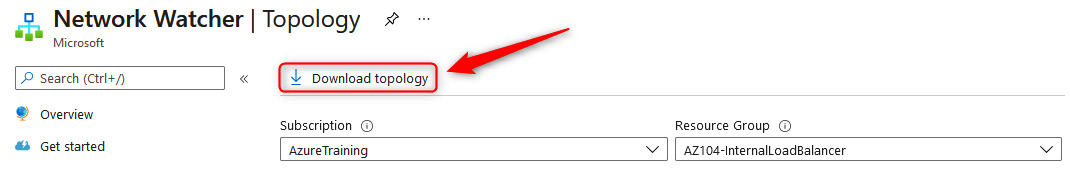
Figure 18.20 – Downloading Network topology
Besides monitoring the networks in Azure, you can also monitor the on-premises connectivity. We are going to look at this in the next section.
Monitoring on-premises connectivity
You can monitor your on-premises connectivity using Network Watcher as well. It offers two different features for this, NPM and VPN troubleshoot, which, just like the other features, are accessible from the Azure portal.
Configuring next hop
You can use the next hop feature to specify a source and destination IPv4 address. The communication between these addresses is then tested, and you will get informed about what type of next hop is used to route the traffic. When you experience a routing error or problem, you can add, change, or remove a route to resolve this.
Top Tip
If you don't see your resource group as one of the options in the drop-down selection, give it a few minutes and it should show up as an option. Another option you can try is to trigger a change on your VM such as changing the size.
To see this in action, you need to take the following steps:
- Navigate to the Azure portal by opening https://portal.azure.com/.
- Click the hamburger menu on the top-left corner of the Azure home screen. Select All services.
- Type network watcher in the search bar, and click Network Watcher.
- Under the Network diagnostic tools context, select Next hop.
- In the settings blade, add the following values:
- Resource group: AZ104-NetworkWatcher.
- Virtual machine: networkwatcher1.
- Network interface: This is selected automatically.
- Source IP address: This is selected automatically as well.
- Destination IP address: 13.107.21.200 (a Bing server IP address).
- Select Next hop.
- You will see the following result. In this case, there is no next hop because the connection is going straight to the internet, therefore, it shows Next hop type as Internet:

Figure 18.21 – Next hop result
- If you change the destination IP address to one of the IP addresses of the other VMs, which in my case is 192.168.1.5, you will see the following result:
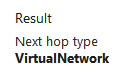
Figure 18.22 – Next hop result 2
You have just evaluated the next hop within the Azure network fabric and understand how your traffic will flow. You now know how to identify whether your traffic is flowing along the intended path to the destination. This tool will help you identify potential initial network flow issues in the future and save you time. In the next section, we are going to look at how to troubleshoot a VPN connection.
VPN troubleshoot
For the VPN troubleshoot demonstration, we are going to use the VPN connection that we created in the previous chapter.
You can diagnose the VPN connection by taking the following steps:
- From the Network Watcher blade, select VPN troubleshoot from under Network diagnostics tools.
- In the VPN troubleshoot blade, you can filter your VPN gateway choice by selecting the subscription, resource group, and location:
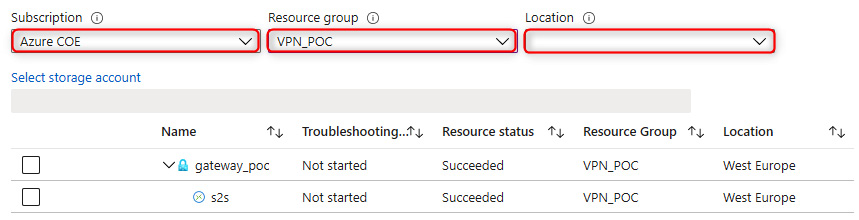
Figure 18.23 – VPN troubleshoot
- You can start the troubleshooting diagnostic by selecting the checkbox next to your corresponding gateway. You also need to select or create a storage account for storing the diagnostic information. After selecting the checkbox, you can start the troubleshooting process by clicking Start troubleshooting in the top menu, as shown in the following screenshot:
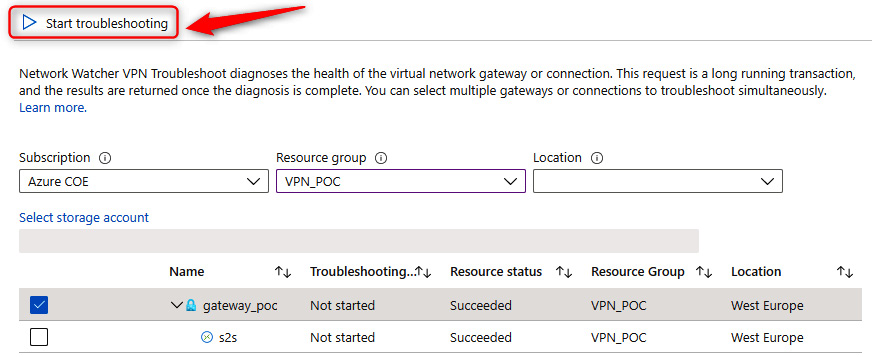
Figure 18.24 – VPN troubleshoot, Start troubleshooting
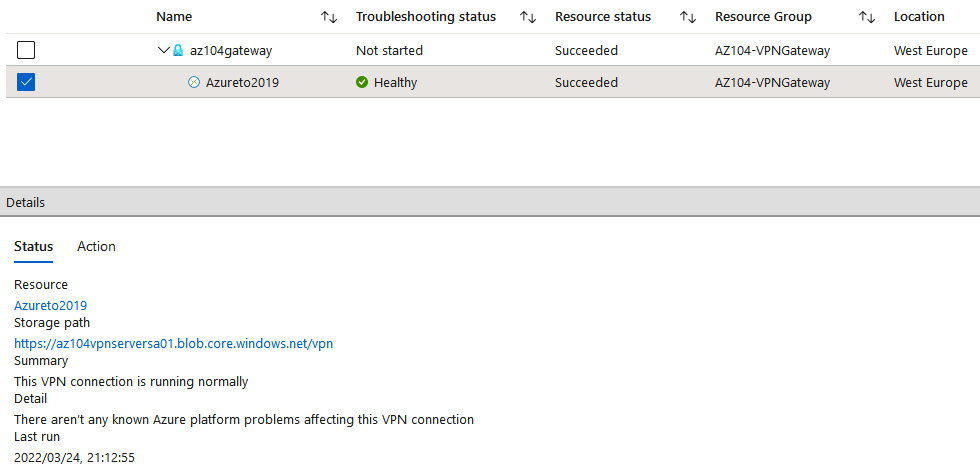
Figure 18.25 – VPN troubleshoot, troubleshooting
Should you have an issue, you can click on the Action tab to see the recommendations:
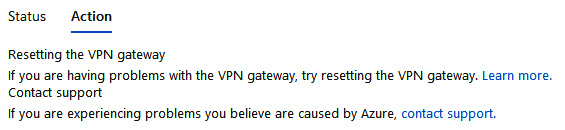
Figure 18.26 – VPN troubleshoot, Action
You can manage external networking using Azure Network Watcher as well. We will cover this in the upcoming section.
Troubleshooting external networking
Azure Network Watcher offers three features to monitor and troubleshoot external networking. The features are IP flow verify, Effective security rules, and Connection troubleshoot, which are going to be covered in the next sections.
IP flow verify
With IP flow verify, you can detect whether a package is allowed or denied to or from a network interface of a VM. Included in the information are the protocol, the local and remote IP addresses, the direction, and the local and remote ports. When a packet is denied, the name of the routing rule that denies the packet is returned. You can use this to diagnose connectivity issues from or in the on-premises environment and to and from the internet. You can basically choose any source or IP address to verify the connectivity.
To run IP flow verify, you need to enable an instance of Network Watcher in the region where you plan to run the tool. This is similar to the demonstration covered in the Enabling Network Watcher section that appeared earlier in this chapter, where we enabled Network Watcher for a particular region.
Using IP flow verify
In this demonstration, we are going to use IP flow verify to test the connection between two of the VMs that we created in the first demonstration. To use IP flow verify, perform the following steps:
- Inside the Network Watcher resource blade, under the Network diagnostic tools context, select IP flow verify.
- On the settings page, add the following settings:
- Resource group: AZ104-NetworkWatcher.
- Virtual machine: networkwatcher1.
- Network interface: This will be filled in automatically after selecting the VM.
- Protocol: TCP
- Direction: Outbound
- Local IP address: This is filled in automatically as well.
- Local port: 60000.
- Remote IP address: 13.107.21.200 (a Bing server IP address).
- Remote port: 80.
- Click the Check button and notice the successful result.
- The request is executed and the result it will return will be that access is allowed, because of the AllowInternetOutBound security rule, as shown in the following screenshot:
Figure 18.27 – AllowInternetOutBound
- Repeat the actions up to Step 3 again, and this time, make the following changes:
- Direction: Inbound
- This will result in the following, which is denied because of the DenyAllInBound rule:
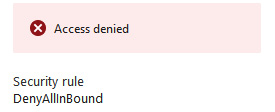
Figure 18.28 – DenyAllInBound
We've looked at how to use IP flow verify to test the connection between two of the VMs. In the next part, we are going to look at effective security rules.
Effective security rules
The effective security rules feature displays all the security rules that are applied to the network interface and the subnet where the network interface is. It then aggregates both. This will give you a complete overview of all the rules that are applied to a network interface, and it will give you the ability to change, add, or remove rules. You need to select the right subscription, the resource group, and the VM to get an overview of the applied security rules, as shown in the following screenshot:
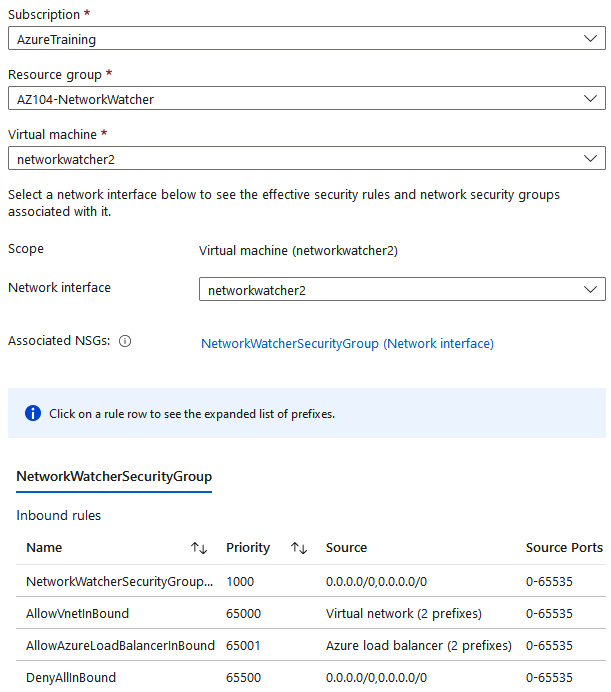
Figure 18.29 – Network Watcher, effective security rules
We've now seen an overview of the security rules that are applied to the network interface. In the next section, we are going to cover connection troubleshoot.
Connection troubleshoot
Azure Network Watcher connection troubleshoot enables you to troubleshoot network performance and connectivity issues in Azure. It provides visualization of the hop-by-hop path from source to destination, identifying issues that can potentially impact your network performance and connectivity.
Azure Network Watcher connection troubleshoot provides the following features and insights:
- A graphical topology view from your source to destination.
- It checks the connectivity between the source (VM) and the destination (VM, URI, FQDN, or IP) address.
- It offers hop-by-hop latency.
- It can identify configuration issues that are impacting reachability.
- It provides all possible hop-by-hop paths from the source to the destination.
- It checks latency (such as minimum, maximum, and average latency) between the source and destination.
- The number of packets dropped during the connection troubleshoot check.
Top Tip
Connection troubleshoot requires that the source VM has the AzureNetworkWatcherExtension VM extension installed. For installing the extension on a Windows VM, you can refer to https://docs.microsoft.com/en-us/azure/virtual-machines/extensions/network-watcher-windows?toc=/azure/network-watcher/toc.json, and for a Linux VM, you can refer to https://docs.microsoft.com/en-us/azure/virtual-machines/extensions/network-watcher-linux?toc=%2Fazure%2Fnetwork-watcher%2Ftoc.json.
To check network connectivity using connection troubleshoot, you have to take the following steps:
- From the Network Watcher overview blade in the Azure portal, under the Network diagnostic tools context, select Connection troubleshoot.
- Select your subscription and resource group.
- Select Virtual machine in Source type and then select your VM.
- For the Destination settings, select the Specify manually radio button, enter www.packt.com in URI, FQDN or IP address, set Protocol to TCP, and set Destination port to 80.
- Click Check. The agent will automatically be installed on the source machine when you click the check button if it is not installed already.
- Notice the success message:
Figure 18.30 – Reachable
- Try the same, this time setting Destination to a VM and selecting another VM. Set Destination port to 22. Click Check.
- Notice the failure message you receive:
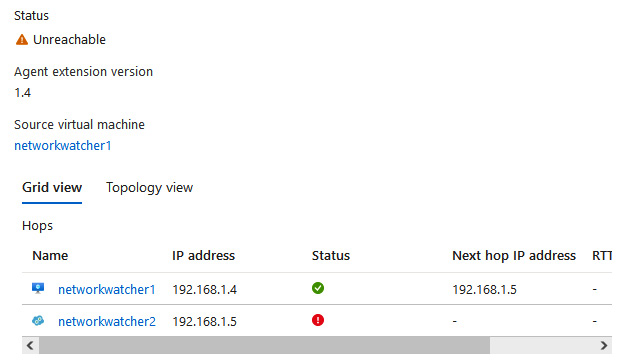
Figure 18.31 – Connection troubleshoot error
We have now checked an outbound connection from a VM using connection troubleshoot and seen both a success and failure message from the system.
Summary
In this chapter, we covered the fifth part of the Configuring and Managing Virtual Networking objective by covering how to monitor and troubleshoot your network traffic in Azure Network Watcher. We also covered how to monitor and troubleshoot on-premises and external network connectivity using Network Watcher. You should now feel confident in not only implementing network infrastructure components within Azure but also in the monitoring and management of those services. You should be comfortable in distinguishing the difference between the various services available in Azure, and comfortable in identifying which tools you should use to troubleshoot issues on your networks using Network Watcher.
In the next chapter, we will cover some labs, and you will get to test some of your new-found skills and become more confident in working with networks in Azure.