
7
Energy Resource Management
This chapter will help you optimize energy resource management within your information and communication technology (ICT) equipment. You will also learn how companies managing their energy more effectively can significantly impact industrial competitiveness, energy cost structure, and scope two greenhouse gas emissions.
This chapter’s main objectives are to better understand the energy consumption from IT assets and primarily, your end user IT equipment. Second, you will start to understand how you can measure and understand your energy consumption patterns. Finally, what actions can you take to reduce your energy consumption?
In this chapter, we will cover the following topics:
- Overall transition to a low-carbon future
- Energy consumption from IT hardware
- Step-change to energy resource efficiency
This chapter’s sustainable IT reference model perspective, as illustrated in Figure 7.1, will primarily cover IT hardware life cycle management within the sustainable IT enterprise section and energy within the data center and cloud section. We will examine how these two capabilities can play an integral part in your sustainable IT plan to reduce greenhouse gas emissions from efficient energy resource management.
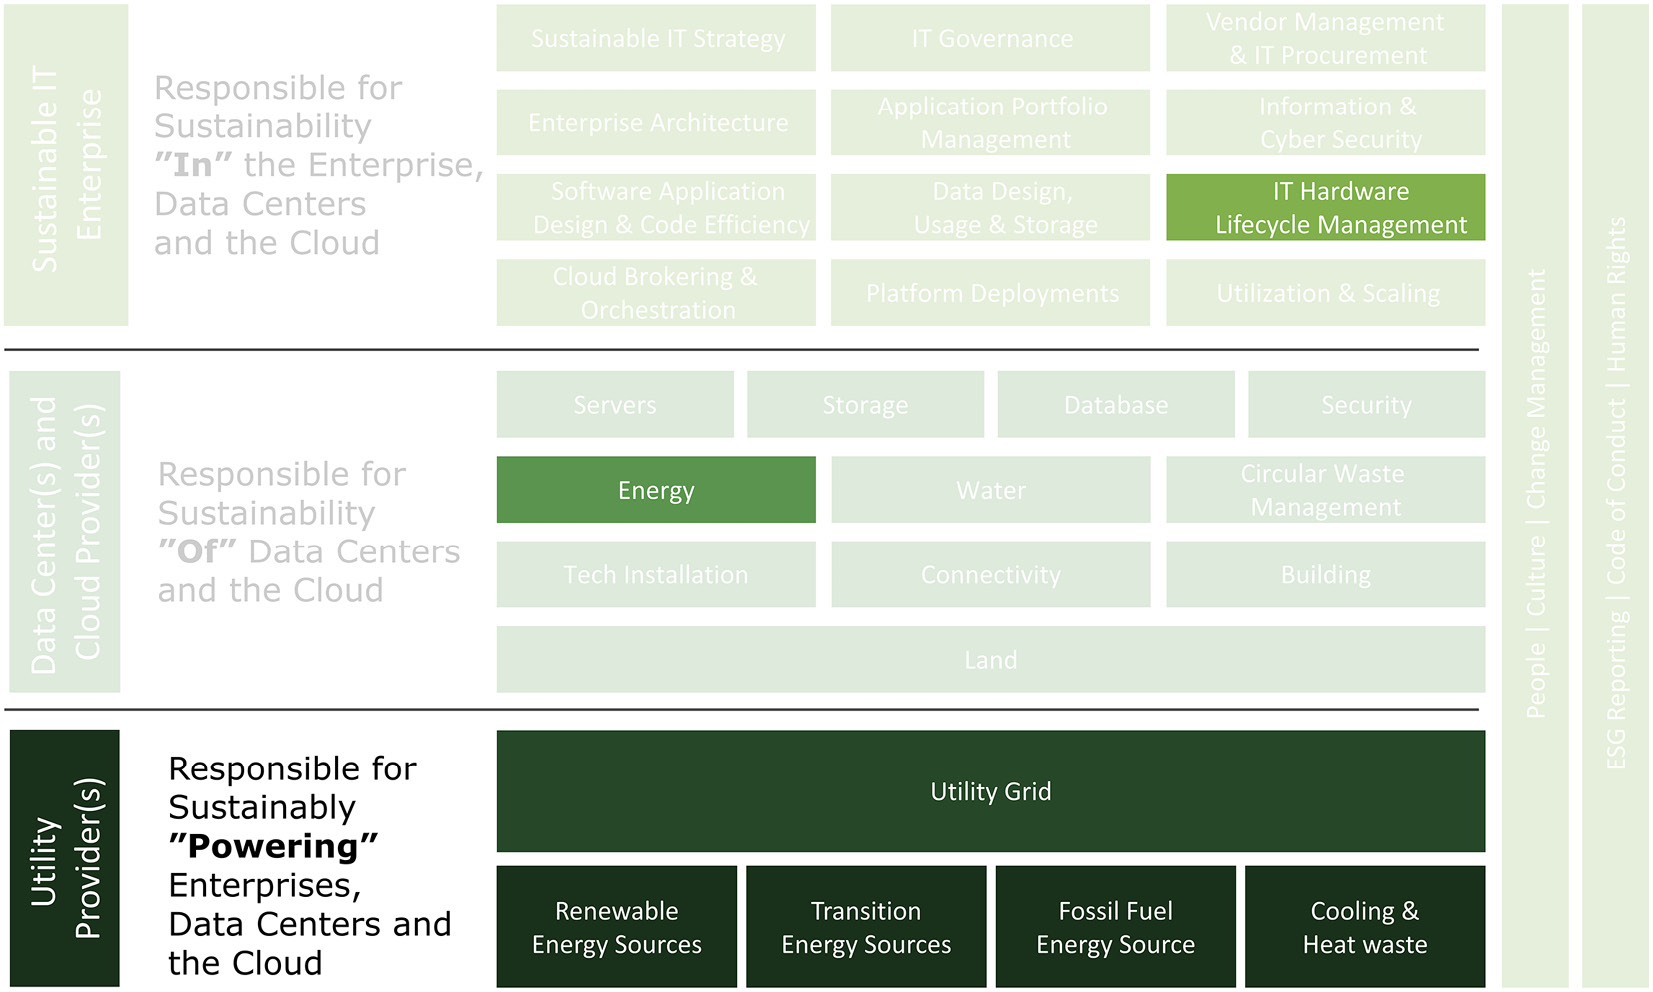
Figure 7.1 – Sustainable IT reference model – Chapter 7 focus
By the end of this chapter, you will have learned about energy mix, energy and foreign policy, and the importance of energy security within ICT. Furthermore, you will better understand the energy consumption of various ICT devices, energy consumption patterns, and how you can conduct similar calculations on your own IT equipment to calculate energy and carbon dioxide emissions. Finally, you will gain insights into how you can take action to improve your resource efficiency.
Transitioning to a low-carbon future
There are two essential aspects to consider when we refer to a low-carbon future: energy security and energy efficiency. The first factor, energy security, has been around for decades, but what does it mean? The European Commission and the International Energy Agency (IEA) define it as providing reasonably priced, reliable, and environmentally friendly energy (Müller-Kraenner 2007). Although it is a straightforward definition, can you fulfill all three variables to achieve energy security? What price are we willing to pay for energy that is also environmentally friendly? Are you able to get access to reliable energy that is environmentally friendly? The second factor is energy efficiency, where we need to ensure that we do more with less by reducing our energy demand. For every watt of energy that we produce, we need to ensure that we can stretch it further. The greenest and cheapest energy is the energy we do not use.
As Greenpeace highlights in the quote at the beginning of the chapter, data centers and digital infrastructure can either be a tremendous opportunity to make the transition to a low-carbon future, or it can be a significant deterrent because of the ever-increasing need for computing and storage power that will continue to accelerate. Today, there are roughly 5 billion people on the internet, roughly 63 percent of the worldwide population. Of these 5 billion internet users, 4.65 billion are on social media (Johnson 2022). By 2025, the projection is that there will be 30 billion connected devices, up from 13.8 billion in 2021 (L. S. Vailshery 2021). The servers currently powering the internet leave a giant carbon footprint behind. If the internet were a sovereign state, its electricity use would place third after the United States and China (Markkanen 2021).
Energy consumption is the most significant contributor to reducing carbon emissions over time. As we saw in Chapter 1, Our Most Significant Challenge Ahead, 41% of total emissions come from the energy sector. It is primarily because energy sources draw from fossil fuels such as coal and oil. Most considerations about the energy transition to a low-carbon future include renewable technologies such as wind, solar, hydropower, geothermal, and energy storage. Nuclear power is also considered a low-carbon energy source but not renewable.
As illustrated in Figure 7.2, the global energy supply is expected to double by 2030 to 40,000 terawatt hours (TWh) compared to 20,000 TWh in 2010 in a typical scenario. In a worst-case scenario, it is expected to triple to 60,000 TWh per year (Andrae, Anders S.G.; Edler, Tomas 2015).
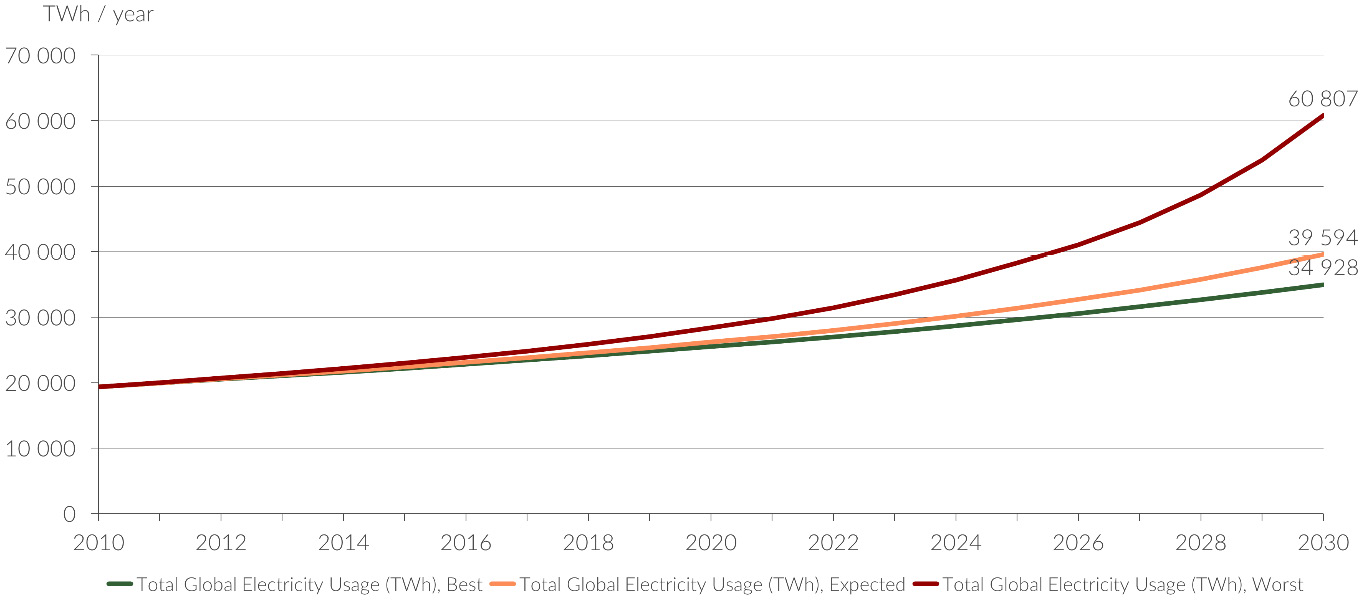
Figure 7.2 – Global electricity supply forecast (TWh) 2010-2030
Whether the energy supply doubles or triples, supplying low-carbon energy to meet future demands will become a significant challenge. The energy transition requires fundamental changes across the whole value chain from how energy is produced, delivered, and consumed by billions of consumers and businesses in a sustainable global economy.
The energy mix
Decarbonizing the energy system requires a radical shift from today’s use of fossil fuels to low-carbon energy sources. Three components comprise total energy production: electricity, transport, and heating. It is essential to understand that energy and electricity are not the same, and sometimes they are wrongfully used interchangeably. Usually, you will read about quoted figures in the news on our progress on decarbonization that primarily refers to electricity and not energy. Figure 7.3 illustrates the different energy mixes between electricity and total energy (Ritchie, Hannah 2020):
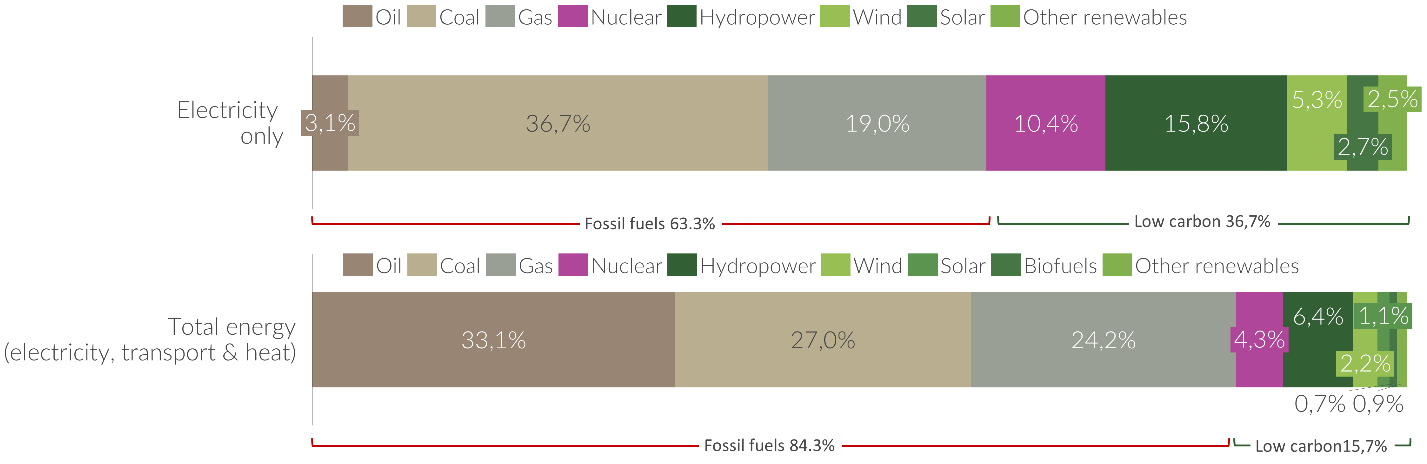
Figure 7.3 – Share of low-carbon sources in electricity and total energy
Over one-third (36.7%) of global electricity comes from low-carbon sources, but for total energy, that figure is significantly lower, whereas only 15.7% comes from low-carbon sources. The main reason is that heating and transport mainly rely on fossil fuels, such as oil, coal, and gas. It is equally essential that we decarbonize the entire energy system and not just electricity. The International Energy Agency projects that the number of electric vehicles will increase five- to eleven-fold by the end of the decade to the 2019 baseline (IEA, 2020). Therefore, it is critical that the increased need to power the transport sector with renewable energy can be met. We need to decarbonize the entire energy system and not only electricity.
As increased regulations and ambitious clean energy goals announced before and during the COP26 Climate Conference are introduced to reduce greenhouse gases toward a low-carbon future, massive deployment of renewable energy is required. The share of wind and solar in the total electricity and energy mix is still low. In recent years, solar and wind prices have decreased tremendously, and production efficiency has improved, making these renewable energy sources financially viable. Today, for example, solar energy is cheaper than coal, oil, and gas in over 30 countries and is continuously becoming exponentially cheaper (Carlsson, 2021). However, one challenge with solar and wind is that it is still expensive to store and not very effective. Further investments into battery technologies are required to allow renewables to become more reliable energy sources.
The green transition and the electrification of society with its demands for fossil-free energy sources fundamentally challenge electricity production. Although renewable energy prices are rapidly becoming cheaper and more readily available, there are also more and more reports of the lack of electricity to handle the growing needs of the industry successfully. Therefore, energy storage is a crucial part of the transition to optimize the use of “green electricity.” With energy storage, the peaks in production are evened out simultaneously as the battery storage contributes to the electricity grid’s stability—a meaningful way to prevent power shortages and succeed with the green transition.
The IEA predicts that global renewable energy will rise 60% from 2020 to 4,800 GW in 2026. That is the current capacity of fossil fuel and nuclear power combined (IEA 2021). Furthermore, the prediction is that 95% of the increase in power capacity will be renewable energy, whereas solar photovoltaics (PV) will account for more than half. The growth between 2021 – 2026 is expected to be 50% higher than during 2015 – 2020 (IEA 2021).
Energy and foreign policy
Four significant players dominate the energy market reins: the United States, China, Russia, and the European Union. With the demand for decarbonizing the energy market, energy security is a foreign policy and a national security topic in the 21st century. Figure 7.4 illustrates a breakdown of per capita electricity from fossil fuels, nuclear, and renewables (Ritchie and Roser 2020):
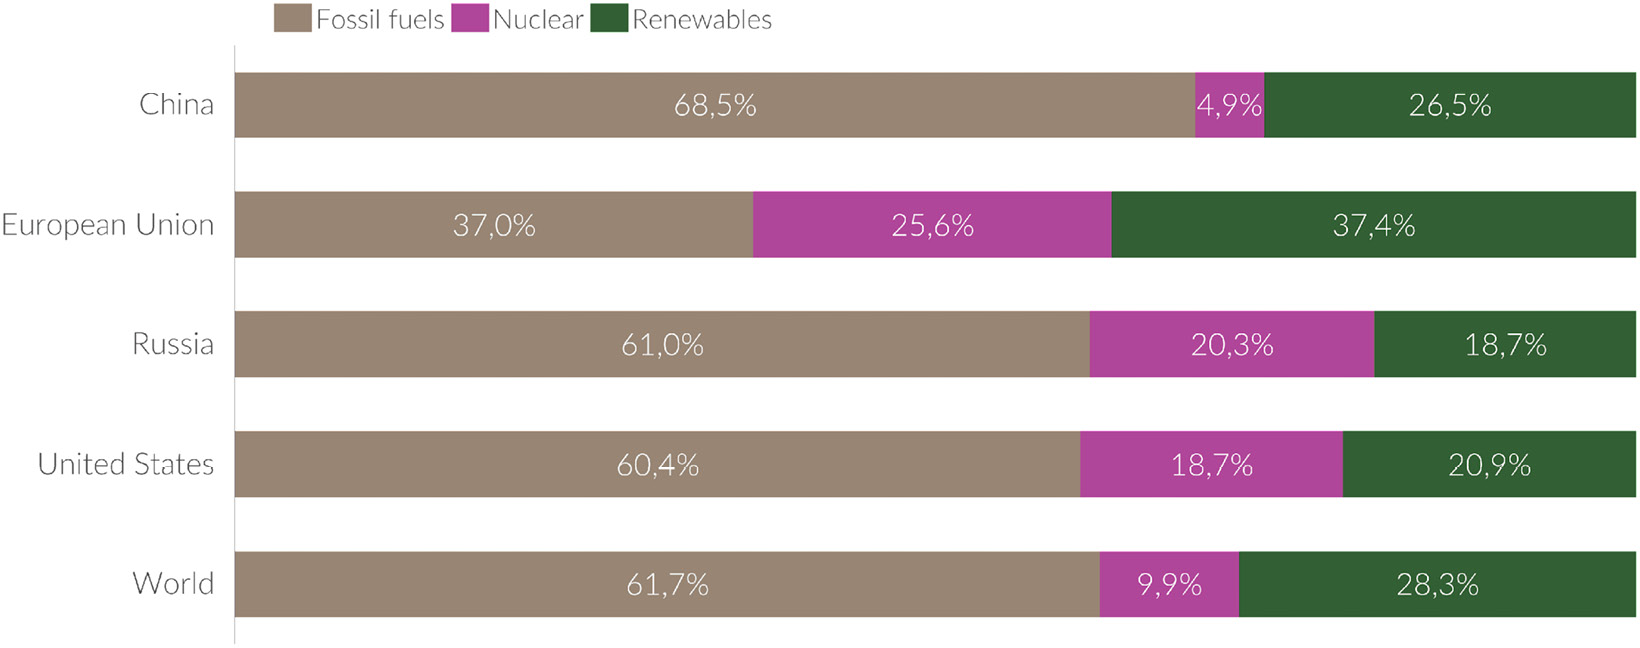
Figure 7.4 – Breakdown of per capita electricity from fossil fuels, nuclear, and renewables
All four significant players still heavily rely on fossil fuels for electricity, whereas the European Union and its 27 member states have come the furthest on their decarbonization journey, having 37.4% of renewable energy and a total of 63% from low carbon sources.
With geopolitical uncertainty in the world with the war in Ukraine (at the time of writing) and, as a result, sanctions imposed on Russia by the United States and European Union, the energy supply has become a critical issue threatening to set in motion a European energy crisis. Russia is a significant supplier of energy for Europe and Asia. 30% of the European Union’s gas comes from Russia. European countries with a high dependency on Russian gas are Finland (94%), Latvia (93%), Bulgaria (77%), Romania (76%), Germany (49%), Italy (46%), Poland (40%), and France (24%) (ACER 2020). This has led to some constraints on electricity production. For example, in Germany, the share of coal in electricity generation has increased 12.5% to roughly one-third since the beginning of the war. The European Commission has declared its intention to end Europe’s reliance on Russian gas, diversify gas supplies, and reduce dependency on fossil fuels by increasing the share of renewable energy.
Another continent where demand for modern energy is growing rapidly but also scarce is Africa. Africa uses the least amount of modern energy per person worldwide (IEA 2022). In Sub-Saharan Africa (excluding South Africa), the average annual energy usage is 180 kWh, compared to 13,000 kWh in the US and 6,500 kWh in Europe (ADBG 2022). Efficiency keeps modern energy affordable while demand in Africa rises. The continent has the lowest power access rate, at slightly over 40%, which applies to the more than 640 million people in Africa who lack access to energy.
To better understand Africa’s energy situation, I sat down with Tony Tiyou, the founder and CEO of Renewables in Africa. His vision is to bring back power into Africa, close the energy gap, and transition into a fully electrified continent by 2040. Tony believes there is a fantastic potential for renewable energy sources in Africa, especially solar but also wind, hydro, biomass, and geothermal. Despite having only 1% of the world’s installed solar PV capacity, Africa is home to 60% of the finest solar resources (IEA 2022). While solar energy is paving the way for the future of electricity in Africa, Tony also envisions a future scenario where Africa will become a net exporter of energy to Europe, given the fantastic solar PV potential. That might not solve Europe’s imminent energy crisis but may be an excellent enabler for sustainable socio-economic development and growth in the future on both continents.
With the global electricity supply expected to double or triple by 2030, energy security is an essential topic for domestic and foreign policy and a private sector issue, especially within ICT, where the demand is expected to rise faster than the global demand.
The importance of energy security in ICT
In 2010, the ICT sector consumed roughly 2,000 TWh annually. In an expected scenario, that energy supply is expected to fourfold to 8,000 TWh for the entire ICT sector (Andrae, Anders S.G.; Edler, Tomas 2015). Figure 7.5 illustrates the expected global ICT electricity supply forecast:
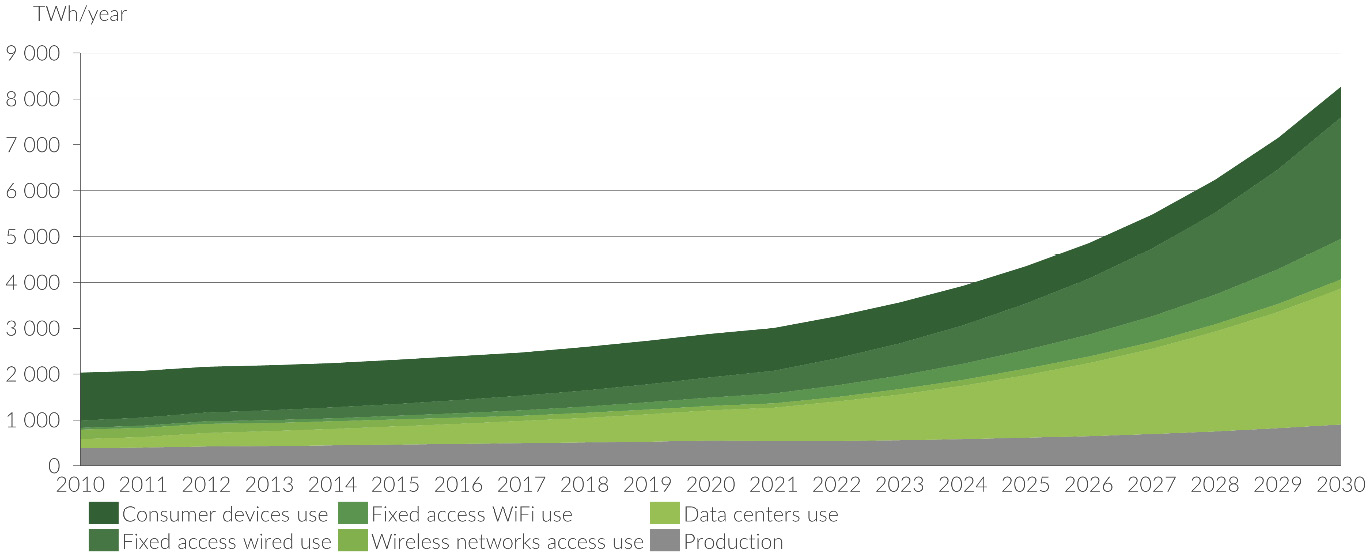
Figure 7.5 – Global ICT electricity supply forecast (TWh) 2010-2030
The primary growth drivers in the global ICT electricity supply forecast are fixed access wired and data center use. With data center use expected to rise to nearly 3,000 TWh annually by 2030, and almost 8,000 TWh in a worst-case scenario (Andrae, Anders S.G.; Edler, Tomas 2015), we may find ourselves, in 2030, looking at a scenario for the data centers alone consuming between 7.5% to 20% of the total electricity based on a 40,000 TWh global electricity demand. As we mentioned earlier in the chapter, data centers and digital infrastructure can either be a tremendous opportunity to transition to a low-carbon future or a significant deterrent because of the ever-increasing need for computing and storage power that will continue to accelerate. With the current data centers and servers powering the internet leaving a giant carbon footprint behind, it is pivotal for the ICT sector to transition to a low-carbon future.
Ultimately, it comes down to managing risk for the ICT sector. To protect themselves from power price volatility, reduce their environmental impact, and improve their brand reputation, ICT companies are investing considerable sums in renewable energy. ICT, mainly technology, companies have accounted for about half of global corporate renewable energy procurement in the last five years (BloombergNEF 2021). In 2021, corporate clean energy buying reached a record year of 31.1 gigawatts (GW) through power purchase agreements (PPAs). That is a 24% increase from the previous record year, which landed on 25.1 GW. In the last five years, the procurement of global PPA volumes has surged to record numbers in the past five years. In 2021, two-thirds of the PPA purchases occurred in the United States, where the giant tech firms signed more than half of the deals. Figure 7.6 illustrates the breakdown of the 10 largest corporate purchasers of clean energy in 2021.
What is a PPA?
A power purchase agreement, sometimes known as an energy power agreement, is a legal arrangement between two parties: the seller, who produces the electricity, and the buyer, who wants to acquire the electricity. The PPA outlines all of the business parameters governing the sale of electricity between the two parties, including the start date of the project’s commercial operation, the supply schedule, the consequences of underdelivering, the terms of payment, and termination. A PPA is a leading contract that establishes a generating project’s revenue and credit standing, making it a crucial tool in project financing. PPAs come in various formats today, each tailored to the requirements of the buyer, seller, and financing counterparties.
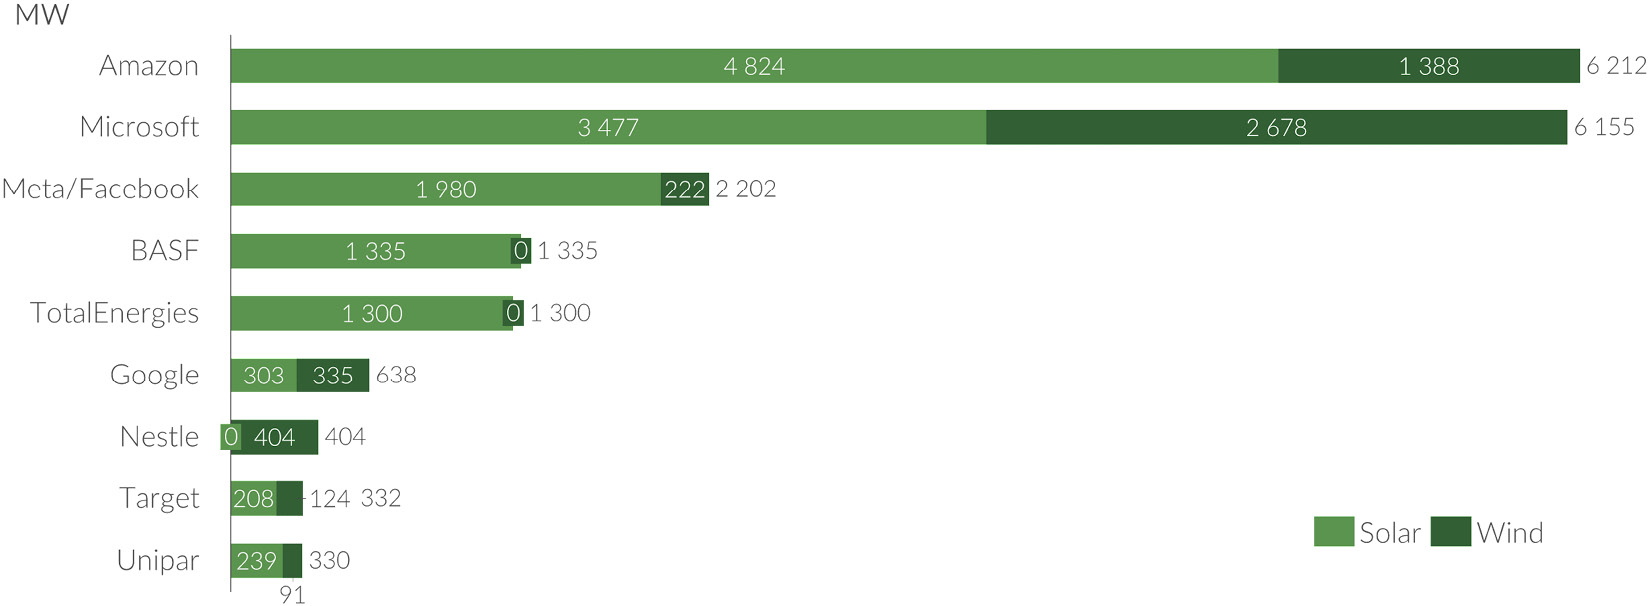
Figure 7.6 – Top corporate buyers of clean energy in 2021 (BloombergNEF 2022)
The top three spots are claimed by Amazon, Microsoft, and Meta/Facebook, with Google being the sixth-largest buyer. These large technology companies’ PPA portfolios are now on par with some of the largest utility companies in the world (BloombergNEF 2022). Let us take a closer look at these technology players’ energy portfolios:
- Amazon was the largest corporate buyer purchasing 4.8 GW in solar and 1.4 GW in wind for a total of 6.2 GW, reaching 65% renewable energy across the business in 2020. In 2021, Amazon made a giant leap forward, and by the end of the year, 85% of Amazon’s operations were fueled by renewable energy sources (Amazon 2022). This is the second year in a row where Amazon was the biggest buyer and currently has a total capacity of 15.7 GW, comprising 310 renewable energy projects and 176 on-site solar systems (Amazon 2022). In terms of transparency, it lacks a bit because Amazon reports its share of renewable energy powering its different businesses, such as Amazon Web Services.
- Microsoft was the second-largest corporate buyer purchasing 6.2 GW, comprising 3.5 MW of solar and 2.7 GW of wind in 2020. This also includes a long-term agreement with the AES energy company to power its Virginia data centers with around-the-clock renewable energy (Miller 2022). This brings Microsoft’s total up to 8 GW of renewable energy via PPAs or long-term contracts (Microsoft 2022). Microsoft has already reached 100% renewable energy across its business through a mixture of powering operations with renewable energy and matching with renewable energy purchases. Microsoft has set aside a one-billion-dollar investment fund for sustainable investment and innovation. Some of these are dedicated to energy efficiency, hydrogen-powered backups, and water-submerged data centers.
- Meta/Facebook is the third-largest buyer of PPAs, buying 2.0 GW of solar and 0.2 GW of wind for a total of 2.2 GW in 2020. Meta/Facebook has committed to achieving net zero emissions throughout its value chain by 2030.
- Google, the sixth-largest buyer of PPAs, bought 0.3 GW of solar and 0.3 GW of wind at a total of 0.6 GW. Google currently has 6 GW of renewable energy projects under contract worldwide (Google 2022). Google has already reached 100% renewable energy across its business through a mixture of powering operations with renewable energy and matching with renewable energy purchases.
Who would have thought that in the year 2022, some of the most prominent technology players in the world would also be the largest purchasers of clean energy? In the next section, we take a closer look at the energy consumption from IT hardware to understand better how you can select energy-efficient hardware and run it more efficiently.
Energy consumption from IT hardware
In Chapter 6, IT Hardware Management, we looked at the entire IT hardware life cycle from the cradle to the grave of a product. Still, in this section, we will take a closer look at the energy consumption from various IT hardware devices. We will focus primarily on two categories: end-user equipment such as computers, smartphones, tablets, and monitors, and data centers such as enterprise servers, storage, and network equipment. As you will discover in the following few sections, there are several things that you can do to improve the energy consumption of your ICT devices.
To assess how energy efficient these ICT devices are, we will use the allowable thresholds from Energy Star. Energy Star (https://www.energystar.gov/) is a program run by the US Environmental Protection Agency (EPA) and the US Department of Energy (DOE). The program promotes the efficient use of energy in electronic products and devices. The Energy Star label can be found in over 75 product categories in commercial buildings, industrial plants, and residential homes.
For each category, Energy Star releases a specification that differs between each category. The requirements become stringent for each version released. For computers, the Energy Star 4.0 specifications became effective on July 20, 2007, and it is now into the 8.0 version, which became effective on October 15, 2020 (Energy Star 2020). The scope of the computer specifications includes the following product types: desktop computers, notebook computers, slates/tablets, portable all-in-one computers, workstations, and thin clients. An Energy Star-certified computer should draw 25% to 40% less energy without compromising its performance.
Similarly, for servers, Computer Servers Specification 1.0 was released on May 15, 2009, and is now into its third revision, which came into effect on June 17, 2019 (Energy Star 2019). An Energy Star-certified computer should draw 30% less energy without compromising performance.
Organizations such as Energy Star promote energy efficiency and constantly raise the threshold for what is acceptable within a specific electronics category. This leads to electronics manufacturers constantly improving their energy efficiency to stay within the acceptable threshold to qualify for Energy Star certification. A metric called Base TEC Allowance (kWh) is used to measure the energy efficiency of a device. TEC stands for typical energy consumption, a method of testing and comparing the energy performance of electronic products. As the name suggests, it focuses on typical electricity consumed by a product during regular operation during a representative period. To qualify for an Energy Star rating, the TEC value must not exceed a certain threshold for a particular product type. The calculation to arrive at a particular TEC for a particular product type is quite complex and beyond the scope of this book. For additional reading on Energy Star rating, refer to the Further reading section.
Table 7.1 illustrates a sample of certified IT hardware devices and their yearly kilowatt-hours (kWh) consumption. All Energy Star-certified products sit within the base TEC allowance:
|
ICT Device |
Energy Demand (Yearly TEC kWh) |
|
Desktop PC |
58 |
|
Notebook/Laptop |
14 |
|
Tablet PC |
12 |
|
Smartphone |
3.5 |
|
Home Gateway |
7.2 |
|
Screens |
56.5 |
|
Enterprise Server |
1,760 |
|
Enterprise Storage |
4,467 |
Table 7.1 – Annual consumption of a typical Energy Star-certified IT hardware in the use phase
A notebook/laptop (14 kWh) is roughly four times more energy efficient than a typical desktop (58 kWh). A tablet (12 kWh) is almost five times more energy-efficient than a desktop and one-third more energy efficient than a notebook/laptop. A smartphone with standard usage with one charge per day consumes roughly 3.5 kWh per year. Not surprisingly, your largest energy consumers are IT hardware that sit in a data center that is always powered on, such as servers and storage. This was also confirmed in the life cycle assessment in Chapter 6, IT Hardware Management.
Let us look at three scenarios of a notebook, desktop, and server, commonly found in a workplace and data center setting, and calculate these electrical appliances’ energy consumption and carbon emission. Once we have the carbon emission, we will compare it to how many trees are required to sequester the CO2 emitted into the atmosphere.
To calculate the consumption in kWh, you must consider the following three factors:
- The capacity of your electrical device is expressed in watts
- Number of hours your electrical device runs per day
- Number of days per year your electrical appliance is in use
This leaves us with a formula to calculate the annual consumption of energy in kWh:

To calculate carbon emission in metric tons, you must consider two factors:
- Number of kWh (output from the preceding formula)
- Carbon intensity, in metric ton/kWh. For simplicity, we use the global average carbon intensity of 0.000475 MtCO2/kWh
This leaves us with the formula to calculate carbon emissions expressed in metric tons:

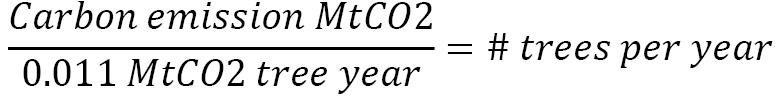
To calculate the number of trees required to sequester carbon emissions in metric tons, you must consider two factors:
- Carbon emission MtCO2 per year (output from the preceding formula)
- Tree carbon sequestration rate MtCO2/tree/year. For simplicity, we use a global average of 11 kg / 0.011 metric tons per tree per year (Akbari 2002)
This leaves us with the following formula to calculate the number of trees per year:
Now let us do a few calculations of a few different IT hardware.
The calculation for the energy consumption and carbon emission of a notebook
In this example, we compare two different scenarios for notebooks with different energy consumption, one low scenario and one high scenario. To accurately represent your notebooks, check the label on your hardware or reference the vendor website. We have picked a notebook that draws 50 W and another one that draws 100 W. Let us assume that the notebooks are powered on 8 hours per day for 275 days per year. Multiplying those equals 2,200 hours per year. The factor that differs between the two notebooks is how many watts it draws per hour. Now let us calculate yearly energy consumption, yearly carbon emission, and how many trees are required to sequester the carbon emission:
|
Capacity of notebook |
50 – 100 watts |
|
Hours/day |
8 hours/day |
|
Days/year |
275 days/year |
Yearly energy consumption calculation for the two notebooks:
Notebook low case scenario: 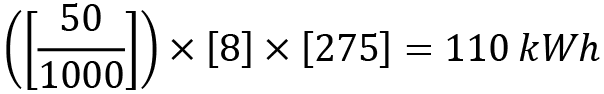
Notebook high case scenario: 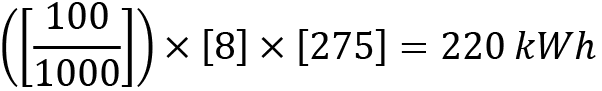
Yearly carbon emission calculation for the respective notebook using the global average carbon intensity factor:
Notebook low case scenario: ![]()
Notebook high case scenario: ![]()
Calculate the number of trees required to sequester the respective notebook:
Notebook low case scenario: 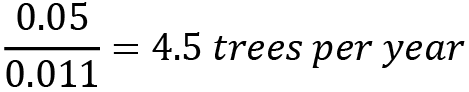
Notebook high case scenario: 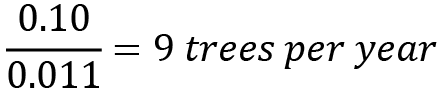
The calculation for the energy consumption and carbon emission of a desktop
In this example, we have chosen a desktop that draws 200 W per hour. To accurately represent your desktop, check the label on your hardware or reference the vendor website. We use the same assumption as the notebook scenario, where we assume that the desktop is powered on 8 hours per day for 275 days per year—multiplying those equals 2,200 hours per year:
|
Capacity of desktop |
200 watts |
|
Hours/day |
8 hours/day |
|
Days/year |
275 days/year |
Yearly energy consumption calculation for a desktop:
Desktop case scenario: 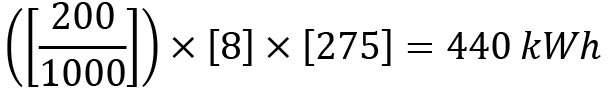
Yearly carbon emission calculation for a desktop using the global average carbon intensity factor:
Calculate the number of trees required to sequester a single desktop:
The calculation for the energy consumption and carbon emission of a server
In the scenario, we have chosen a server that draws 300 W per hour. Depending on the server’s specifications, it can vary anywhere between 300 – 1,500 W per hour. Make sure you check your specifications for your servers and, if possible, the average utilization. Another factor essential to consider is the average workload. Let us assume that we are dealing with a production server powered 24 hours per day for 365 days per year. Multiplying those two factors equals 8,760 hours per year. For the following calculation, we assume a 300 W per hour running at 80% total capacity:
|
Capacity of server |
300 watts |
|
Utilization rate |
80% |
|
Hours/day |
24 hours/day |
|
Days/year |
365 days/year |
Yearly energy consumption calculation for a server:
Server scenario: 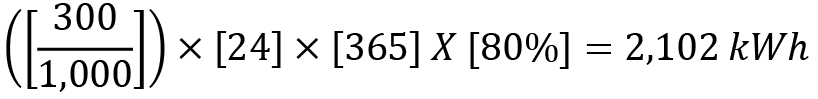
Yearly carbon emission calculation for the server using the global average carbon intensity factor:

Calculate the number of trees required to sequester a single server:
Summary of energy consumption and carbon emission of ICT devices
Suppose we summarize our calculations as seen in Table 7.2. In that case, we see that the energy consumption differs significantly depending on the number of watts drawn but also the duration of the device, which in turn affects the carbon emission:
|
ICT Device |
Energy Consumption (kWh) |
Carbon Emission (MtCO2) |
Carbon sequestrian (trees) |
|
Notebook (Low) |
110 kWh |
0.05 |
4.5 |
|
Notebook (High) |
220 kWh |
0.1 |
9 |
|
Desktop |
440 kWh |
0.21 |
19 |
|
Server |
2,102 kWh |
1.00 |
91 |
Table 7.2 – Summary of yearly energy consumption and carbon emission of ICT devices
As we noted in Table 7.1, a desktop draws four times as much as an energy-efficient notebook and roughly twice as much as a non-energy-efficient notebook, which holds in our calculations. Generally, you should also notice that the yearly TEC is higher in our calculations than what the vendors give as an indication.
To put things into perspective, understanding how many trees are required to sequester the carbon emissions for each device per year differs significantly between an energy-efficient notebook that requires 4.5 trees per year to 90 trees per year to sequester the carbon emission from a server.
Now that we have a basic understanding of the energy demand for several IT hardware devices, let us take a closer look at an end user computing case study to understand your energy consumption patterns and how you can apply the same principle within your environment.
Understanding your energy consumption patterns
In this section, we will take a closer look at an end user computing case study to understand our energy consumption within an enterprise better. There are also tools available on the market that can measure the energy consumption of your ICT devices in near real time, but for this case study, we will calculate all the steps manually.
In Chapter 6, IT Hardware Management, we used a model company with 10,000 computers. For this case study, we will assume that 80 percent are notebooks/laptops and 20 percent are desktops. We will conduct the study over a rolling 12-month period. We assume that the company is in an expansive phase and growing with 10 percent of employees annually, and every new employee receives a notebook instead of a desktop. Regarding energy demand, we use an energy consumption constant (kWh/hour) of 0.07 for desktop computers and 0.02 for notebooks when powered on, and 0.003 and 0.001, respectively, when they are in sleep mode. These energy consumption factors are drawn directly from a tool generally available on the market. We assume that the computers are powered for 168 hours per month. They roughly correspond to our calculations in Table 7.2. Since desktops consume roughly four times as much energy as notebooks/laptops, we also put a plan to replace 50 desktops per month that are end of life with 50 notebooks a month to improve energy efficiency. We do not consider that roughly 30% of computers are typically left on overnight without getting put into sleep mode. In the next section, we will explore how to use those features to maximize energy efficiency by setting computers into sleep mode after a certain period. Figure 7.5 lists the distribution of notebooks over a rolling 12-month cycle. At the start of month 1, there were 10,000 notebooks in all. Note that the distribution of desktops decreases by 50 every month, and the number of notebooks increases by 150 per month due to an increase in employees and swapping out 50 desktops for notebooks. By month 13, the number of notebooks has grown to 9,800, and desktops have decreased to 1,350, amounting to 11,150:

Figure 7.5 – Distribution of notebooks and desktops over a rolling 12-month cycle
Let us look at the monthly energy consumption over a 12-month rolling period.
Figure 7.6 illustrates the energy consumption of the computer estate monthly broken down by notebook and desktop. The line in the graph is the accumulated energy consumption in a rolling 12-month period. The y axis label on the left-hand side is denoted in kWh, and the y axis on the right is denoted in megawatt hours (MWh). Also, 1,000 kWh represents 1 MWh. The graphs’ bars correspond to the y axis on the left in kWh, and the line corresponds to the y axis on the right:
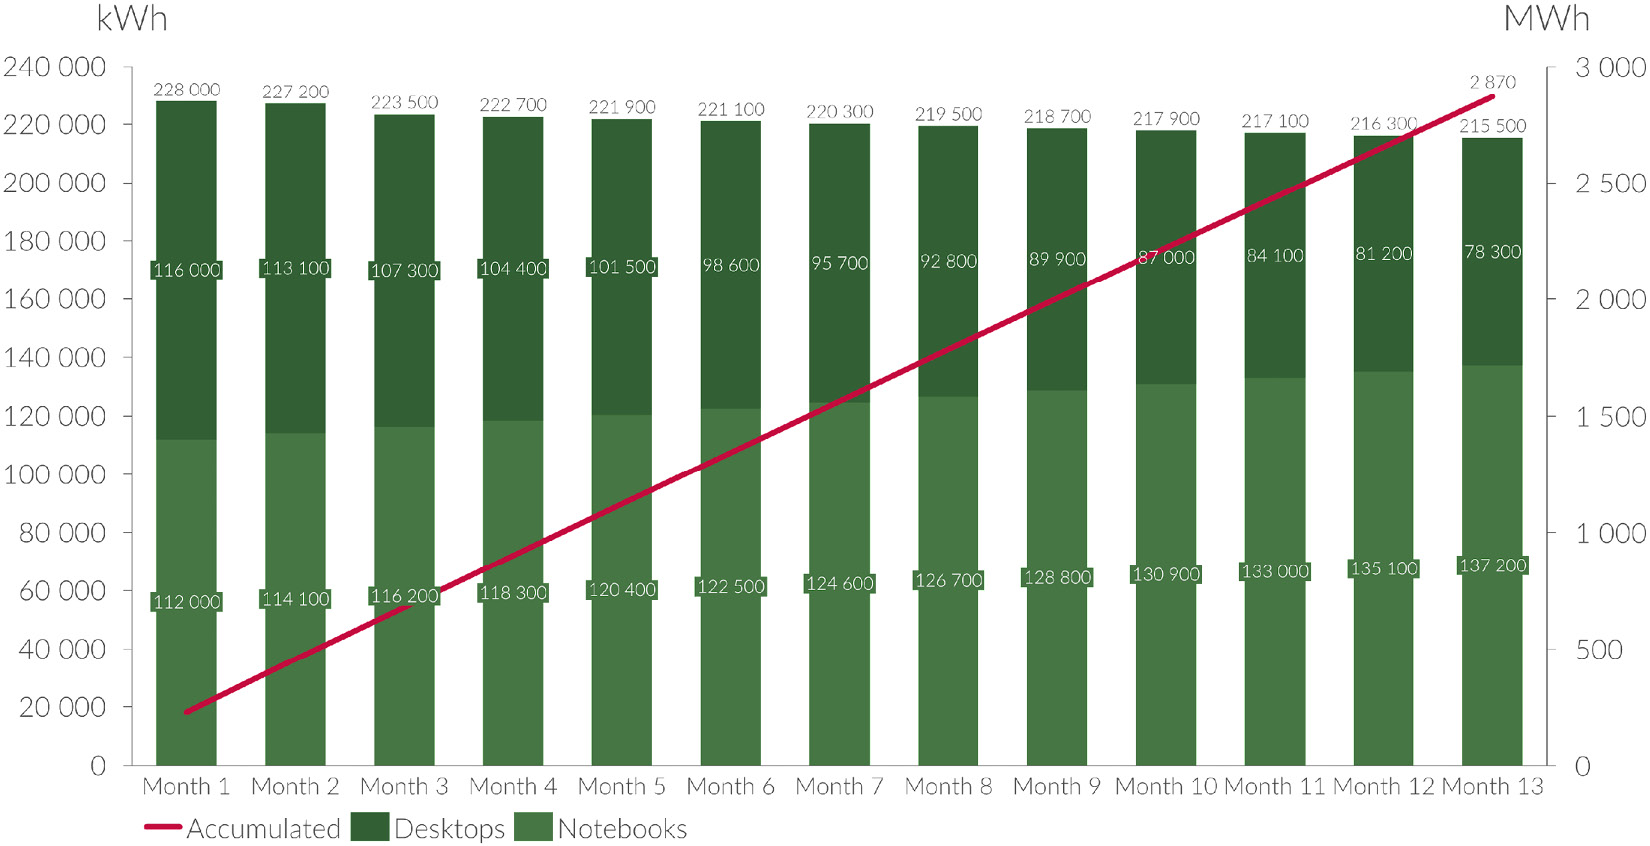
Figure 7.6 – Energy consumption over a rolling 12-month cycle
At the start of month 1, we see that although there are four times as many desktops as notebooks, the energy consumption is 112,000 kWh (112 MWh) for desktops and 116,000 kWh (116 MWh) for notebooks. As the distribution of desktops decreases på 50 every month and the number of notebooks increases by 150 per month, the energy consumption of desktops starts to decrease and increase for the notebooks. By month 13, the total energy consumption is, in fact, 12,500 (12.5 MWh) lower than it was at the start of month 1. Over a rolling 12-month period, we have consumed 2,870,000 kWh or 2,870 MWh, which the line in the graph illustrates. An average US home consumes roughly 11,880 kWh of electricity per year. This means that our yearly energy consumption for our computers amounts to roughly the equivalent of the electricity consumption of 242 US homes.
Now, let us look at the carbon dioxide emission rolling for 12 months, as illustrated in Figure 7.7. As we did previously, we use the global average carbon intensity of 0.000475 MtCO2/kWh and multiply it with our energy consumption in kWh. We see that in month 1, our total emissions are 108 MtCO2 emission, and due to lowering our energy consumption, it has been reduced to 102 MtCO2 emission, a decrease of roughly 5.5%. The accumulated carbon emissions amount to 1,363 MtCO2:
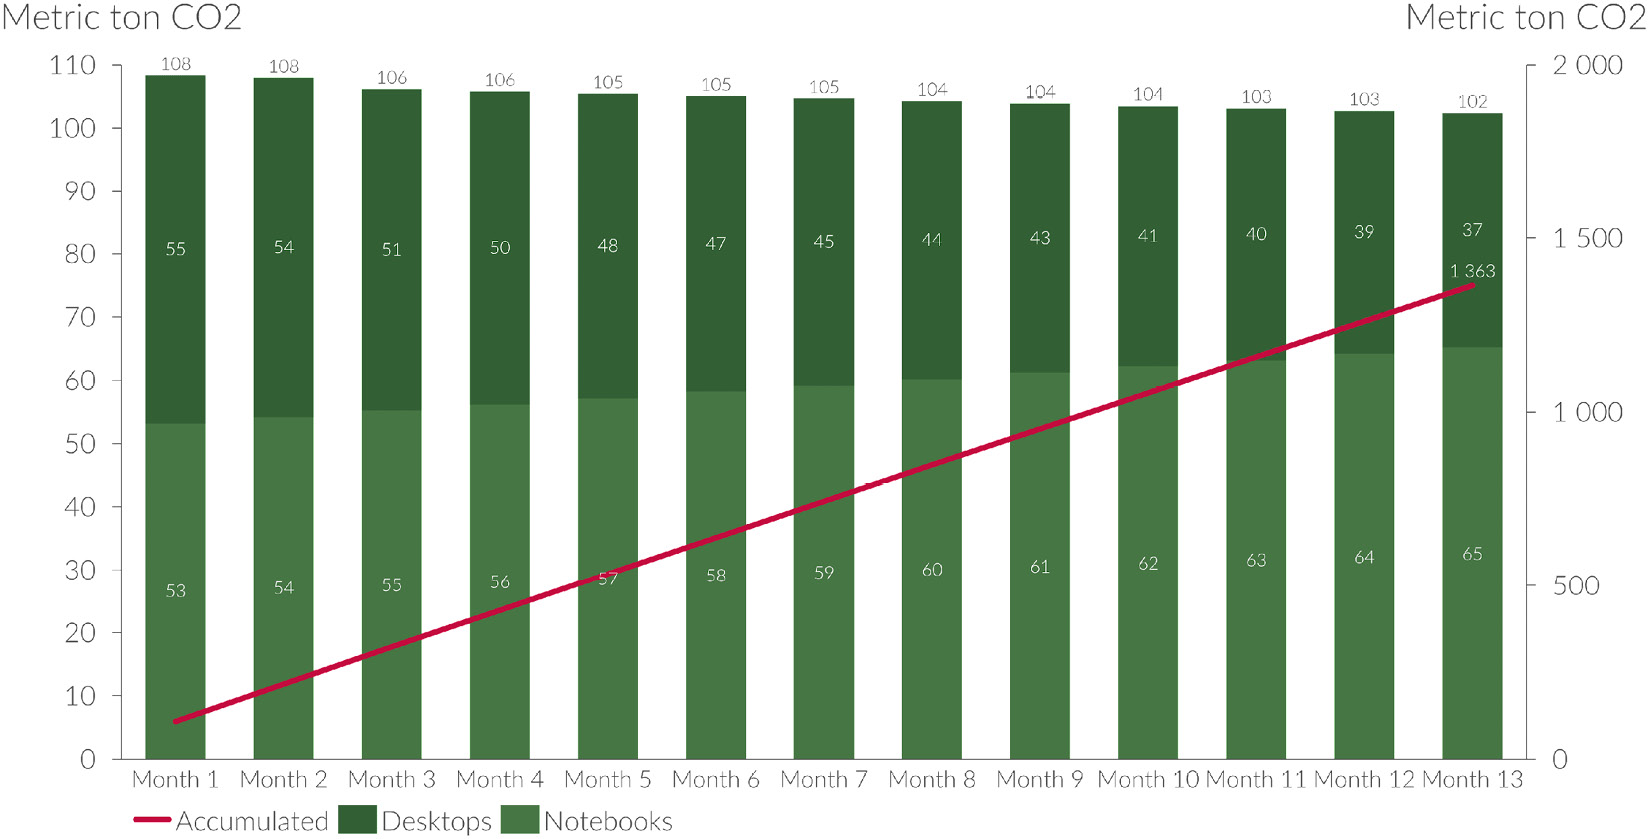
Figure 7.7 – Carbon dioxide emission 12-month rolling cycle
This is the equivalent of 294 gasoline-powered passenger vehicles driven for one year, ~600,000 liters of diesel consumed, or 3,156 barrels of oil consumed.
Now that we looked at a model company with roughly 10,000 computers, we see that the impact on energy consumption and carbon dioxide emissions is not insignificant, and this is only one company. Considering that in 2021, according to the International Telecommunications Union (ITU) (ITU 2021), there were approximately 2.7 billion computers and 4.9 billion internet users worldwide, energy consumption is starting to become a significant portion of our total energy consumption. Let us calculate the yearly energy consumption for the world’s 2.7 billion computers with the assumption that an average computer draws 100 watts per hour. For the following calculation, we assume, just like the preceding examples, that the computers are powered for 8 hours per day and 275 days/year:
|
Number of computers |
2,700,000,000 (2.7 billion) |
|
Average capacity of computer |
100 watts |
|
Hours/day |
8 hours/day |
|
Days/year |
275 days/year |
Yearly energy consumption calculation of the world’s computers:
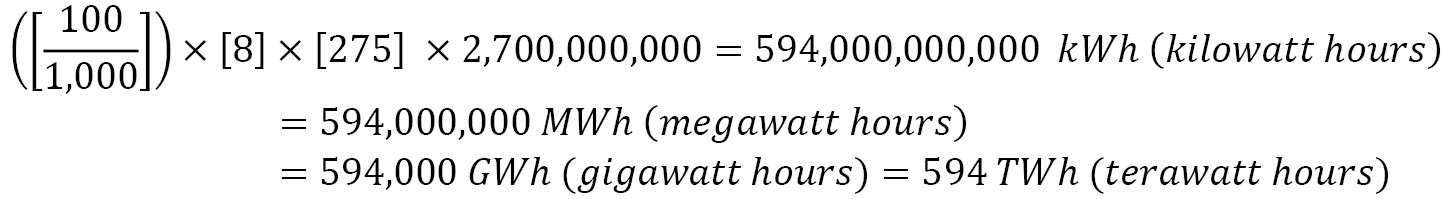
Note
594 TWh is the equivalent of 282 million tons of carbon dioxide.
As illustrated in Figure 7.8, 594 TWh is the equivalent of energy demand for 32.4 million US homes, roughly one-quarter of the United States’ 122.35 million households (United States Census Bureau 2021):
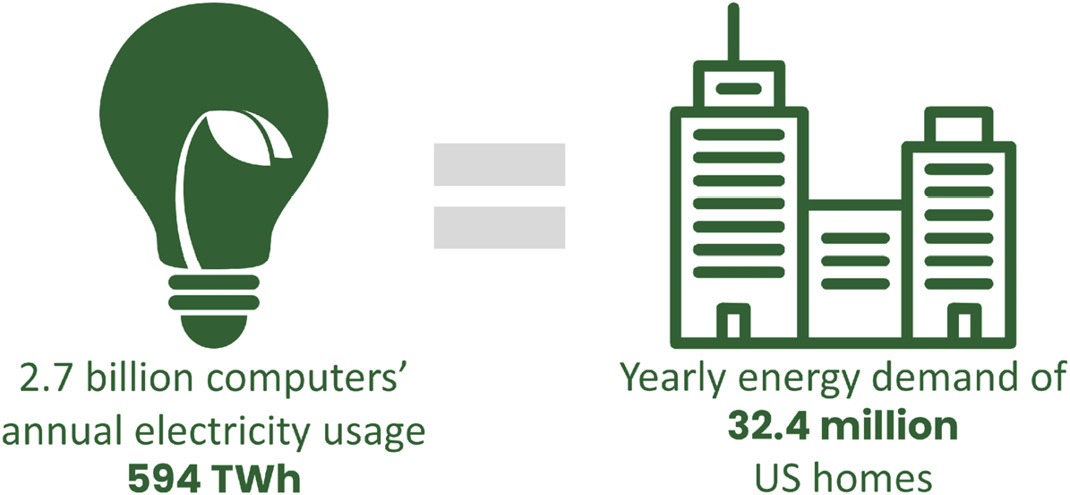
Figure 7.8 – Global energy consumption of the world’s computers equals hourly energy demand
In Chapter 4, Data Center and Cloud, we looked at how you could optimize resource efficiency, including energy. When you put this figure of 594 TWh in contrast to the number of US homes, you realize the sheer magnitude of energy required to power our global end user equipment estate. If we also compare the 594 TWh as a percentage of yearly worldwide energy consumption, which was 25,000 TWh in 2020, it accumulates to roughly 2.4%:
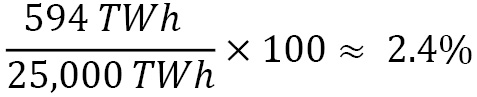
Now, let us look at how we can make a step-change to energy resource efficiency from our end user equipment.
Step-change to energy resource efficiency
As we highlighted previously, the greenest and cheapest energy is the energy we do not use. The best way to reduce energy consumption is to do much more with less. Reducing energy consumption will save you money and reduce greenhouse gas emissions. This section will look at ways to become more energy resource efficient. As we saw in the previous section, an estate of 10,000 computers consumes almost 3,000,000 (kWh) or 3,000 (MWh) per year. With an average price of 0.11 USD per kWh in the commercial sector in the United States (EIA 2022), this annual cost is 330,000 USD. With the recent price fluctuations in energy prices due to the global geopolitical situation, we will most likely see higher energy prices going forward. Hence it makes sense both from a cost and an environmental perspective to become more energy resource efficient. Therefore, choosing equipment that is far more resource-efficient can have a significant impact on your bottom line.
Buy resource-efficient hardware
In all our processes, we should go in with the mindset to do more with less. To ensure that our IT equipment runs, we should aim to procure energy-certified products from Energy Star or the EU Energy Efficiency Rating. The EU Energy Efficiency Rating has a scale from A (most efficient) to G (least efficient), which is easily recognized, as illustrated in Figure 7.9:
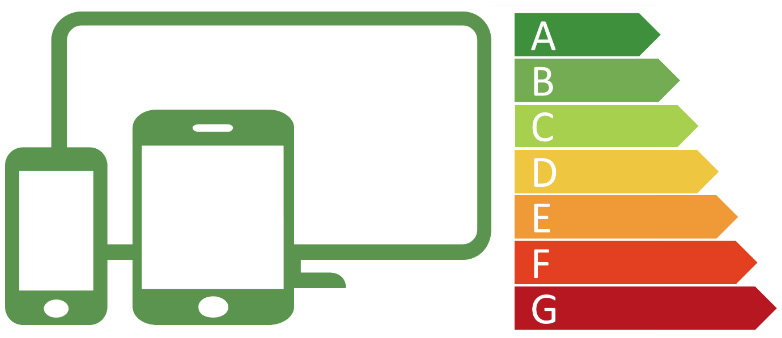
Figure 7.9 – Example of energy rating label
Before buying any hardware, check for an Energy Star or Energy Efficiency Rating. Buying energy-efficient IT equipment will significantly impact your energy consumption, especially if you manage a large estate.
Leverage low-carbon source
As we have seen before, leveraging renewable energy sources such as wind, solar, and hydro, and low-carbon energy sources such as nuclear power can significantly reduce greenhouse gas emissions. You should investigate what energy sources your offices are powered with and whether they run on clean energy. Suppose your office locations run on non-clean energy sources such as fossil fuel. In that case, you should investigate what alternatives you must switch to renewable energy or low-carbon energy sources. You may also recommend that your employees switch to renewable energy sources at home and offer a reimbursement scheme if there is a gap in cost to switch to renewable energy.
As we saw previously in the chapter, the global average is that renewable energy makes up 28% of the total energy mix. If low carbon energy sources such as nuclear are accounted for, the total number goes up to roughly 39%. Although it might not be entirely possible to switch to renewable or low carbon energy sources in all corners of the world, it should be investigated if it is possible to make a switch.
Take advantage of system power management settings
While using your computers, you should aim to reduce energy usage by changing the power mode setting on your computer. Most hardware today comes with a different type of auto-off functionality. Table 7.3 illustrates the energy consumption difference between devices turned on or in sleep mode:
|
ICT device |
Turned on kWh/hour |
Sleep mode kWh/hour |
|
Notebook |
0.02 |
0.001 |
|
Desktop |
0.07 |
0.003 |
Table 7.3 – IT hardware comparison between turned on and sleep mode
By enabling sleep mode after a period of inactivity, your ICT device will only draw a fraction of energy as opposed to being fully turned on.
Settings can be pushed out through a corporate endpoint manager by updating the group policy, or the settings can be updated on each device.
The general recommendation is as follows:
- Turn off the monitor after 5-10 minutes of inactivity
- Turn on the computer's sleep mode after 15-30 minutes of activity
To reach the power management settings on these operating systems, follow these instructions:
To update power management settings on Windows 10:
Start Menu | Control Panel | System | Power & sleep
To update power management settings on Windows 11:
Start Menu | Settings | Power & battery
To update power management on a group of Windows 10 and Windows 11:
Computer Configuration | Administrative templates |System | Power Management or search for gpedit
To update power management settings on macOS:
Apple Menu -> System Preferences -> Energy Saver
In the following sections, we will look at how you can configure individual power and sleep settings on Windows 10, 11, and macOS and apply group settings for a whole farm of computers using Windows Group Policy power consumption.
Windows 10
In Windows 10, in the Power & sleep settings, you have two main options to control when the screen should be turned off and when the computer should go into sleep mode. The dialog box, as illustrated in Figure 7.10, may look slightly different depending on whether you use a desktop or a notebook. In this case, we have used a notebook that can be powered with either battery or by being plugged in. Therefore, you have two alternatives per category to set the threshold when the monitor should be turned off and when the computer should go into sleep mode:

Figure 7.10 – Windows 10 power management settings
There is also another way to update these settings that can be reached from Power Options in Control Panel, as illustrated in Figure 7.11. This also enables you to create different power plans to balance performance with energy consumption on the underlying hardware:
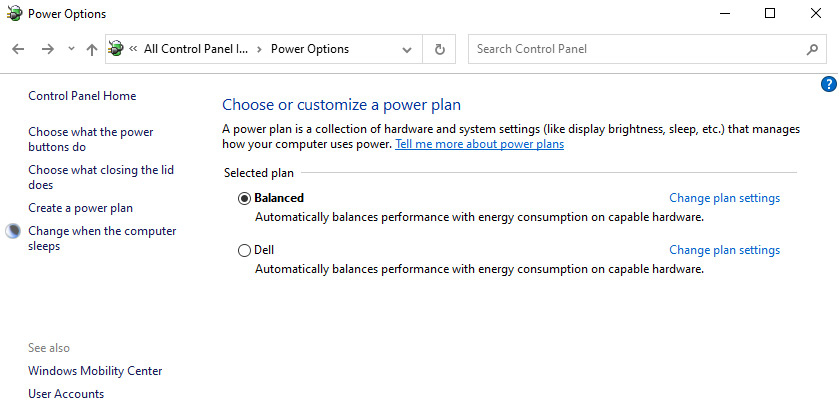
Figure 7.11 – Windows 10 Power Options settings
It gives the same options as in the Power & sleep dialog box but has advanced feature settings, as illustrated in Figure 7.12. Depending on your underlying hardware, your advanced settings will be different:
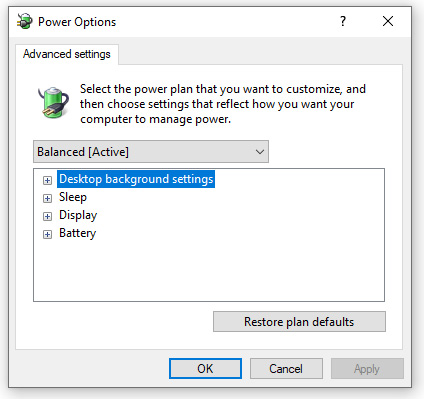
Figure 7.12 – Windows 10 Advanced power settings
Let us now see how to apply the same setting in Windows 11.
Windows 11
Microsoft has always given Windows users the ability to control how their device (computer) consumes power; this is something that continues with Windows 11.
End users can adjust various power settings to make the most out of every bit of energy.
To keep the cost and usage of electricity low and have better battery life, Microsoft has built many features in Windows 11 to help manage power features so that this can optimize energy consumption.
For example, you can configure when you want the screen to auto power off or the computer to go into sleep mode.
The following sections will walk you through different options to manage the system power options.
How to change the screen time setting
To change when the display should turn off automatically, follow these steps:
- Open Settings.
- Click on System.
- Click on Power & battery as shown here:
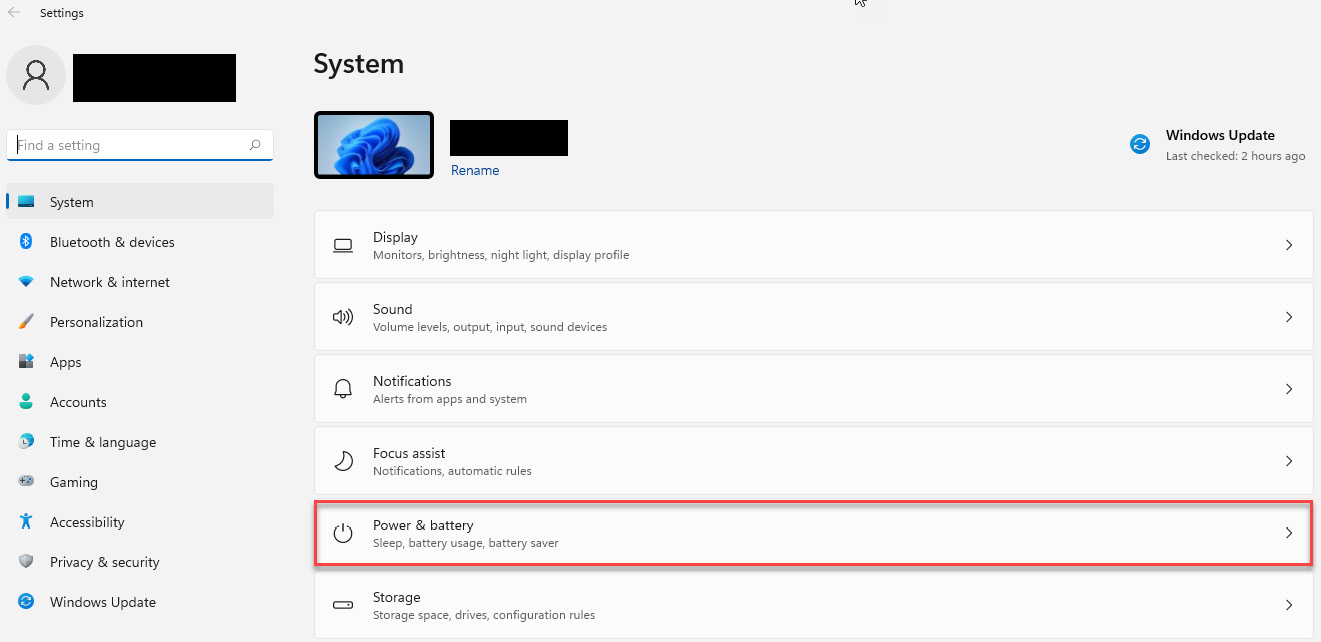
Figure 7.13 – Windows 11 system settings
- Under Power, click on Screen and sleep.
- The following setting must be changed when running on the battery: On battery power, turn off my screen after:
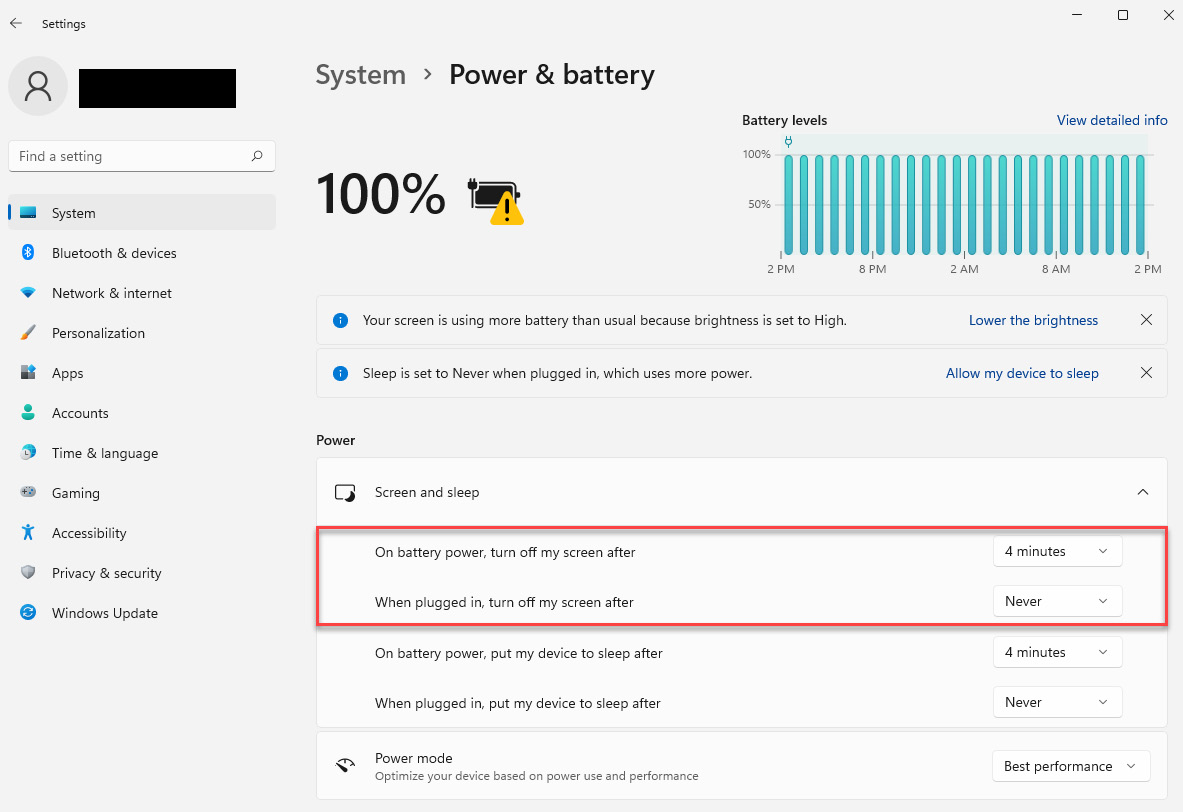
Figure 7.14 – Windows 11 Power & battery settings – changing the screen time setting
- Use When plugged in, turn off my screen after to decide when the display should turn off when plugged into a power socket.
Once these steps are complete, the display will automatically turn off after the duration of inactivity that has been specified.
How to change the sleep mode setting
To change when the computer should enter sleep mode automatically, use these steps:
- Open Settings.
- Click on System.
- Click on Power & battery.
- Under Power, click on Screen and sleep.
- The following setting must be changed when running on the battery: On battery power, put my device to sleep after:
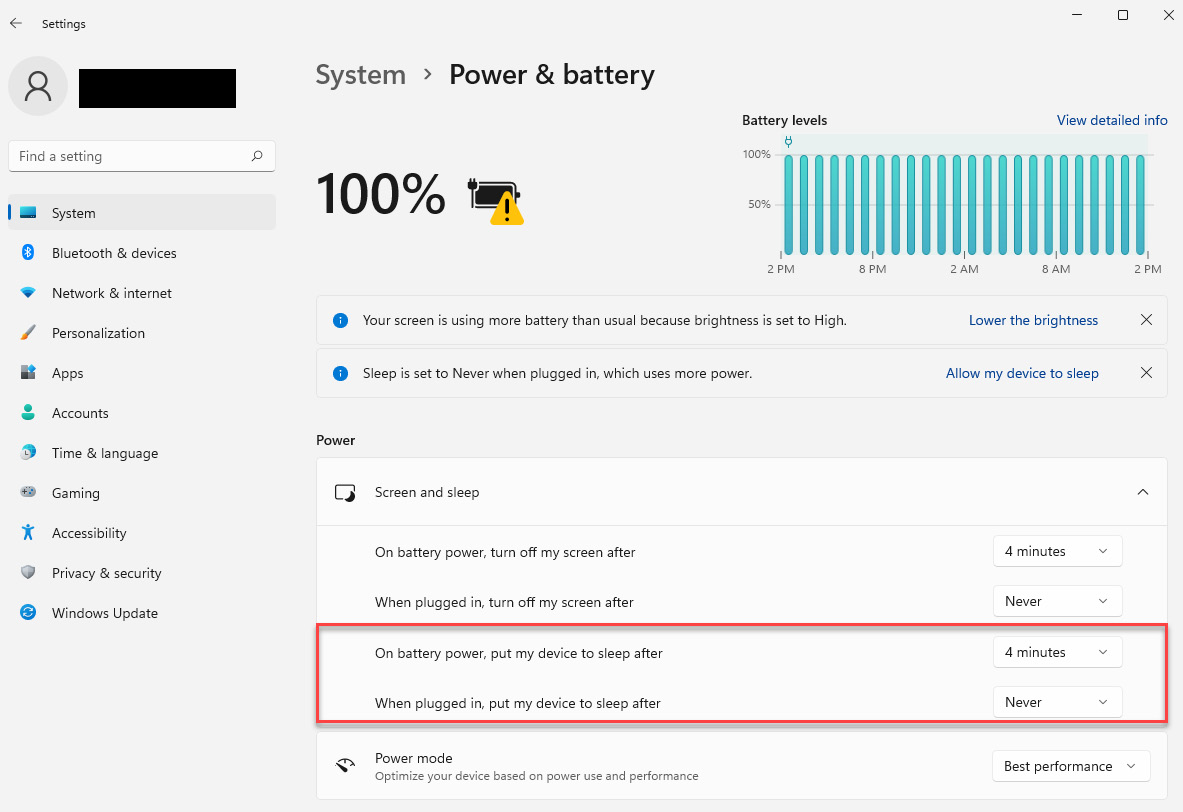
Figure 7.15 – Windows 11 Power & battery settings – changing the sleep mode setting
- Use When plugged in, put my device to sleep after to decide when the display should turn off when plugged into a power socket.
Once these steps are complete, the display will automatically turn off after the duration of inactivity that has been specified.
How to change power modes
The following will guide you in making changes to the default power mode:
- Open Settings.
- Click on System.
- Click on Power & battery.
- Open the drop-down menu under the Power mode setting and select the option that best suits your situation:
- Best power efficiency: Preserves the most energy, lowering system performance. This option will offer the most battery life if you use a notebook.
- Balanced: Windows 11 automatically balances energy and performance for an optimal experience.
- Best performance: Uses the most energy, increasing system performance.
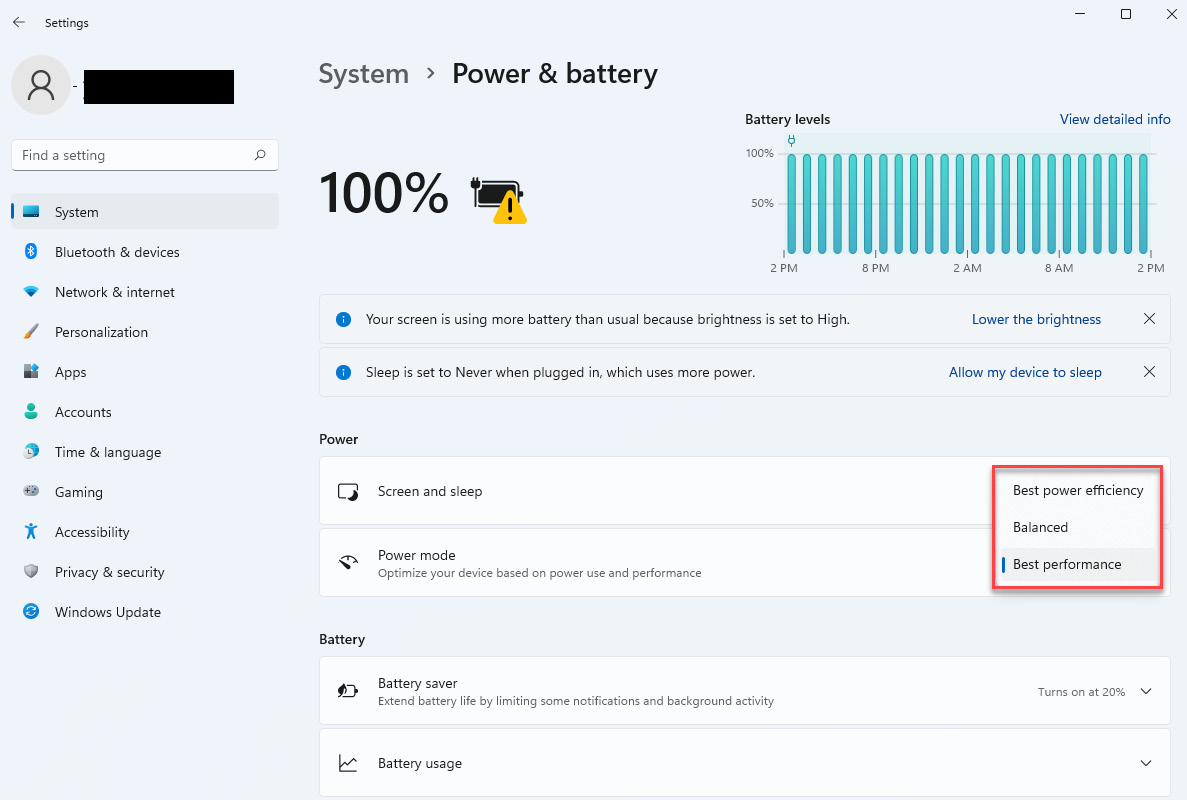
Figure 7.16 – Windows 11 Power & battery settings – changing power modes
Once you select your option, the new power mode will apply to the device.
How to enable the battery saver
On notebooks, an option can be enabled so that the battery saver feature is set manually or automatically.
Turn on battery saver mode manually:
- Open Settings.
- Click on System.
- Click on Power & battery.
- Click on the Battery saver dropdown in the Battery section.
- Click on Turn on now for the Battery saver setting:
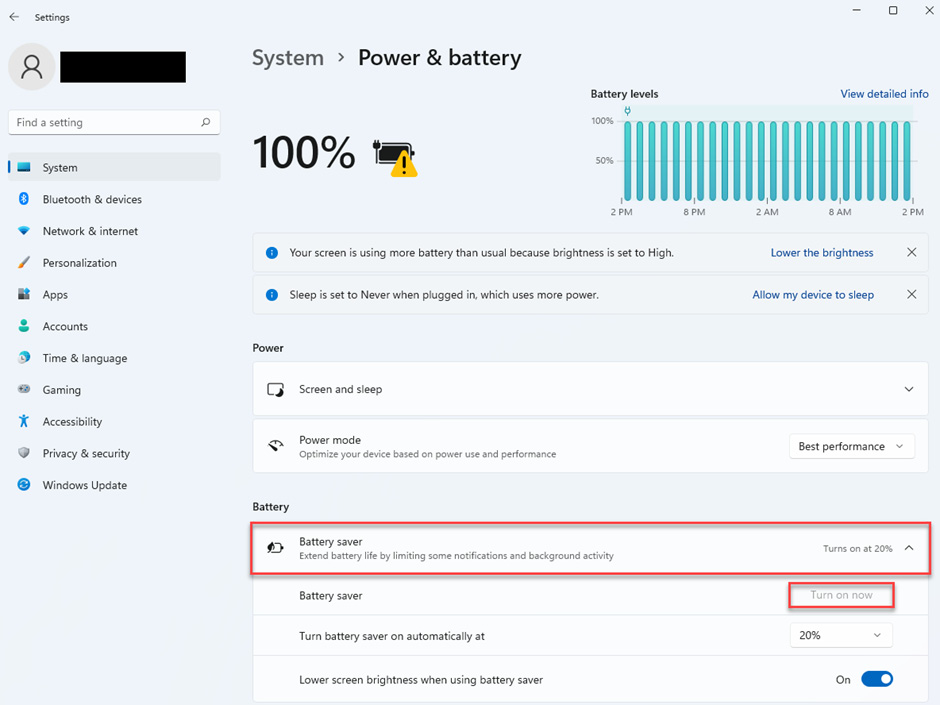
Figure 7.17 – Windows 11 Power & battery settings – enabling battery saver manually
After you complete the steps, the battery saver mode will immediately be enabled.
Turn on battery saver mode automatically
- Open Settings.
- Click on System.
- Click on Power & battery.
- Click on the Battery saver dropdown in the Battery section.
- Use the Turn battery saver on automatically at setting to decide what remaining capacity you wish to have:
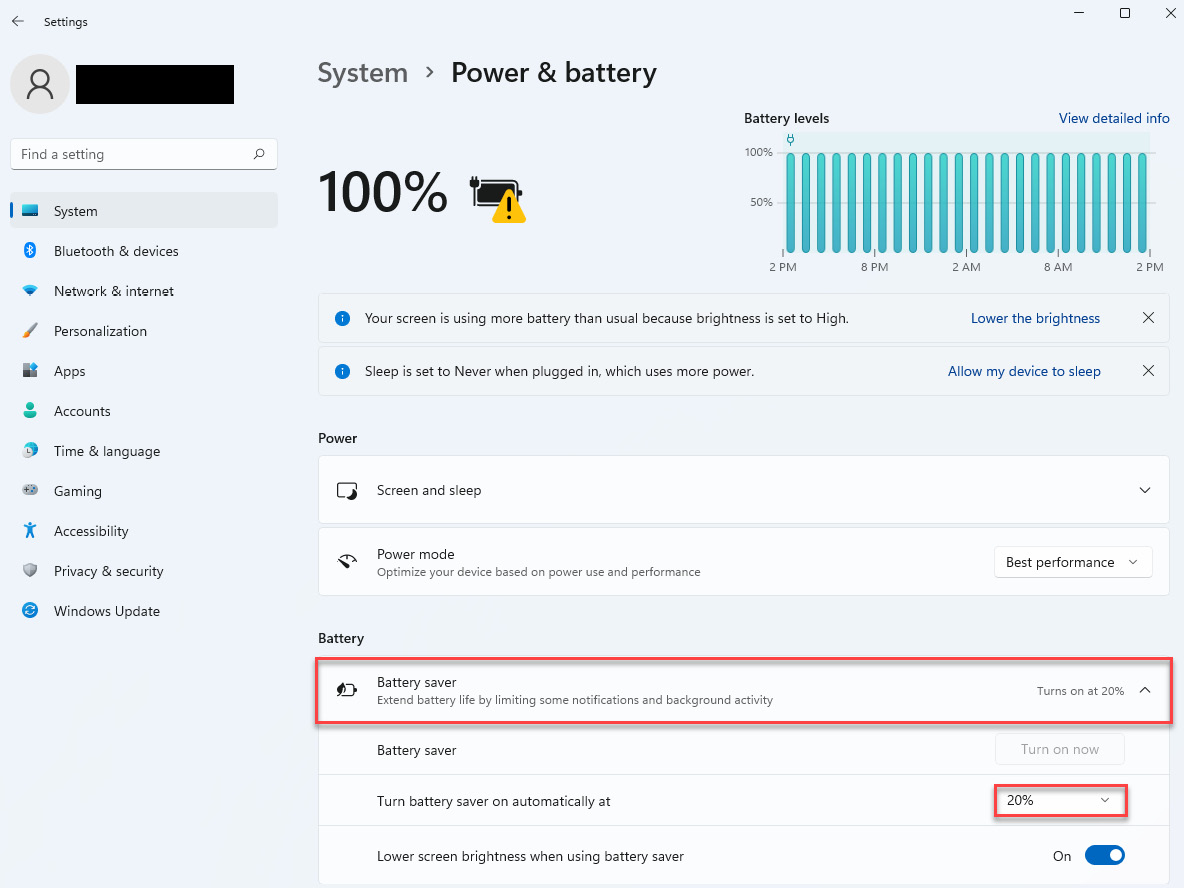
Figure 7.18 – Windows 11 Power & battery settings – enabling battery saver automatically
Once you complete the steps, the battery saver mode will turn on automatically when the battery drops below the specified percentage.
How to view battery usage on Windows 11
To view the battery usage history, follow these steps:
- Open Settings.
- Click on System.
- Click on Power & battery.
- In the Battery section, click on the Battery usage dropdown.
This view allows you to see the battery usage in the last 24 hours or 7 days. The 24 hours view shows usage per hour; the last 7-day view gives a daily overview:
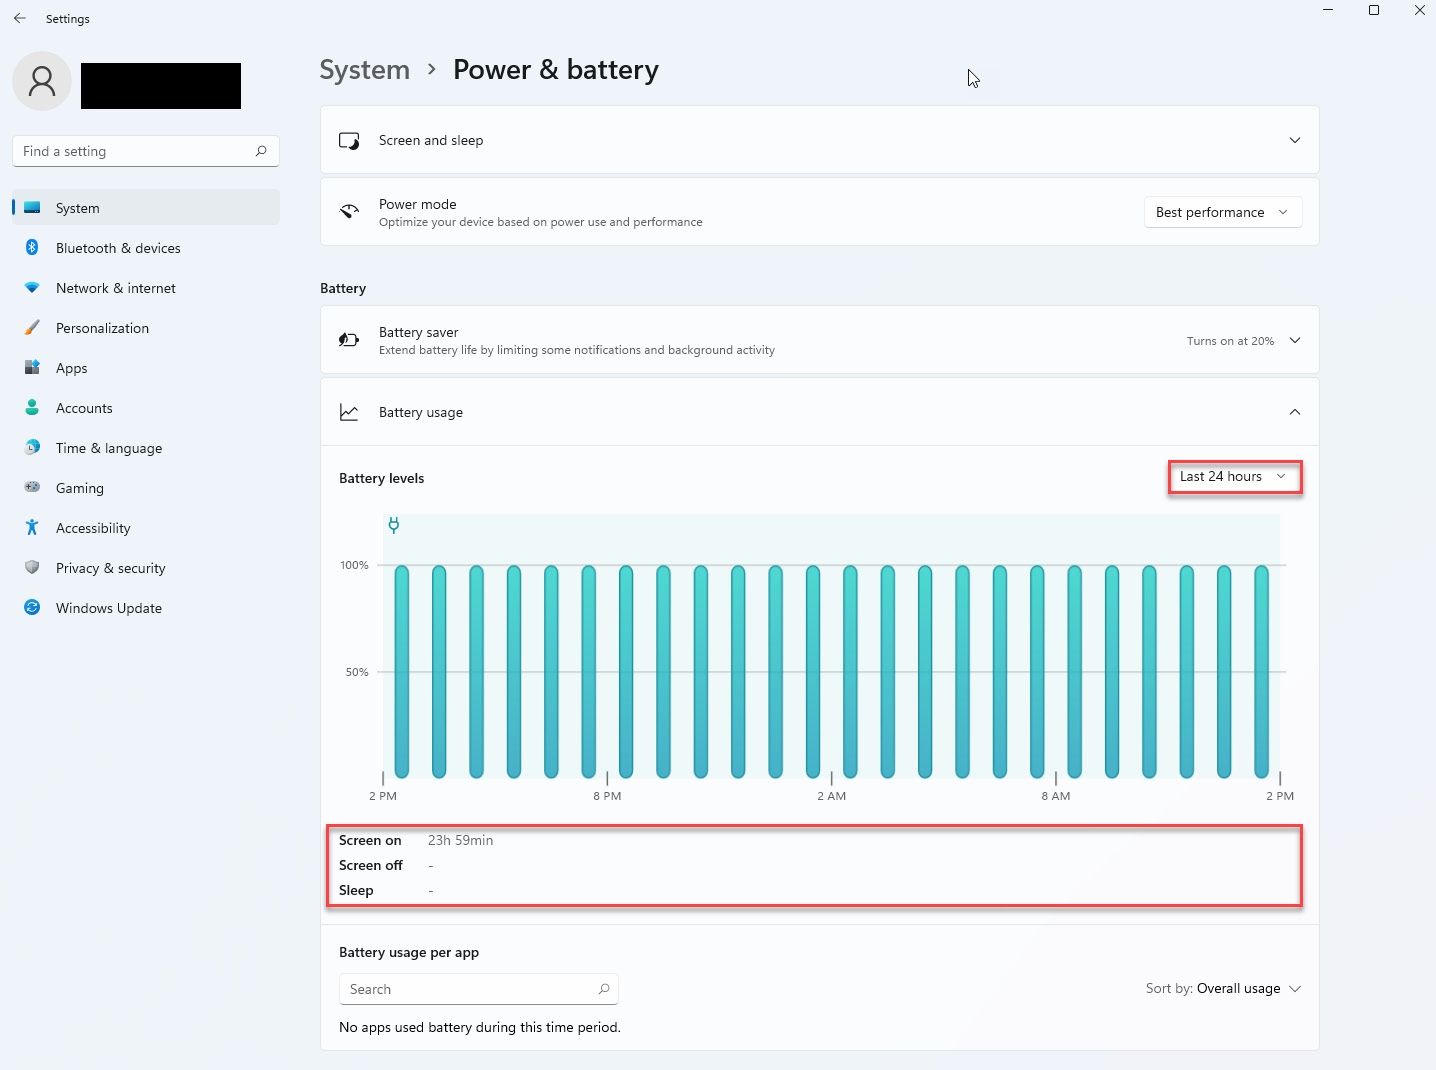
Figure 7.19 – Windows 11 Power & battery settings – battery usage
This feature also lets you view battery usage per application, giving you a good idea of how apps use the energy.
How to manage apps background activities
You may find that a particular app could consume a lot of battery; you can change its settings to prevent it from running in the background to preserve battery life:
- Open Settings.
- Click on System.
- Click on Power & battery.
- In the Battery usage section, select the app, click the menu (three-dots) button, and select the Manage background activity option.
Quick note:
Apps acquired from the Microsoft store allow you to change that particular app’s power setting.
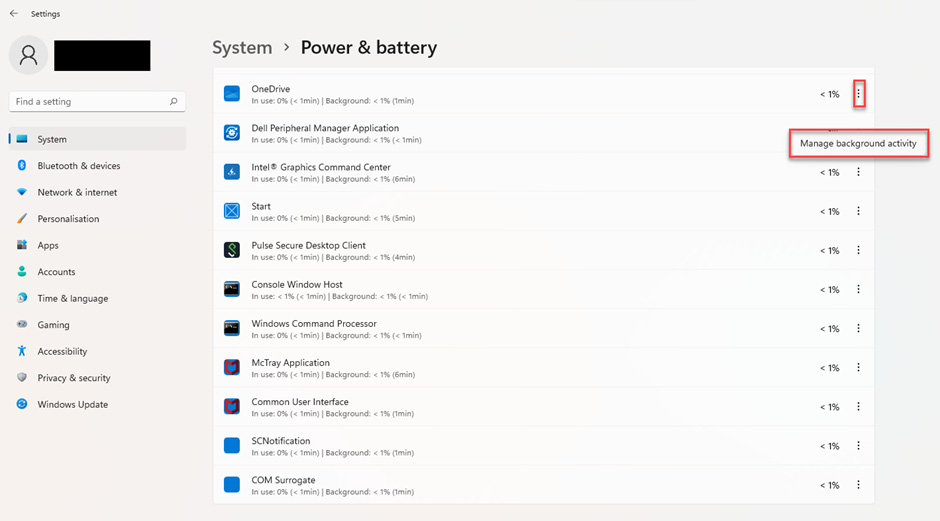
Figure 7.20 – Windows 11 Power & battery settings – managing apps background activities
- Under the Background apps permissions setting, you can choose how the app should run in the background:
- Always
- Power optimized (recommended)
- Never
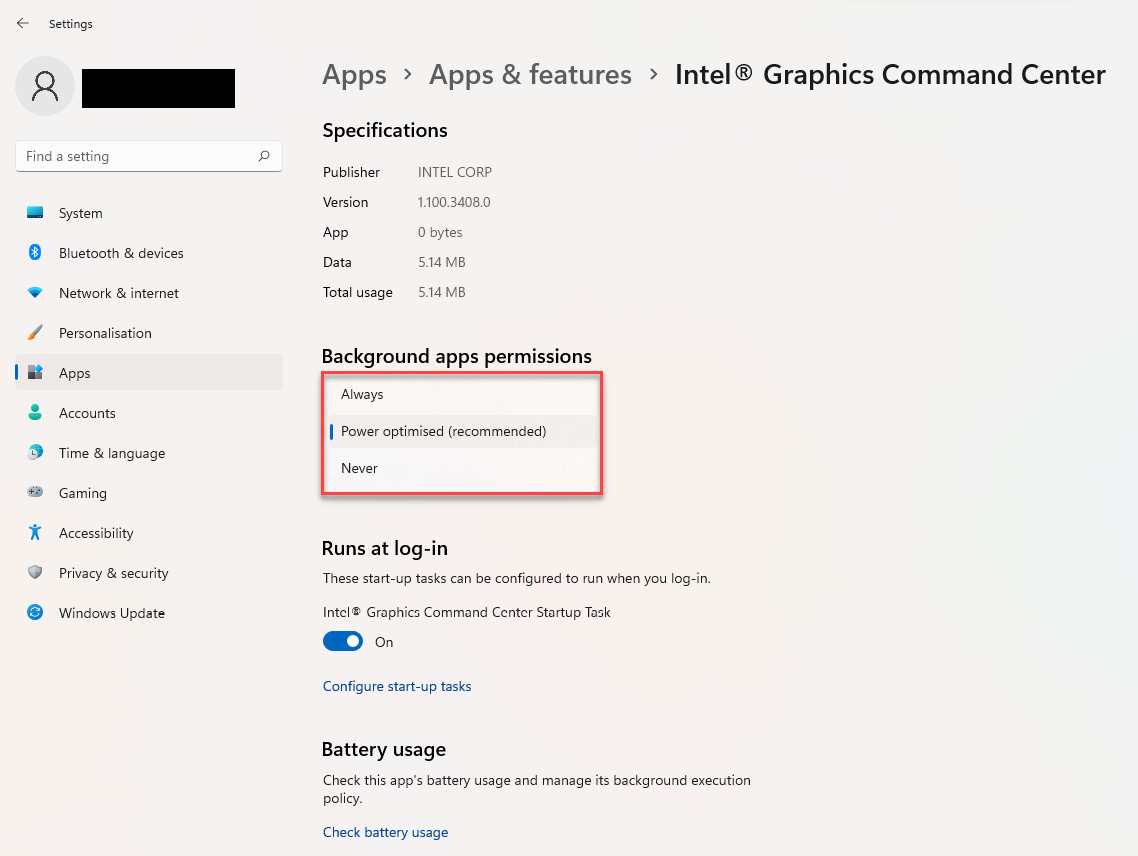
Figure 7.21 – Windows 11 Power & battery settings – managing background apps permissions
How to enable hibernation
Hibernation is a feature that can help preserve battery life when you are not using the device. This feature works by saving the data in memory onto the hard drive, allowing you to completely shut down and resume where you left off without wasting power.
Enable hibernation
To check and enable hibernation, follow these steps:
- Open Start.
- Search for Command Prompt, right-click, and select the Run as administrator option.
- Enter the following command to enable the Hibernate feature and press Enter: powercfg /hibernate on:
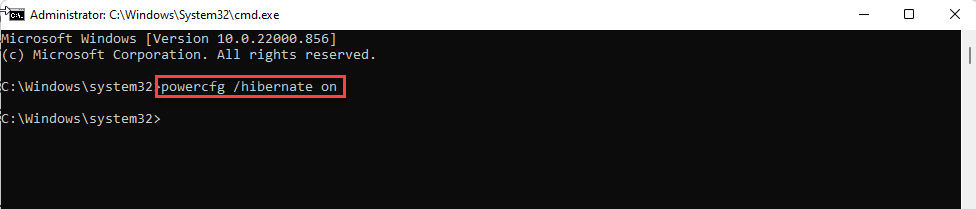
Figure 7.22 – Windows 11– Command Prompt – enabling hibernation
Add hibernation option to Start
To enable the Hibernate option in the Power menu, use these steps:
- Open Start.
- Search for Control Panel.
- Click on Hardware and Sound:
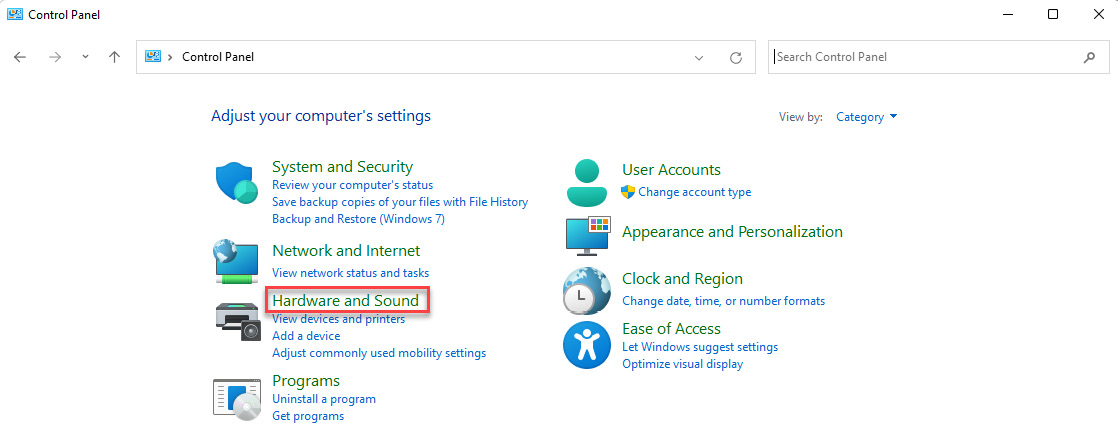
Figure 7.23 – Windows 11– Control Panel – Hardware and Sound
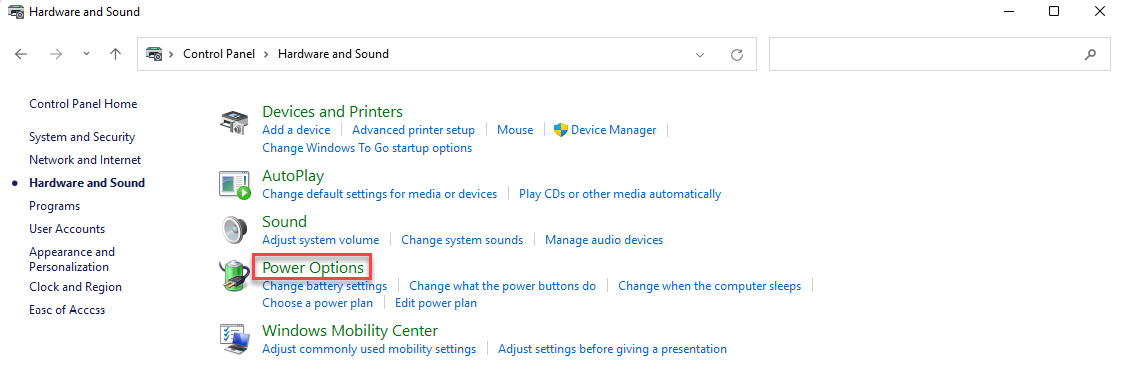
Figure 7.24 – Windows 11 – Control Panel – Hardware and Sound – Power Options
- Click the Choose what closing the lid does option from the left pane:
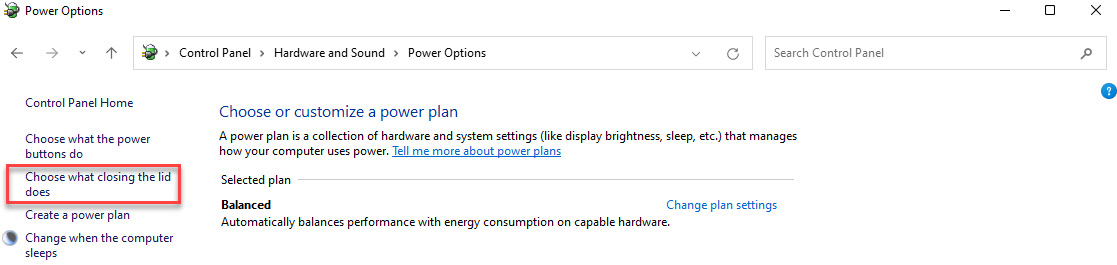
Figure 7.25 – Windows 11 – Control Panel – Hardware and Sound – Power Options – Choose what closing the lid does
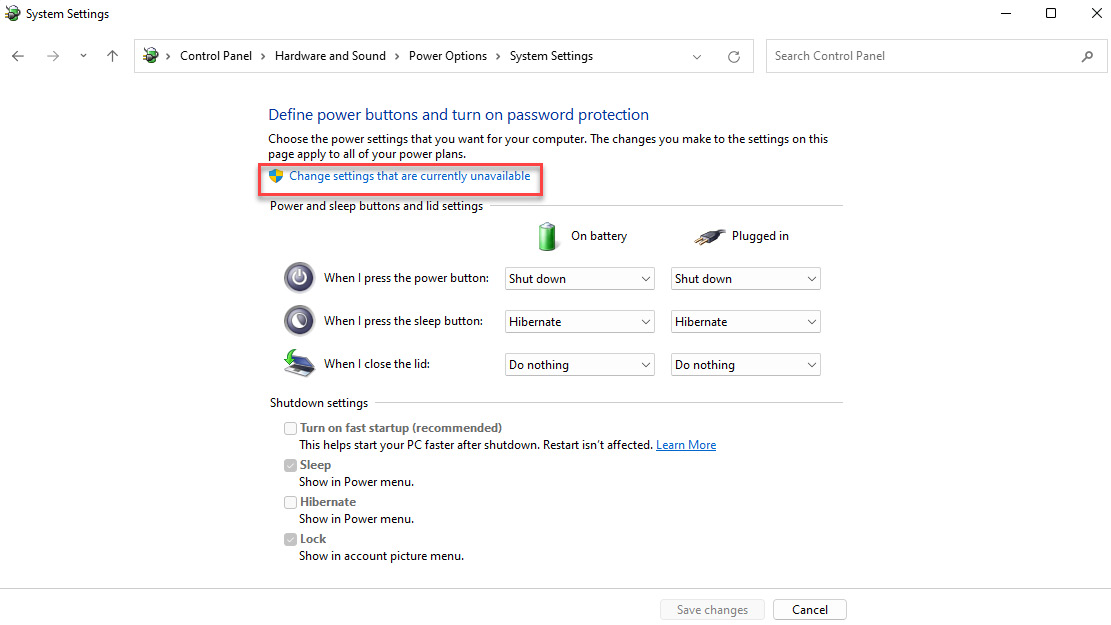
Figure 7.26 – Windows 11 – Control Panel – Hardware and Sound – Power Options – System Settings – Change settings that are currently unavailable
- Check the Hibernate option:
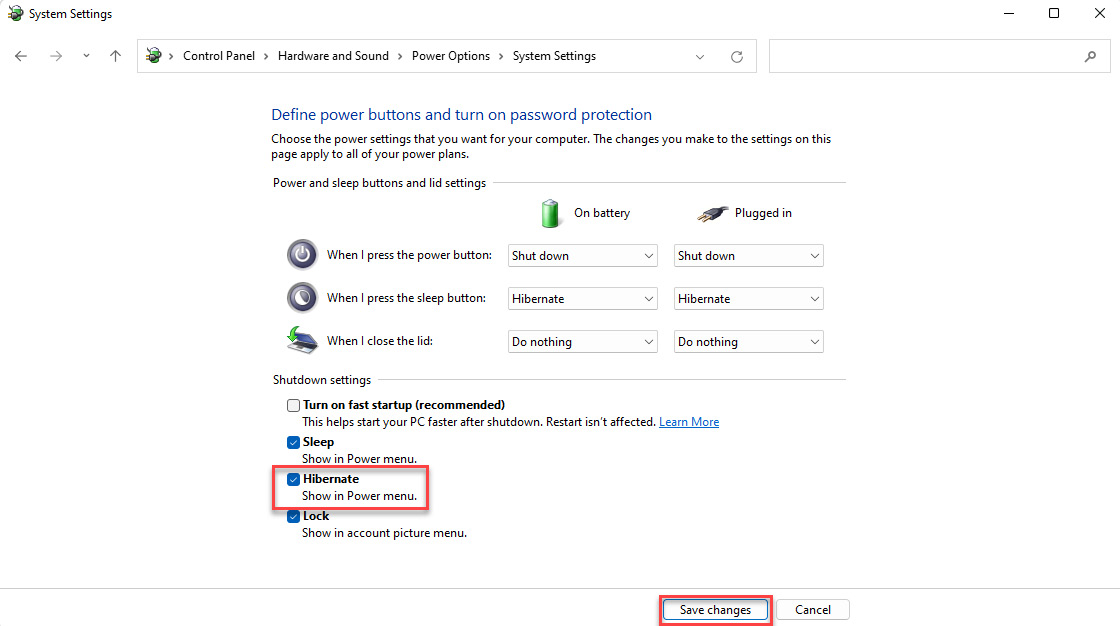
Figure 7.27 – Windows 11 – Control Panel – Hardware and Sound - Power Options – System Settings – Hibernate
- Click the Save changes button.
After you complete the steps, the Hibernate option will appear in the Start menu power options.
Let us now see how to apply the settings in macOS.
macOS
In macOS, the energy saver settings are available in system preferences, as illustrated in Figure 7.28. The energy saver gives you two alternatives to configure your settings for battery or when the computer is plugged into a power adapter:
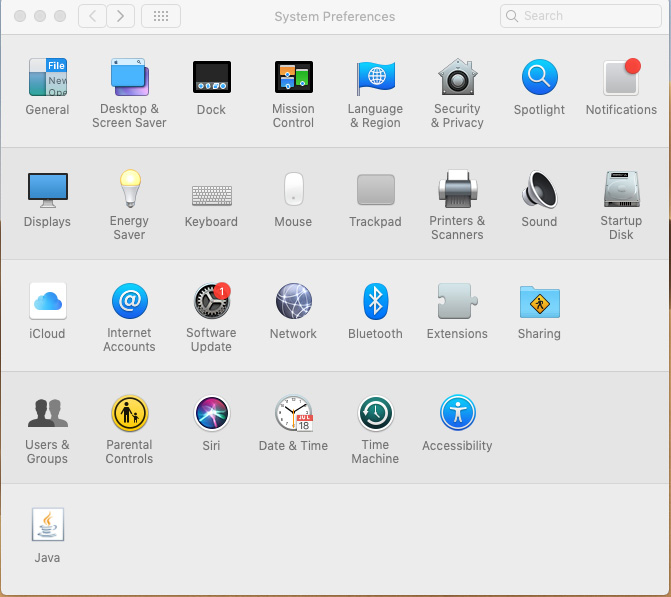
Figure 7.28 – macOS system preferences energy saver
While running on battery, the default settings from Apple suggest turning off the screen after two minutes and putting the hard disk into sleep mode when possible. While the computer is being run on battery, the recommendation is also to dim the display to preserve the battery:
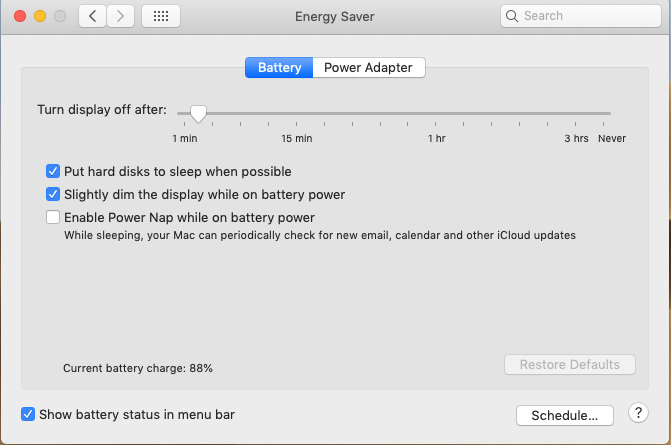
Figure 7.29 – macOS Energy Saver Battery
There is an option to prevent the computer from sleeping automatically when the display is off. While running on a power adapter, the default setting is to turn off the display after 10 minutes and put the hard disk into sleep mode when possible. Still, it is strongly advised against since it will continue to draw as much energy as if it were fully turned on and will inhibit you from preserving energy.
While plugged in and in sleep mode, the recommendation is to allow checking for periodic updates, enable backup, and check for email and calendar updates. If you frequently remotely connect to your computer, you can leave Wake for Wi-Fi network access checked so that your computer wakes up from sleep mode when a network connection is recognized:
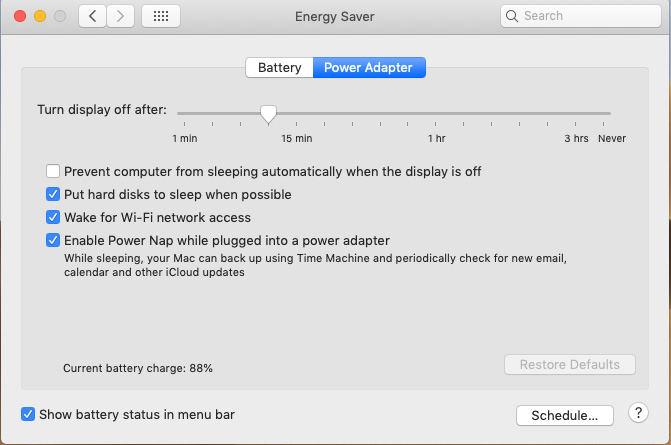
Figure 7.30 – macOS Energy Saver Power Adapter
In the next section, we will look at how you can apply group settings for a whole farm of computers using Windows group policy power consumption instead of applying them one by one.
Windows group policy power consumption
When managing a large set of computers within an enterprise, your best alternative is to enforce a group policy for power consumption. The power consumption properties are pushed out centrally to all clients. The next subsection is an example from Microsoft Group Policy Management to administer all the settings centrally and distribute the properties to all computers. Centrally managing the power consumption settings is a significant advantage for efficiency, consistency, and preserving energy from a corporate perspective. Still, it is also essential to make the group policies well known to the end users.
Configuring a power plan with Group Policy preferences
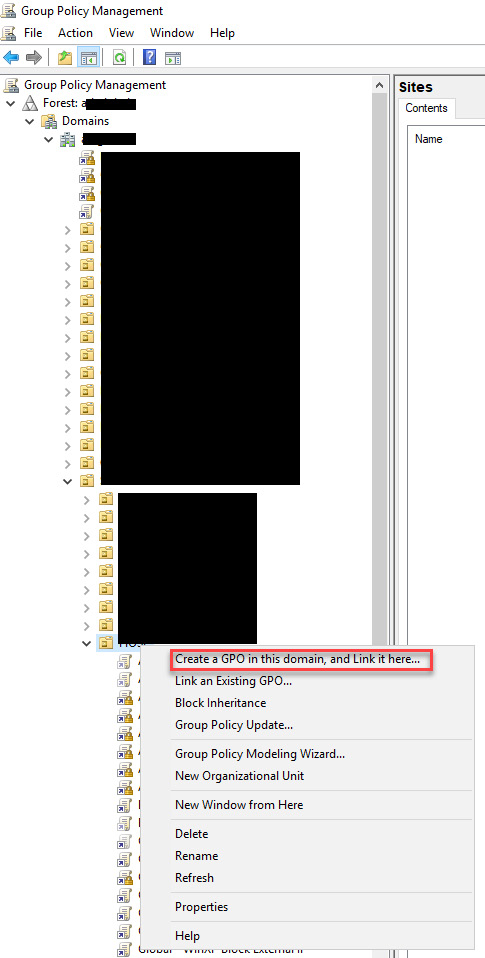
Figure 7.31 – Group Policy Management – Create a group policy object (GPO)
- Give the policy a name.
- Right-click on the policy and select Edit.
- In Group Policy Management Editor, expand Computer Configuration, expand Preferences, expand Control Panel Settings, and then click Power Options.
- Right-click on Power Options, hover over New, and then click Power Plan (At least Windows 7):
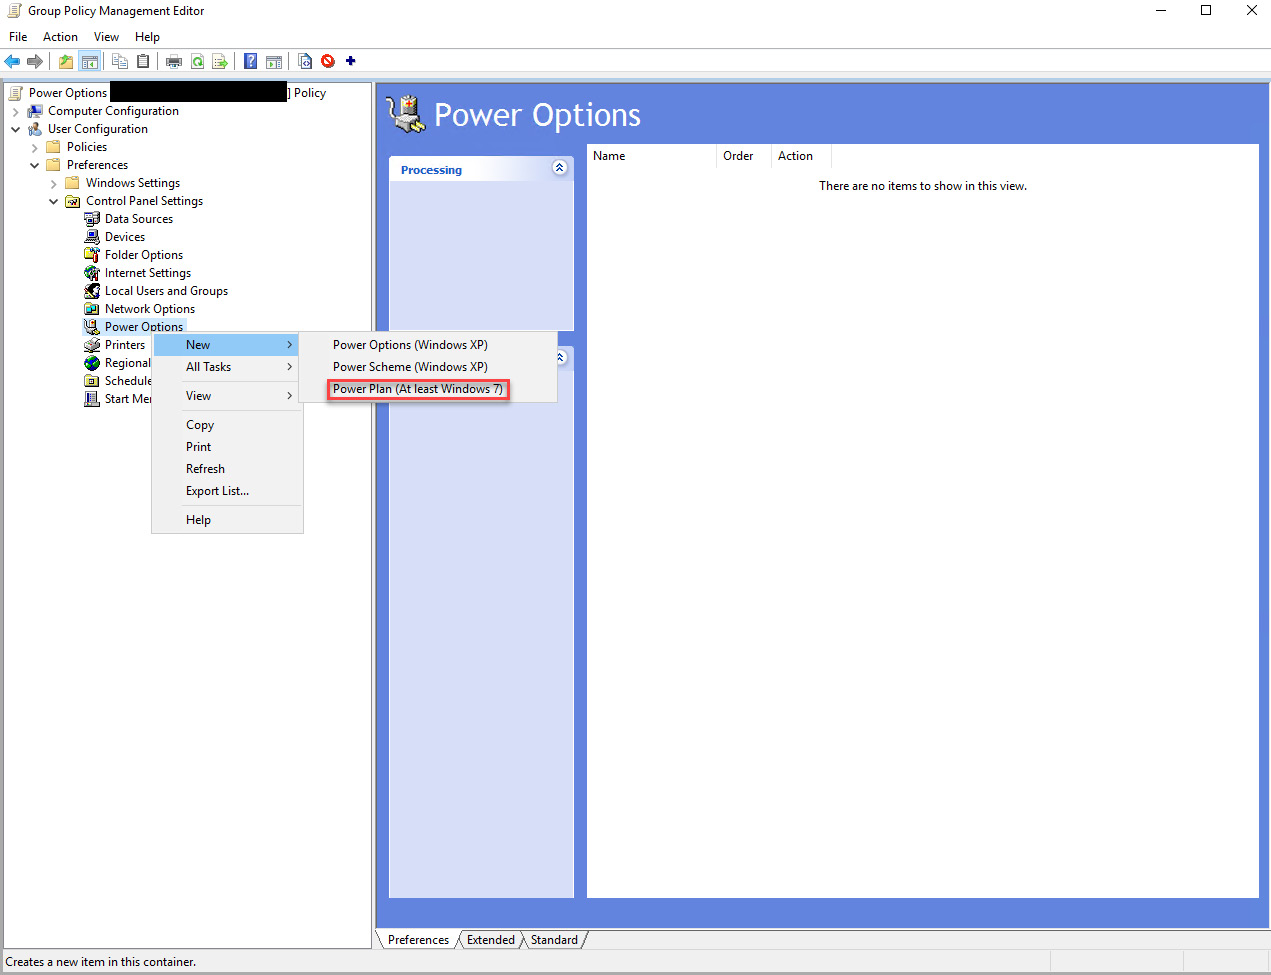
Figure 7.32 – Group Policy Management – Creating a power plan
- In the New Power Plan (At least Windows 7) Properties dialog box, click the Balanced drop-down list and then type Windows Power Plan. Then, select the Set as the active power plan checkbox:
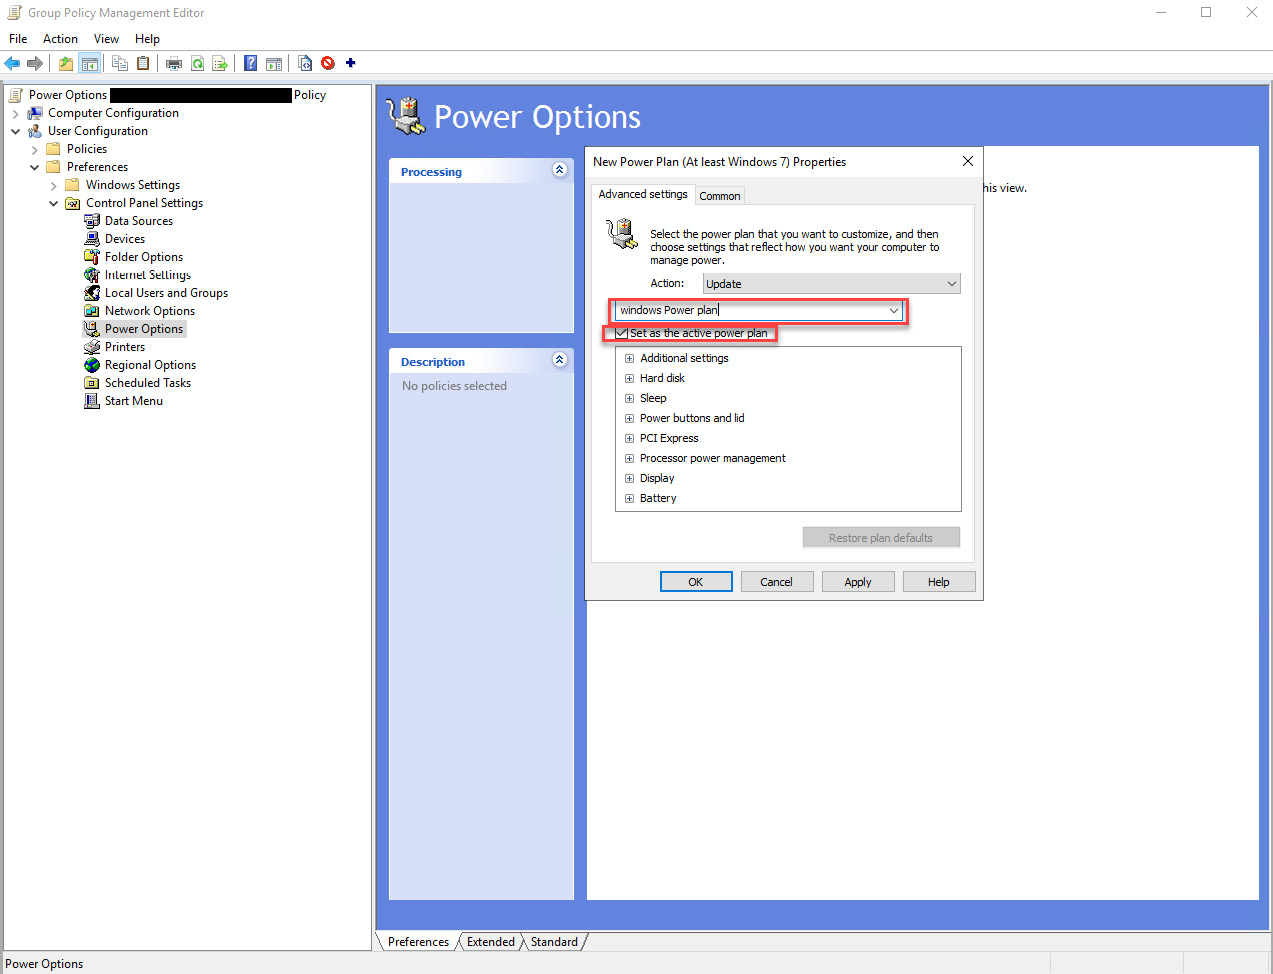
Figure 7.33 – Group Policy Management – Set as the active power plan
- Select the desired power options you wish to set on all devices:
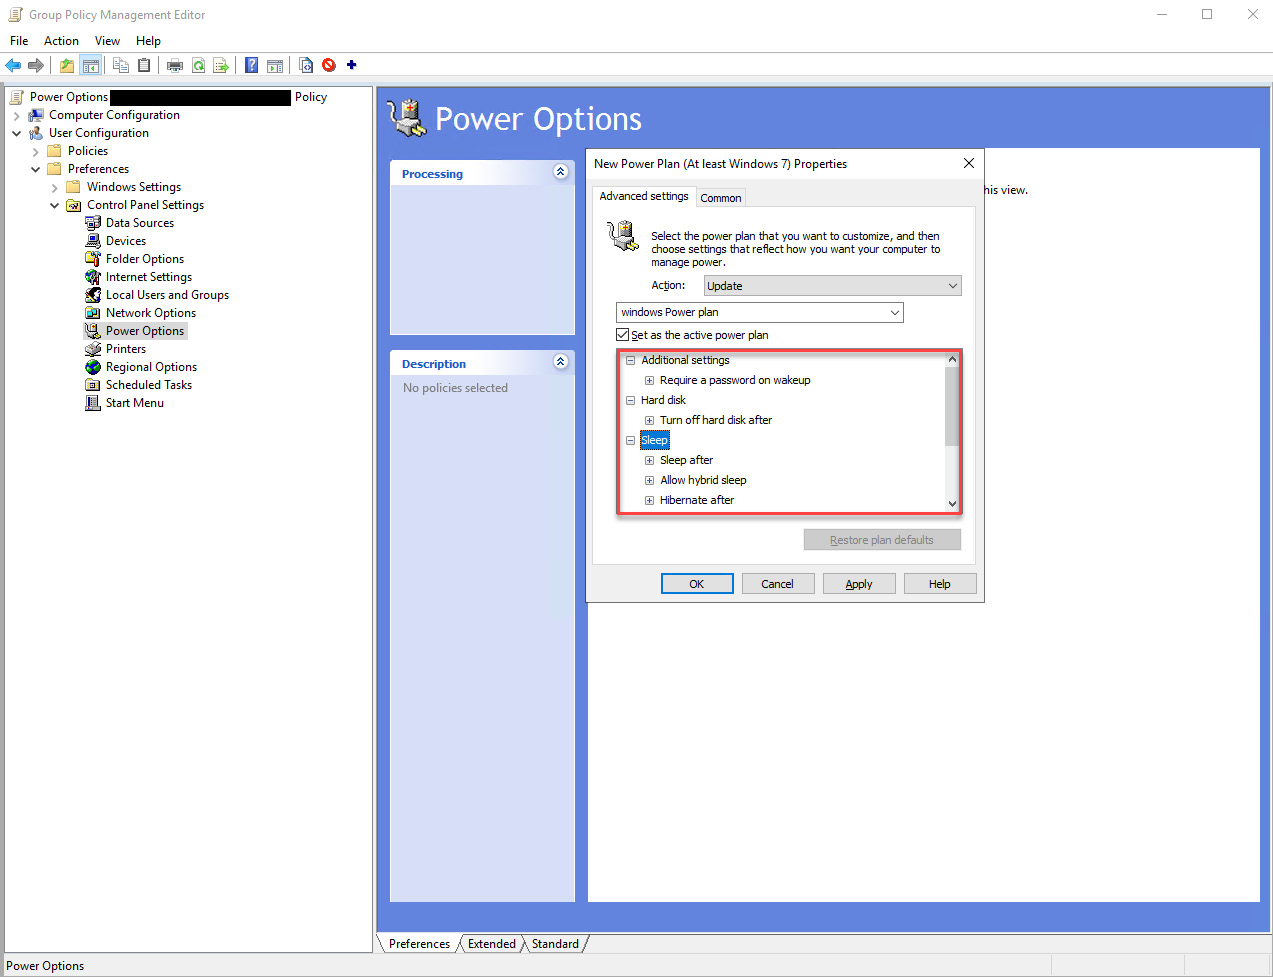
Figure 7.34 – Group Policy Management – Selecting desired power options
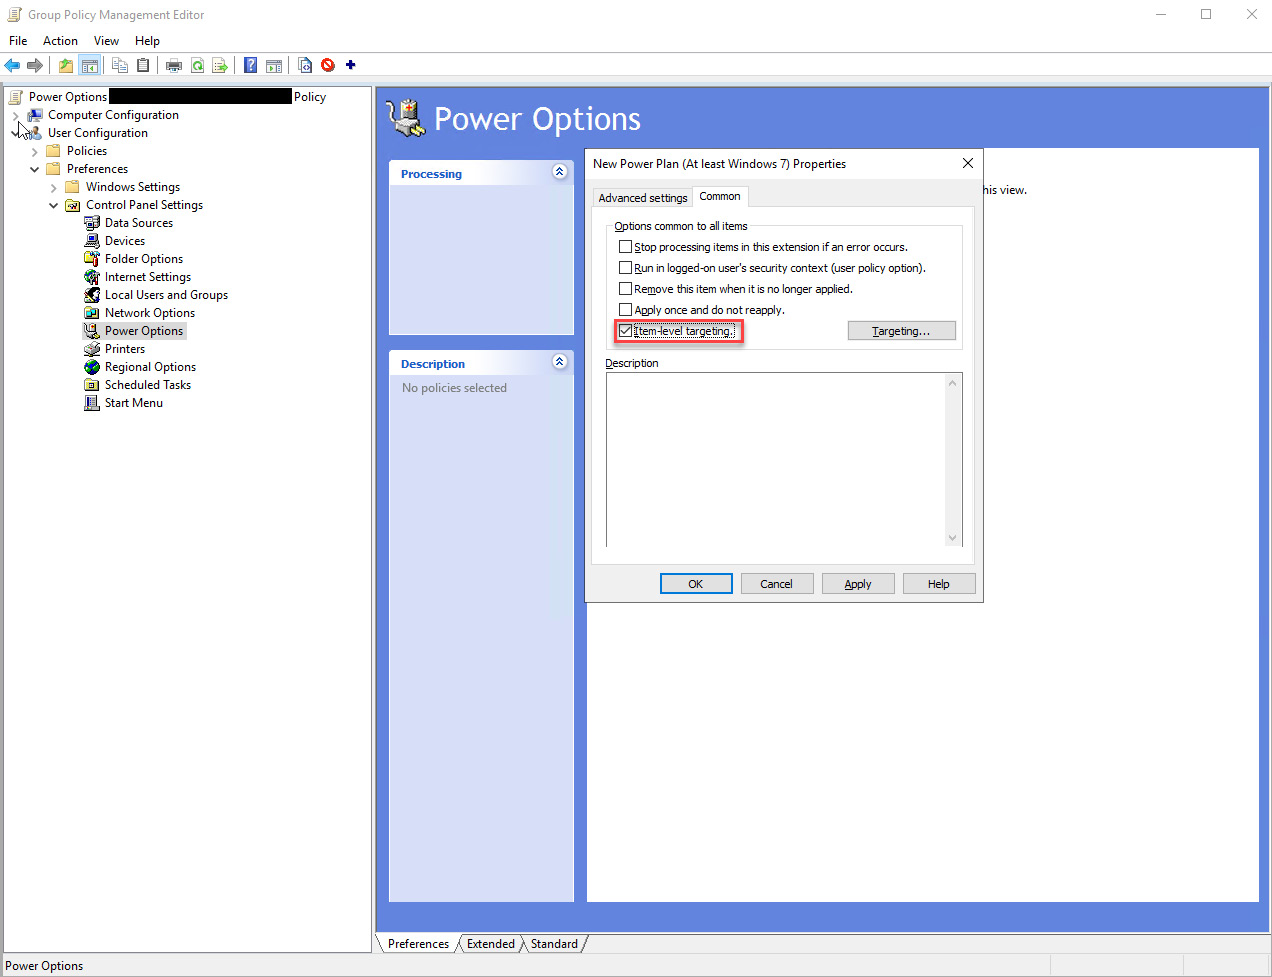
Figure 7.34 – Group Policy Management – Item-level targeting
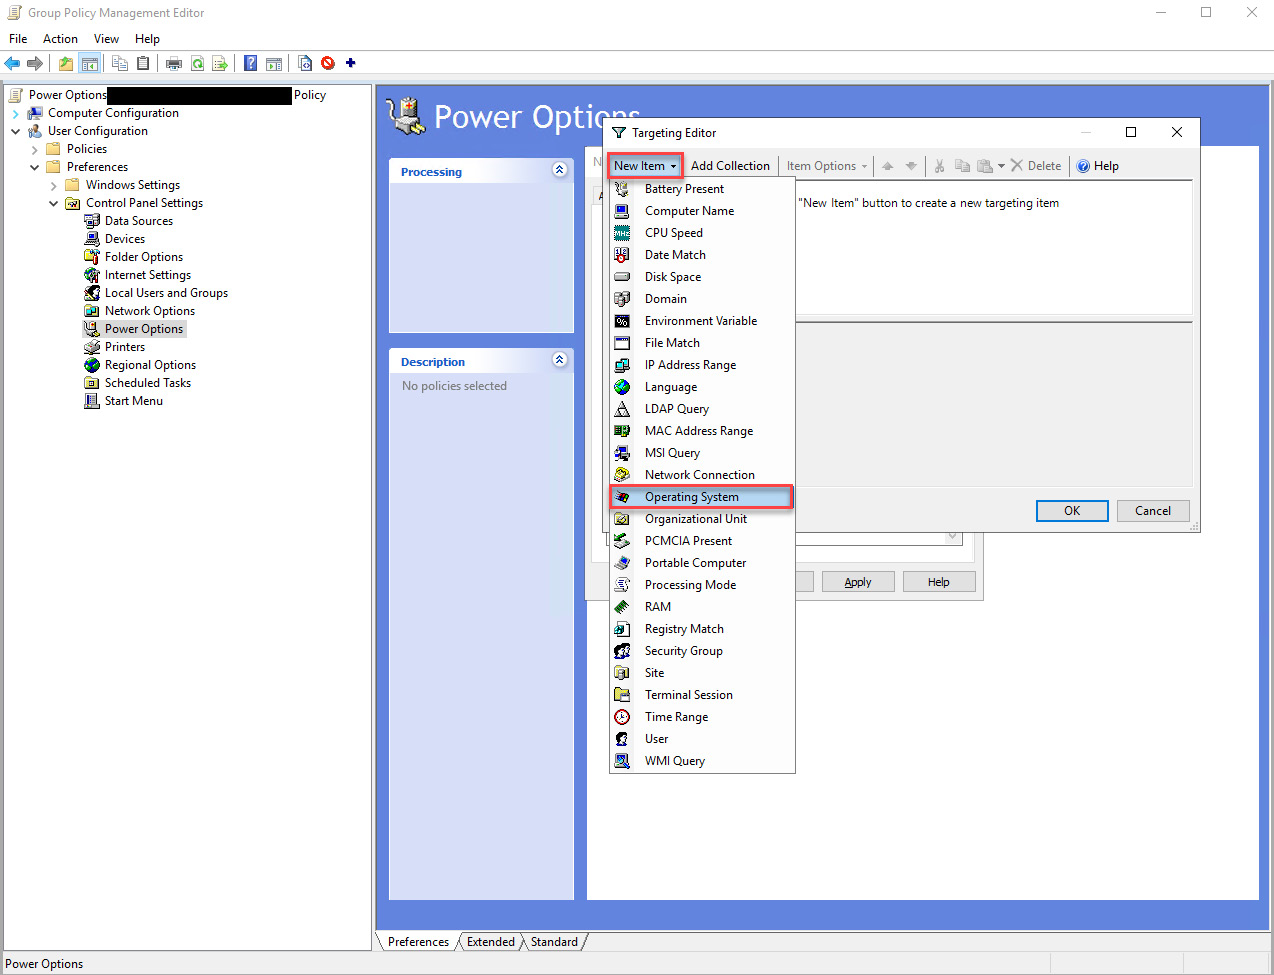
Figure 7.35 – Group Policy Management – Configuring operating systems
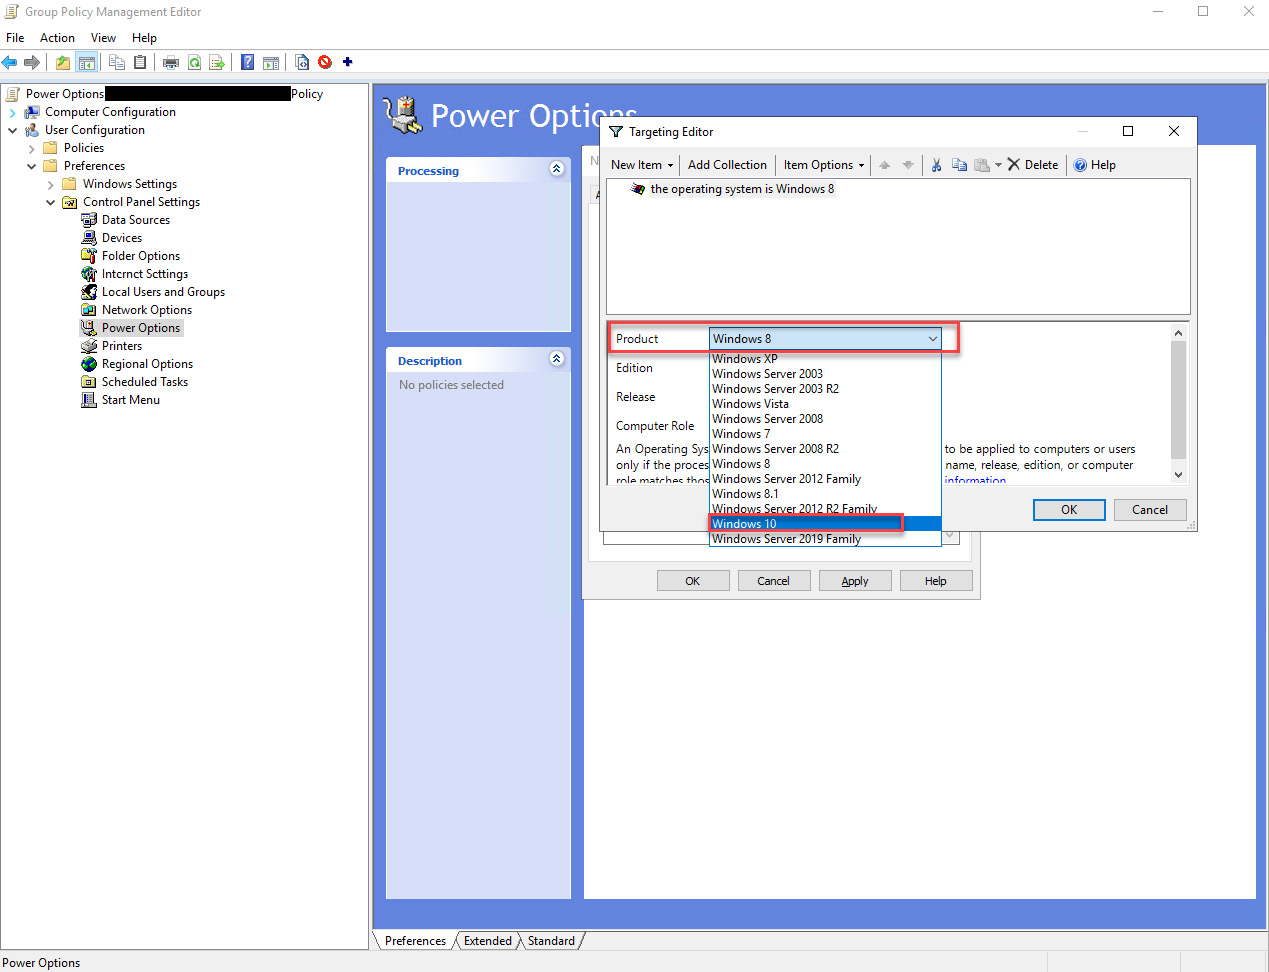
Figure 7.36 – Group Policy Management – Selecting operating systems
- Close the Group Policy Management Editor window.
Centrally managing the power consumption settings is a significant advantage for efficiency, consistency, and preserving energy from a corporate perspective. Still, it is also essential to make the group policies well known to the end users.
In the next section, we will explore some advantages of going virtual.
Going virtual
Exploring concepts such as virtual desktop infrastructure (VDI) effectively reduces end user IT hardware equipment and preserves energy. The VDI concept separates the application software from the physical client, where all the desktop components are virtualized. The user logs into a virtual desktop running on the server side, enabling a flexible and secure desktop delivery model. Essentially, the virtual desktop is available from a computer, tablet, or smartphone. All your data is stored server-side, leading to an effective disaster recovery strategy and procedures. Moving the workload from the client to the server side diminishes the need for a powerful client computer.
There are also great sustainability benefits to going virtual. Lakshmanan “Laks” Vaidyanathan – the general manager and global practice head for data center and hybrid cloud Services at Wipro Limited, whom you met in Chapter 4, Data Center and Cloud – suggests that there is an excellent opportunity for CO2 emission reduction. Wipro manages over 200,000 VDI instances across its client base, reducing 8,000 tons of CO2 emissions per annum. According to Laks, running a VDI client consumes 83 kWh/year, including power consumption on the server side. As we saw from previous examples earlier in the chapter, even with an energy-efficient notebook that consumes 110 kWh per year, the VDI client, on average, is still more than 20% energy efficient. Considering a desktop that consumes 440 kWh, the VDI client is almost 80% more energy efficient. This makes transitioning some users to VDI a very compelling case.
Exploring smart technologies
Although computers, monitors, docking stations, and printers are increasingly better tools to optimize your energy consumption, complementary techniques can be leveraged, such as smart, intelligent strips and plugs. A smart power strip and a smart plug can manage the parasitic load consumed when devices are not used to optimize energy consumption. They sit between the socket and your power cord(s), turning your electrical equipment into intelligent devices to be integrated into smart home automation or building management systems.
Not only can they help you preserve energy, but many smart appliances can also log your consumption data to understand usage patterns better. This enables smart decision-making based on relevant data points.
Summary
In this chapter, you have learned about energy mix, energy and foreign policy, and the importance of energy security within ICT. Furthermore, you should better understand the energy consumption of various ICT devices, energy consumption patterns, and how you can conduct similar calculations on your own IT equipment to calculate energy and carbon dioxide emissions. Finally, you should have actionable insights into how you can improve your resource efficiency.
These are some of the key recommendations that you should have in mind to do more with less:
- Buy resource-efficient hardware
- Educate users on energy leakage and encourage them to turn off IT hardware when not in use
- Leverage renewable energy sources
- Take advantage of various system power management settings
- Go virtual by exploring VDI and Device-as-a-Service (DaaS)
- Explore smart energy technologies
As we have reached the end of the chapter, you should better understand how you can optimize energy resource management within your IT Hardware. Applying this chapter’s learnings can significantly impact your industrial competitiveness, energy cost structure, and scope two greenhouse gas emissions.
In Chapter 8, Leveraging Your Buying Power, as the chapter title suggests, we will look at how vendor management and IT procurement plays a central role in a sustainable IT enterprise.
Further reading
- TCO Certified Product Finder: https://tcocertified.com/product-finder/
- Energy Star® Product finder: https://www.energystar.gov/productfinder/
- Energy Star Program Requirements for Computers: https://www.energystar.gov/sites/default/files/ENERGY%20STAR%20Computers%20Final%20Version%208.0%20Specification%20-%20Rev.%20April%202020_0.pdf
- Energy Star Program Requirements for Servers: https://www.energystar.gov/sites/default/files/ENERGY%20STAR%20Version%203.0%20Computer%20Servers%20Program%20Requirements_0.pdf
Bibliography
- ACER. 2020. Estimated number and diversity of supply sources 2020. Accessed May 26, 2022: https://aegis.acer.europa.eu/chest/dataitems/214/view.
- Akbari, H. 2002. “Shade trees reduce building energy use and CO2 emissions from power plants.” Environmental Pollution 116: 119-126: https://www.sciencedirect.com/science/article/abs/pii/S0269749101002640.
- Amazon. 2022. Renewable Energy. Accessed May 26, 2022: https://sustainability.aboutamazon.com/environment/sustainable-operations/renewable-energy?energyType=true.
- Andrae, Anders S.G. 2020. “New perspectives on internet electricity use in 2030.” ResearchGate. June. Accessed April 10, 2022: https://www.researchgate.net/publication/342643762_New_perspectives_on_internet_electricity_use_in_2030.
- Andrae, Anders S.G.; Edler, Tomas. 2015. “On Global Electricity Usage of Communication Technology: Trends to 2030.” Challenges 6: 117-157. Accessed May 30, 2022: https://www.researchgate.net/publication/275653947_On_Global_Electricity_Usage_of_Communication_Technology_Trends_to_2030.
- BloombergNEF. 2021. 2H 2021 Corporate Energy Market Outlook. Accessed April 01, 2022: https://about.bnef.com/new-energy-outlook/.
- —. 2022. Corporate Clean Energy Buying Tops 30GW Mark in Record Year. January 31. Accessed May 26, 2022: https://about.bnef.com/blog/corporate-clean-energy-buying-tops-30gw-mark-in-record-year/.
- Buchholz, Katharina. 2022. Which European Countries Depend on Russian Gas? 2022 Feb. Accessed May 26, 2022: https://www.statista.com/chart/26768/dependence-on-russian-gas-by-european-country/.
- Carlsson, Rebecka. 2021. Exponentiell klimatomställning. Stockholm: Lava förlag.
- EIA. 2022. Electric Power Monthly. March. Accessed June 08, 2022: https://www.eia.gov/electricity/monthly/epm_table_grapher.php?t=epmt_5_6_a.
- Energy Star. 2020. ENERGY STAR® Program Requirements for Computers. October 15. Accessed May 27, 2022: https://www.energystar.gov/sites/default/files/ENERGY%20STAR%20Computers%20Final%20Version%208.0%20Specification%20-%20Rev.%20April%202020_0.pdf.
- —. 2019. ENERGY STAR® Program Requirements for Computer Servers. June 19. Accessed May 26, 2022: https://www.energystar.gov/sites/default/files/ENERGY%20STAR%20Version%203.0%20Computer%20Servers%20Program%20Requirements_0.pdf.
- Google. 2022. Environmental Report. Accessed May 26, 2022: https://www.gstatic.com/gumdrop/sustainability/google-2021-environmental-report.pdf.
- Griffin, Andrew. 2020. More UK energy is coming from clean sources than fossil fuels for the first time, National Grid announces. independent.co.uk. January 01. Accessed May 26, 2022: https://www.independent.co.uk/climate-change/news/clean-energy-fossil-fuels-national-grid-2019-statistics-latest-a9266116.html.
- IEA. 2022. Data and statistics. International Energy Agency. May 26. Accessed May 26, 2022: https://www.iea.org/data-and-statistics/charts.
- —. 2020. Global EV Outlook 2020. June. Accessed May 26, 2022: https://www.iea.org/reports/global-ev-outlook-2020.
- —. 2021. Renewable electricity growth is accelerating faster than ever worldwide, supporting the emergence of the new global energy economy. December 01. Accessed May 26, 2022: https://www.iea.org/news/renewable-electricity-growth-is-accelerating-faster-than-ever-worldwide-supporting-the-emergence-of-the-new-global-energy-economy.
- ITU. 2021. Statistics. Accessed June 06, 2022: https://www.itu.int/en/ITU-D/Statistics/Pages/stat/default.aspx.
- Johnson, Joseph. 2022. May 09. Accessed May 26, 2022: https://www.statista.com/statistics/617136/digital-population-worldwide/.
- Markkanen, Aapo. 2021. What Is Digital Sustainability and How Does It Drive ESG Goals? November 04. Accessed May 26, 2022: https://www.gartner.com/en/articles/what-is-digital-sustainability-and-how-does-it-drive-esg-goals.
- Microsoft. 2022. 2021 Environmental Sustainability Report. Accessed May 26, 2022: https://query.prod.cms.rt.microsoft.com/cms/api/am/binary/RE4RwfV.
- Miller, Rich. 2022. Cloud Titans Were the Largest Buyers of Renewable Energy in 2021. February 11. Accessed May 26, 2022: https://datacenterfrontier.com/cloud-titans-were-the-largest-buyers-of-renewable-energy-in-2021/.
- Müller-Kraenner, Sascha. 2007. Energy security Re-measuring the World. London: Earthscan.
- Ritchie, Hannah. 2020. Sector by sector: where do global greenhouse gas emissions come from? Our World in Data. September 18. Accessed March 30, 2022: https://ourworldindata.org/ghg-emissions-by-sector.
- Ritchie, Hannah, and Max Roser. 2020. Electricity Mix. ourworldindata.org. Accessed May 26, 2022: https://ourworldindata.org/electricity-mix#citation.
- United States Census Bureau. 2021. QuickFacts United States. Accessed June 06, 2022: https://www.census.gov/quickfacts/fact/table/US/HSD410220.
- Vailshery, Lionel Sujay. 2021. IoT and non-IoT connections worldwide 2010-2025. 2021 March. Accessed May 26, 2022: https://www.statista.com/statistics/1101442/iot-number-of-connected-devices-worldwide/.
- —. 2021. IoT and non-IoT connections worldwide 2010-2025. 2021 March. Accessed May 26, 2022: https://www.statista.com/statistics/1101442/iot-number-of-connected-devices-worldwide/.