
Reflection high-energy electron diffraction (RHEED) for in situ characterization of thin film growth
Abstract:
In this chapter reflection high-energy electron diffraction (RHEED) is described in combination with pulsed laser deposition (PLD). Both the use of RHEED as a real-time rate-monitoring technique as well as methods to study the nucleation and growth during PLD are discussed. After a brief introduction of RHEED and demonstration of typical surface diffraction patterns, a case will be made for the step-density model to describe the intensity variations encountered during deposition. Finally, an overview of these intensity variations, the intensity response during a RHEED experiment as a result of various kinetic growth modes, will be given.
1.1 Reflection high-energy electron diffraction (RHEED) and pulsed laser deposition (PLD)
Reflection high-energy electron diffraction (RHEED) was limited to low background pressures only until the development of high-pressure RHEED, which made it possible to monitor the surface structure in situ during the deposition of oxides at higher pressures, presented new possibilities (Rijnders et al., 1997). Figure 1.1 is a schematic picture of a typical high-pressure RHEED set-up. Besides observed intensity oscillations due to layer-by-layer growth, enabling accurate growth rate control, it has become clear that intensity relaxation observed due to the typical pulsed way of deposition leads to a wealth of information about growth parameters (Blank et al., 1998).
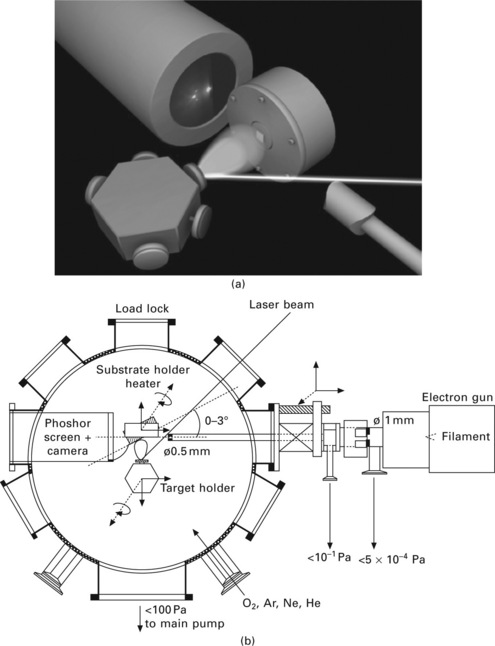
1.1 (a) and (b) A schematic view of a pulsed laser deposition chamber equipped with high-pressure RHEED.
Pulsed laser deposition (PLD) has become an important technique in the fabrication of novel materials. Starting in the mid-1960s (Ready, 1963), when the first attempts to produce high-quality thin films showed the promise of this technique, it has taken the discovery of high-Tc superconductors for PLD to become widespread. The main advantages of PLD are the relatively easy stoichiometric transfer of material from the target to the substrate and an almost free choice of (relatively high) background pressure. For instance, during the deposition of oxides, an oxygen background pressure up to 1 mbar is usually used.
The articles by Christen and Eres (2008) and Rijnders and Blank (2007a) give an extensive overview of the various growth models that apply to the highly kinetic type of deposition.
1.2 Basic principles of RHEED
In a typical RHEED system, a high-energy electron beam (10–50 keV) arrives at a surface under a grazing incident angle (0.1–5°); see also Fig. 1.2a. At these energies the electrons can penetrate any material for several hundreds of nanometres. However, due to the grazing angle of incidence, the electrons only interact with the topmost layer of atoms (1–2 nm) at the surface, which makes the technique very surface sensitive. In contrast, low-energy electron diffraction (LEED), is surface sensitive due to the low penetration depth of low energy electrons (100–500 eV). The scattered electrons collected on a phosphorus screen form a diffraction pattern characteristic for the crystal structure of the surface, and also contain information concerning the morphology of the surface. As we will see, RHEED is remarkably sensitive to variations in morphology and roughness during thin film growth and therefore is often used as method to monitor the real-time thickness.
Examples of other surface-sensitive techniques, which are used to probe crystal structure and morphology, are X-ray diffraction (see, for example, for a discussion of disadvantages and advantages of different diffraction techniques; Yang, 1993; Christen and Eres, 2008) and scanning probe microscopy (SPM); see Chapter 2. The choice for RHEED is based on both the accessibility of the sample during a deposition experiment (particle plume perpendicular to the surface and electron beam from the side) and the possibility of using it in a relatively high-pressure environment, as mentioned before. The main reason why RHEED is popular in combination with high vacuum deposition techniques is the observation of intensity oscillations of the specular intensity during deposition (Neave et al., 1983). Intuitively, intensity oscillations can be understood by considering a layer-by-layer growth front. Material deposited on an initially flat surface leads to roughening and a decrease in intensity, whereas upon completion of a crystal layer the surface becomes smoother again, accompanied by a rise in intensity, i.e. periodic island nucleation, growth and coalescence. Accordingly, RHEED can be used as a thickness monitor, since ideally the oscillation period corresponds to the deposition of one crystal layer.
1.2.1 Scattering of electrons by a solid
Electrons interact with the electrostatic potential ![]() of a solid. To describe the scattering processes, in particular the scattering of a grazing incidence electron beam as in RHEED, one has to distinguish between electrons that lose energy after scattering (inelastic scattering) and electrons that retain their energy (elastic scattering). Examples of features in a RHEED pattern which are caused by inelastically scattered electrons are Kikuchi patterns originating from electrons that have lost some energy while channelling through the crystal; examples are indicated with arrows in Fig. 1.3 (a), (b). The majority of elastic electrons scatter at the outermost atomic layer (Arrot, 1994), i.e. they are the most surface sensitive and the most interesting for a surface scientist. However, inelastic electrons are often indistinguishable from the elastic ones and contribute significantly to the total detected intensity. Many calculations are based only on elastically scattered electrons. If one then assumes weak scattering, i.e. that the scattering cross-section of individual scatterers (atoms) is low (the higher the energy of the incoming electrons, the lower the cross-section (Beeby, 1989), kinematic theory or the first Born approximation is applicable. The incident and scattered electrons are treated as plane waves,
of a solid. To describe the scattering processes, in particular the scattering of a grazing incidence electron beam as in RHEED, one has to distinguish between electrons that lose energy after scattering (inelastic scattering) and electrons that retain their energy (elastic scattering). Examples of features in a RHEED pattern which are caused by inelastically scattered electrons are Kikuchi patterns originating from electrons that have lost some energy while channelling through the crystal; examples are indicated with arrows in Fig. 1.3 (a), (b). The majority of elastic electrons scatter at the outermost atomic layer (Arrot, 1994), i.e. they are the most surface sensitive and the most interesting for a surface scientist. However, inelastic electrons are often indistinguishable from the elastic ones and contribute significantly to the total detected intensity. Many calculations are based only on elastically scattered electrons. If one then assumes weak scattering, i.e. that the scattering cross-section of individual scatterers (atoms) is low (the higher the energy of the incoming electrons, the lower the cross-section (Beeby, 1989), kinematic theory or the first Born approximation is applicable. The incident and scattered electrons are treated as plane waves,
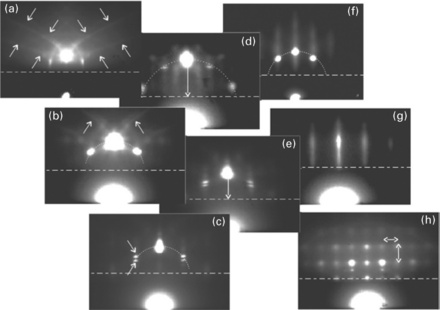
1.3 Typical RHEED patterns for different surface morphologies: (a) as received, (b) treated (with the beam parallel to the terraces), (c) treated (with the beam perpendicular to the terrace), treated (beam perpendicular to the terraces with (d) in-phase and (e) out-of-phase incoming beam, SrTiO3 (001). RHEED patterns of a SrTiO3 surface after deposition of (f) ~ one unit-cell layer SrO, (g) several unit-cell layers SrCuO2 and (h) > 2 unit-cell layers CaCuO2.
with ![]() the wave vector. The amplitude of the scattered wave for a certain direction
the wave vector. The amplitude of the scattered wave for a certain direction ![]() where λ is the wavelength of the electrons) is then given by integrating the Fourier components of
where λ is the wavelength of the electrons) is then given by integrating the Fourier components of ![]() over the volume of the sample,
over the volume of the sample,
the intensity is proportional to
where ![]() is the scattering vector or momentum transfer vector. In the first Born approximation it is possible to replace the potential by the electron density (Arrot, 1994). The problem to be solved is then analogous to X-ray diffraction; the electron density can be thought of as being concentrated in points located at the atomic positions in a solid which act as point scatterers. The scattering power of each atom is given by the atomic scattering factor or form factor; see, for example, Arrot (1994) and Beeby (1989). It is independent of momentum transfer in case of a point scatterer.
is the scattering vector or momentum transfer vector. In the first Born approximation it is possible to replace the potential by the electron density (Arrot, 1994). The problem to be solved is then analogous to X-ray diffraction; the electron density can be thought of as being concentrated in points located at the atomic positions in a solid which act as point scatterers. The scattering power of each atom is given by the atomic scattering factor or form factor; see, for example, Arrot (1994) and Beeby (1989). It is independent of momentum transfer in case of a point scatterer.
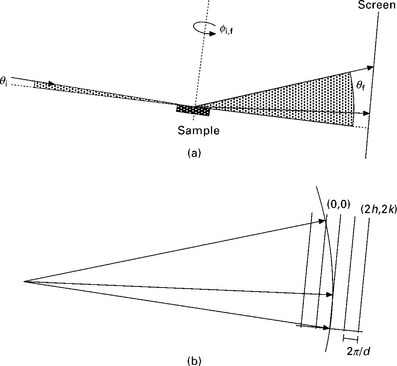
Summation over all the atoms in the sample multiplied by the form factor gives the amplitude of the scattered wave and turns out to be non-zero at distinct values of ![]() , i.e. the reciprocal lattice, when the sample is an infinitely large crystal built from regularly spaced atoms. Usually the Ewald sphere construction, a sphere with radius 2π/λ (elastic scattering) centred on the tip of the wave vector in the reciprocal space of the incoming beam, is used to identify the diffraction angles for a specific geometry and reciprocal lattice. In Fig. 1.2(b) an example of this construction is shown for a singular (i.e. perfect two-dimensional (2D) lattice of point scatterers) surface in case of RHEED. The reciprocal lattice of such a surface is a set of parallel, regularly spaced, infinitely thin rods perpendicular to the surface which intersect the Ewald sphere at points lying on concentric circles, called the Laue circles. In Fig. 1.3(b) the 0th-order Laue circle, i.e. intersections of the (0k) rods with the Ewald sphere, is visible for a SrTiO3 substrate surface, which is an example of a perfect surface.
, i.e. the reciprocal lattice, when the sample is an infinitely large crystal built from regularly spaced atoms. Usually the Ewald sphere construction, a sphere with radius 2π/λ (elastic scattering) centred on the tip of the wave vector in the reciprocal space of the incoming beam, is used to identify the diffraction angles for a specific geometry and reciprocal lattice. In Fig. 1.2(b) an example of this construction is shown for a singular (i.e. perfect two-dimensional (2D) lattice of point scatterers) surface in case of RHEED. The reciprocal lattice of such a surface is a set of parallel, regularly spaced, infinitely thin rods perpendicular to the surface which intersect the Ewald sphere at points lying on concentric circles, called the Laue circles. In Fig. 1.3(b) the 0th-order Laue circle, i.e. intersections of the (0k) rods with the Ewald sphere, is visible for a SrTiO3 substrate surface, which is an example of a perfect surface.
Following the kinematical approach, surface disorder can be treated as a deviation from a singular surface in either a lateral or a vertical direction resulting in deviations from the reciprocal lattice rods of a perfect surface. Yang (1993) and Lagally et al. (1989) give a complete overview.
It turns out that the above is sufficient for a qualitative description of the observed phenomena, e.g. roughening during thin film growth. For a quantitative treatment, necessary for crystallographic structure determination for example, one has to revert to a dynamic theory; first of all, because kinematic theory is in contradiction with the fact that elastically scattered electrons mainly interact with the outermost atoms, whereas weak interaction is assumed, and secondly, due to the grazing incidence, many atoms are involved in the scattering process, suggesting a high probability for multiple-scattering effects (Kawamura, 1989).
Many dynamic calculations aim for the solution of the Schrödinger equation in the one-electron approximation and the right choice of scattering potential ![]() . An imaginary part of
. An imaginary part of ![]() is added to account for some of the inelastic scattering effects. Since a quantitative treatment is beyond the scope of this chapter please refer to Beeby (1989) for further discussion.
is added to account for some of the inelastic scattering effects. Since a quantitative treatment is beyond the scope of this chapter please refer to Beeby (1989) for further discussion.
1.3 Analysis of typical RHEED patterns: the influence of surface disorder
1.3.1 Geometrical information of a RHEED pattern
From a RHEED pattern of a perfect low index plane with the beam directed along a low index direction one can determine the in-plane lattice constants as follows: with θi and θf the angles with respect to the surface, ϕi (= 0) and ϕf the azimuths (with an in-plane principal crystal direction as reference), of the incoming and scattered beam, respectively (see Fig. 1.2a),
For reflections fulfilling the Bragg condition the lattice constants can be derived using (1.4), for small angles:
where dx and dy are the in-plane lattice constants seen parallel and perpendicular to the beam, respectively, and n is the order of the reflection. The angles can be determined directly by dividing the relative on-screen distances by the sample-to-screen distance Rs, assuming only small angles. The wavelength λ of the electrons with an energy E (eV), used in eqs [1.4] to [1.7] is approximately given by:
For the reasons given in section 1.1, the sample-to-screen distance Rs is kept as low as possible. This has the disadvantage that determination of reflection angles is rather inaccurate (relative error ~ 10%, 5% uncertainty in the sample-to-screen distance and 5% uncertainty for on-screen distances). To eliminate the error in the sample-to-screen distance, one can calibrate the measurements to a known in-plane lattice parameter, for example, bare SrTiO3 (~ 3.905 Å, ~ 3.93 Å at 800 °C).
To understand the influence of surface disorder on the RHEED intensity, the problem of scattering from a two-level system, i.e. a certain distribution of islands of height d on a flat surface, will be discussed first. The diffracted intensity is given by:
where ![]() is the pair correlation function, i.e. the probability of finding two scatterers at a distance r. More explicitly for a two-level system with coverage θ:
is the pair correlation function, i.e. the probability of finding two scatterers at a distance r. More explicitly for a two-level system with coverage θ:
where kx is given by (1.4) and kz by (1.5). The intensity consists of a delta peak, corresponding to the Bragg condition superimposed on a broadened diffuse peak, corresponding to disorder (C′ii is the Fourier transform of the reduced correlation function between atoms on the same level (Lent and Cohen, 1984) and depends on the step distribution function). In practice, the delta peak in eq. [1.10] has to be convoluted by the instrument’s response function (multiplication with the transfer function (Jorritsma, 1997) in real space) to take instrumental broadening into account. In association with the transfer function a transfer width can be defined, analogous to the coherence length discussed below.
According to this model, intensity is most sensitive for disorder on the surface for the out-of-phase condition,
1.3.2 Examples
In Fig. 1.3, several RHEED patterns are shown of typical surfaces that have been encountered in our experiments. The different features are discussed here.
Prior to any diffraction experiment, the sample is heated to 700 °C in vacuum (~ 10− 7 mbar) to remove any contamination from the surface. If this procedure is not applied, usually charging effects due to the insulating character of the SrTi03 substrate destroy the diffraction pattern. In Fig. 1.3(a) a pattern is shown before any heat treatment in vacuum. Although a clear diffraction pattern is visible, the background intensity is rather high and the (0 ± 1) spots in particular are much weaker compared with Fig. 1.3(b) due to surface contamination.
In Fig. 1.3(c) a RHEED pattern is shown of a vicinal SrTiO3 (001) surface, a special case of a ‘disordered’ surface, where the terraces lie almost parallel to one of the principal axes of the crystal. The incoming beam is directed perpendicular to the terraces and the incidence angle is 1.6°. For 20 keV electrons used here, this is the out-of-phase condition [1.11] for SrTiO3 (001) with only steps of one unit-cell. For a vicinal surface, with the beam perpendicular to the terraces directed down the staircase, the miscut angle is given by (Pukite et al., 1989):
where Δθf is the splitting of the Bragg peak due to the additional periodicity introduced by the existence of terraces, indicated with arrows for the (01) peak in Fig. 1.3. Here we determined a miscut of ~ 0.25°. Actually, Fig. 1.3(b) is of the same surface, only with the beam directed parallel to the terraces; no splitting is observed. When eq. [1.11] is not satisfied, e.g. by changing the incidence angle, no splitting is observed. Figures 1.3(d) and (e) are patterns of a vicinal SrTiO3 surface at an in-phase and out-of-phase condition, respectively.
For a certain miscut the terraces become ‘invisible’ to the diffractometer due to instrumental broadening. More generally a surface with disorder over a surface area larger than the coherence area (Van der Wagt, 1994) appears to be flat. The critical terrace length parallel to the incoming electron beam for our diffractometer is estimated to be 3000 Å (miscut angle < 0.07°); the coherence length along the beam is an integer multiple of this length (since there must be more than one terrace for interference to occur). In contrast, the coherence length perpendicular to the electron beam is much smaller, i.e. substrates with terraces of < 800 Å (miscut angle > 0.3°) still appear to be flat in the parallel beam configuration (no splitting Δϕf has been observed on our substrates). The difference in coherence length parallel and perpendicular to the beam can be explained by the grazing incidence angle geometry typical for RHEED (see, for example, Lagally et al., 1989; Pukite et al., 1989; Van der Wagt, 1994).
In RHEED, any disorder will cause broadening of spots, which will be stronger in the direction of the beam, for similar reasons just mentioned. These so-called streaky patterns are often mistaken for a RHEED pattern of a perfect surface (Lagally et al., 1989).
Figures 1.3(f), (g) and (h) show surfaces with increasing roughness, after deposition of a unit-cell layer of SrO, after deposition of several layers of SrCuO2 and after deposition of several layers of CaCuO2, respectively. Although the SrO surface is still very smooth, some streaking has occurred due to some inevitable disorder, whereas the SrCuO2 surface is disordered and gives a streakier pattern. Again, owing to the grazing-incidence geometry, every detail on the surface responsible for broadening of the reciprocal lattice rods appears to be inflated along the beam direction.
The roughness of the CaCuO2 surface is such that transmission takes place through small asperities on the surface. The pattern has changed from a spotty pattern, where spots lie on circles, to a spotty pattern where the spots form a rectangular pattern. From the positions we conclude that these asperities still have the expected tetragonal CaCuO2 phase.
In conclusion, although information on the atomic structure is very difficult to extract from a RHEED pattern because the intensities cannot simply be deduced using kinematic considerations, the state of the surface can be qualitatively inferred. Particularly during the deposition, RHEED is a powerful tool to monitor the state of the surface and, for example, allows one to interrupt growth when undesired phases of outgrowth are being formed. In addition, monitoring the specular intensity variations, e.g. the intensity oscillations, during a deposition makes it possibile to judge the growth mode of the material, which is discussed below. First a brief explanation is given about the growth models that apply.
1.4 Crystal growth: kinetics vs thermodynamics
Traditionally, thin film growth and crystal growth are described by thermodynamic growth modes, layer-by-layer, layer-by-layer followed by three-dimensional (3D) growth, and simply 3D growth (Volmer–Weber, Stransky–Krastanov and Frank–van der Merwe, respectively), assuming (near) thermodynamic equilibrium. For many deposition techniques, especially in the case of PLD, the latter is not valid and the kinetics of the arriving species has to be taken into account.
In the case of homoepitaxy, kinetic factors determine the growth mode, whereas in the case of heteroepitaxy also thermodynamic factors, e.g. misfit, are also important. In fact, layer-by-layer growth is always predicted for homoepitaxy, even from a thermodynamic point of view (Rosenfeld et al., 1997). However, during deposition of different kinds of materials, i.e. metals, semiconductors and insulators, independently of the deposition technique, a roughening of the surface is observed. Assuming only 2D nucleation, determined by the supersaturation (Markov, 1995), limited interlayer mass transport results in nucleation on top of 2D islands before completion of a unit-cell layer. Still, one can speak of a 2D growth mode. However, nucleation and incorporation of adatoms at step edges proceeds on an increasing number of unit-cell levels, which results in the RHEED intensity oscillations being damped. In fact an exponential decay of the amplitude is predicted assuming conventional molecular beam epitaxy (MBE) deposition conditions (Yang et al., 1995).
To understand the implications of the characteristics of PLD on growth, which are expected to be kinetic in origin, homoepitaxy is the perfect system to study. However, even in the case of heteroepitaxy, kinetic models seem quite appropriate: after some ‘transient’ behaviour during the first few deposited monolayers (see also below), quasi-homoepitaxial growth is observed.
In order to be able to create a crystal structure by depositing consecutive unit-cell layers of different materials, a layer-by-layer growth model is a prerequisite: nucleation of each next layer may only occur after the previous layer is completed. Note that a 2D growth mode can either be layer-by-layer or step-flow. However, in case of step-flow growth, rate control is not possible. occasionally, the deposition conditions such as the substrate temperature and ambient gas pressure (oxygen in the case of oxide materials) can be optimized for true 2D growth, e.g. this is the case for homoepitaxy on SrTiO3 (001).
In situ RHEED studies of kinetics of growing systems have been used, as explained by the following examples. First, the transition from step-flow growth to layer-by-layer growth on vicinal surfaces has been used to estimate the diffusion parameters (Neave et al., 1985). With the beam directed parallel to the terraces, intensity oscillations disappear at a critical temperature, when all the material is incorporated at the vicinal steps. The critical diffusion length is then of the order of the terrace width. This simple picture has been extended to include, for instance, non-linear effects (Myers-Beahton and Vvedensky, 1990, 1991) and the fact that the transition is not sharp (Zandvliet et al., 1991; Shitara et al., 1992a, 1992b).
Secondly, another approach was adopted by Vvedensky et al. (1990), who studied the relaxation of the RHEED intensity after interruption of the MBE growth. Comparing the characteristic relaxation times observed during experiments with Monte Carlo simulations, the participating microscopic events can be identified, provided that all the relevant mechanisms are included in the simulation model. Note that this approach is closely connected with PLD, since after each laser pulse, relaxation of the RHEED intensity is observed and can be viewed as a kind of interrupted growth.
Finally, the relaxation behaviour of the RHEED intensity after each laser pulse has been studied in case of PLD of YBa2Cu3O7 (Karl and Stritzker, 1992), SrO (Nishikawa et al., 1997) and SrTiO3 (Blank, 1999) on SrTiO3. By time-resolved RHEED, the relaxation times for different temperatures have been measured and an estimate of the diffusion barrier is obtained (Rijnders and Blank, 2007b).
1.5 Variations of the specular intensity during deposition
Here we will consider the variations of specular intensity as a function of the variation of the surface roughness during deposition and growth of thin films.
1.5.1 Origin of the specular intensity variations
For homoepitaxy of SrTiO3 the recorded intensity oscillations are depicted in Fig. 1.4(a) together with the calculated intensities using two different models. Similar oscillations have been observed during deposition of GaAs (Van Hove et al., 1983) and Si (Sakamoto et al., 1986). From the shape and amplitude we conclude that at the conditions used here, SrTiO3 deposition proceeds in a true layer-by-layer growth mode, see also Fig. 1.4(d).
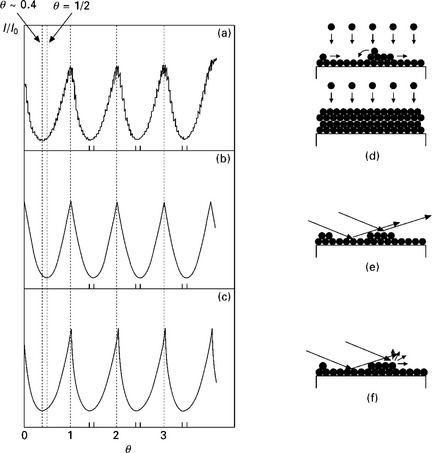
1.4 (a) Intensity oscillations during homoepitaxial growth of SrTiO3 at 850 °C and 3 Pa, indicative of true layer-by-layer growth (d). Calculated intensity oscillations using (b) the diffraction model, of which a schematic representation is given in (e), and (c) the step-density model, of which a schematic representation is given in (f). The number of pulses needed to complete one unit-cell layer is estimated to be 27.
For a qualitative understanding one can first turn to the kinematic model (1.10) for a two-level system, exemplified in Fig. 1.4(e) where interference of beams scattered from different levels is the cause of intensity variations. When a crystal layer is filled according to a geometrical distribution of steps, the calculated intensity shows cusp-like oscillations as given in Fig. 1.4(b) (Lagally et al., 1989). The integral intensity depends only on the coverage θ. For θ = 0.5 and at an out-of-phase condition (1.11), a minimum intensity is expected. When only the central delta peak is measured and the diffuse background is subtracted, this minimum should be zero. When more than two levels are participating in the diffraction process, the calculations become more complicated. However, the basic outcome is that the amplitude of the intensity oscillations decreases with the number of levels involved (Kawamura, 1989); see also below.
Another widely used model is the step density model, where the specular intensity depends negatively on the number of up and down steps on the surface. Every step can act as a diffuse scatterer and the entailed intensity is ‘lost’ for specular reflection; see Fig. 1.4(f). Although this model is highly empirical and there is no diffraction model to act as a physical explanation, it can qualitatively describe some of our results quite well. Following Stoyanov and Michailov (1988) and assuming that nucleation of islands takes place only on t = T (the period for one unit-cell layer coverage), the step density evolution as a function of the coverage is given by:
where N0 is the initial number of nuclei on t = T. When growth takes place at only one level and with a constant supply of particles, θ ∞ t, and the step density oscillations have again a cusp-like shape; see Fig. 1.4(c). A maximum of the step density σ is expected at θ ~ 0.4 (minimum intensity). For a multi-level system, θm are coupled through a series of m rate equations, where m represents the mth unit-cell level. The total step density is given by a summation over all participating levels. The basic outcome is again a decrease of the amplitude of step density oscillations, as the number of involved levels m is increased.
The shape and the occurrence of a minimum for the measured intensity oscillation suggest that here the step-density model is applicable, as indicated in Figs 1.4(a), (b) and (c). The fact that we used an incident angle corresponding to the in-phase condition and still observe strong intensity oscillations also favours the step-density model.
The observation of oscillations depends primarily on the deposition conditions, i.e., the growth mode of the material under investigation (Neave et al., 1985; Terashima et al., 1990; Hirata et al., 1993; Karl, 1993). Also the phase can be determined by the growth conditions (Zandvliet et al., 1991). For a complete overview, see Lagally et al. (1989). Any model describing the intensity oscillations quantitatively should ideally account for diffraction effects and fully describe the microscopic growth mechanisms. In computer simulations using a Monte Carlo algorithm (see Section 1.7) the step-density model is often used to calculate the intensity from a surface model that has been generated by applying microscopic growth models (Vvedensky and Clarke, 1990; Shitara et al., 1992c; Achutharaman et al., 1994; Heyn et al., 1997).
Qualitatively, these simulations seem to describe the growth front for different growth conditions rather well, although the prediction for a damping coefficient by Stoyanov and Michailov is not applicable for strongly damped oscillations. For example, the observations for SrTiO3 deposited at higher pressures or for YBa2Cu3O7 (Terashima et al., 1990) resemble more the kinematically calculated intensity of a surface as the outcome of dynamic scaling models for conservative growth conditions according to the Wolf-Villain model (Barabasi, 1995); an exponential decay of the oscillation amplitude is predicted (Yang et al., 1995).
In principle, starting with a perfect surface any damping of oscillations can be ascribed to a transition from a two-level growth front to a multilevel growth front (Lent and Cohen, 1984; Stoyanov and Michailov, 1988). The moment of island nucleation and the moment of coalescence no longer coincide and islands are formed on top of lower level islands, which have not yet coalesced.
Studying intensity oscillations, the main challenge is still the discrimination of diffraction effects from growth-governed effects (Zhang et al., 1987; Lehmpfuhl et al., 1991; Dudarev et al., 1995; Korte and Maksym, 1997; Mitura et al., 1998; Papajova and Vesely, 1998). To minimize dynamical effects, Van der Wagt (1994) suggested monitoring the specular intensity in a slightly misaligned condition.
Another important application of RHEED intensity monitoring is the observation of other growth modes, apart from layer-by-layer modes, and the study of diffusion of material during deposition.
1.5.2 Other growth-induced variations of the specular intensity
In Fig. 1.5, intensity changes typical for pulsed deposition are depicted. As can be seen from this figure, the oscillations are modulated by the laser pulse. The intensity decreases significantly directly after the laser pulse followed by an exponential rise caused by re-crystallization of initially disordered material as reported by, for example, Karl (1993) and Achutharaman et al. (1994). The characteristic times involved contain information about the diffusion and growth on the surface under study. One could suspect that the intensity modulation is just caused by scattering of the electrons by the dense laser plume. However, there are several arguments that rule this out. A large relaxation response is only observed when the surface is relatively smooth, for obvious reasons, e.g., in a 3D pattern as in Fig. 1.3(h), the intensity is not affected by the laser pulse (see also the discussion below). occasionally, under specific diffraction conditions, the intensity rises after each pulse and finally, the plume ‘lifetime’ is probably too short to have any effect on the measured intensity. Note that the sampling rate of the CCD camera frame grabber combination is maximally 15 Hz.
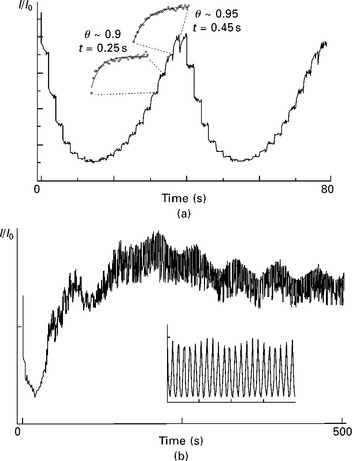
1.5 (a) Modulation of the specular RHEED intensity due to the pulsed way of deposition (T = 750 °C, ![]() ); the insets give enlarged intensity after one laser pulse plus the fit with eq. [1.15] to give characteristic relaxation times. Here, a deposition rate of 19 pulses per unit-cell layer was inferred. (b) Aliasing effect due to the integer number of laser pulses applied, the inset gives the calculated intensity according to a two-level model, from the aliasing period one can deduce ~8.9 pulses per crystal layer.
); the insets give enlarged intensity after one laser pulse plus the fit with eq. [1.15] to give characteristic relaxation times. Here, a deposition rate of 19 pulses per unit-cell layer was inferred. (b) Aliasing effect due to the integer number of laser pulses applied, the inset gives the calculated intensity according to a two-level model, from the aliasing period one can deduce ~8.9 pulses per crystal layer.
Also from the above, it becomes immediately clear that there is an integer number of pulses available for each unit-cell layer (in the event of layer-by-layer growth), which is not necessarily the exact number of pulses needed to complete one unit-cell layer. Sometimes one can observe an aliasing effect caused by the aforementioned discrepancy.
Superimposed on the intensity oscillations due to layer-by-layer growth and the modulation of the laser pulse, a third periodical variation is seen, as indicated in Fig. 1.5(b). The inset shows the calculated intensity according to eq. (1.10), where choosing an appropriate sampling frequency could simulate the aliasing effect.
The relaxation behaviour of the RHEED intensity during homoepitaxy of SrTiO3 can be studied as a function of the deposition temperature and pressure. In the regime where true layer-by-layer growth or true step-flow growth is observed, a simple model for diffusion of atoms on the surface can be applied, an extension of the known steady-state theory (Mutaftschiev, 1990), which accounts for the measured characteristic relaxation times. From these measurements an activation energy for diffusion could be derived (Rijnders and Blank, 2007a).
In Section 1.5.1, we argued that the oscillations correspond to the fluctuations of the step density on the surface, assuming that nucleation takes place exactly when each unit-cell layer is completed and N0 nuclei are formed. The step density is then given by eq. [1.16]. In addition, if this model is applicable, only diffusion of material towards ledges needs be considered. Therefore, we assume that, in this growth regime, the relaxation behaviour of the intensity after each laser pulse can be attributed to diffusing particles on the surface, treating each particle as a diffuse scatterer. In the case of diffraction theory, Van der Wagt (1994) derived an expression for the contribution of the adatom density on the surface to the intensity, which is zero for the in-phase condition. The intensity during relaxation is approximately given by:
where the adatom density is averaged over the surface of the circular island. Using this approach we can extract the kinetic factors important for layer-by-layer growth (Koster et al., 1998a). When a step flow-like growth mode is observed, the relaxation is expected to be a function of the adatom density on the terraces, now determined by the average terrace width on the surface.
At a given coverage, r0 now represents an average maximum distance for the material to diffuse in order to find a ledge (the mean field approximation). In the first approximation, r0 is considered to be constant for one laser pulse (for this to be true, the amount of deposited material per laser pulse has to be sufficiently small). We evaluated the relaxation times by fitting the intensity for each laser pulse for different coverages, temperatures and pressures using eq. [1.14]. Provided that the assumptions for layer-by-layer growth are still valid, we can use a function of the form:
where τ gives the characteristic relaxation time. For some examples of fits with eq. [1.15] see the insets in Fig. 1.5(a). For a more recent review of kinetical growth modes during PLD and important parameters, the texts by Christen and Eres (2008) and Rijnders and Blank (2007a) are recommended.
1.6 Kinetical growth modes and the intensity response in RHEED
In this section we will give an overview of the most common kinetical growth modes that one encounters during PLD: step-flow, step-flow-like (steady state), layer-by-layer, multi-level and island growth. In Fig. 1.6 the RHEED intensity response is given, together with a schematic of the growth mode: the RHEED pattern typically seen after a steady state has been reached and the accompanying surface morphology as imaged by atomic force microscopy (AFM). The horizontal axis in this image represents the ratio of the average step density and the average step density during one laser pulse.
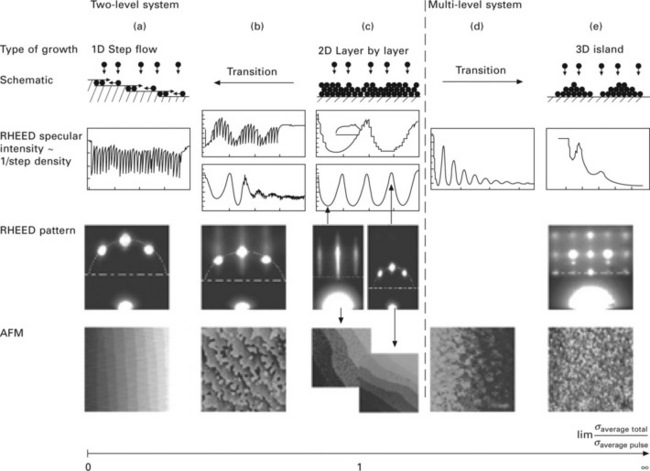
1.6 Overview of kinetic growth modes during PLD: (vertically) schematic, example of RHEED intensity vs deposition time, typical RHEED pattern and accompanying AFM image of two-level: (a) true step flow, (b) step flowlike or steady state, (c) true layer-by-layer; multi-level: (d) transient to multilevel (SrTiO3 at 800°C and 10 Pa) and (e) island growth. The RHEED intensities in (a) and (b) are reprinted with permission from Lipmaa et al. (2000).
First, in Fig. 1.6(a) a (nearly) true step-flow growth mode is shown. All deposited adatoms diffuse to and are captured by existing unit cell steps on the surface. No nucleation of 2D islands therefore occurs. As the average step density remains relatively small, the introduced step density during each laser pulse increases substantially, which is observed as a relatively large intensity modulation of the RHEED signal.
Secondly, a similar mode (see Fig. 1.6(b)), is found; however the existing steps are now formed by (pyramidal) shaped islands, which are constantly growing without any change of morphology. Therefore, nucleation has to take place, which was by definition forbidden in true step flow growth. This is confirmed by AFM in that many small islands and meandering steps are observed (Rijnders et al., 2004) and is often observed for layered oxide materials (Dam and Stauble-Pumpin, 1998).
In Fig. 1.6(c) true 2D RHEED intensity oscillations are observed when SrTiO3 is deposited with PLD, at a temperature of 850 °C and an oxygen pressure of 3 Pa (Koster et al., 1998b). Also at lower temperatures, see Fig. 1.5, this behaviour is still visible. In this figure, another feature of PLD is exemplified: the relaxation phenomenon. In the case of PLD, a typical value for the deposition rate within one pulse is of the order of 10 μm/s (Koster et al., 1998b; Geohegan and Purektzky, 1995). Therefore, high supersaturation is expected (Rijnders and Blank, 2007a) when the plume is on and thus the number of 2D nuclei can be very high. Subsequently, when the plume is off, larger islands are formed through re-crystallization, manifested as the typical relaxation of the RHEED intensity of the specular spot (Karl and Stritzker, 1992). The insets in Fig. 1.5(a) are enlargements of the relaxation after a laser pulse. From this it is clear that the characteristic relaxation time depends, among other things, on the coverage during deposition.
The relatively high temperature, in combination with a low oxygen pressure, enhances the mobility of the adatoms on the surface and, therefore, the probability of nucleation on top of a 2D island is minimized. The as-deposited adatoms can migrate to the step edges of 2D islands and nucleation takes place only on fully completed layers.
Figure 1.6(d) summarizes the response when depositing SrTiO3 at the temperature of 800 °C and the oxygen pressure of 10 Pa, with a continuous pulse frequency of 1 Hz. Apparently, the surface is evolving from a singlelevel system to a multilevel system, as indicated by the strong damping of RHEED intensity oscillations in Fig. 1.6(d). A higher pressure causes the mobility of the particles on the surface to be lower. The probability of nucleation on top of a two-dimensional island has increased, resulting in the observed roughening. In Fig. 1.6(d), AFM shows the surface after deposition of a 30 nm thick SrTiO3 film. Also from this image it is clear that the surface consists of multiple levels: at least four unit-cell levels can be seen.
In Fig. 1.6(e) the observed variations of the specular intensity during deposition of CaCuO2 are shown. Initially, there are two oscillation periods visible after which the intensity exponentially drops to below the detector limit. This is an example of a layer-by-layer growth mode, followed by 3D island growth, also schematically drawn in Fig. 1.6(e). This growth mode is often accompanied by a transmission diffraction pattern.
1.6.1 Pulsed laser interval deposition
To overcome the roughening at lower temperatures and higher pressures, several groups have suggested the use of periodically interrupted growth (Gupta et al., 1993; Rijnders et al., 1997), leading to smoother surfaces. Annealing the surface will level off any roughness that has developed during deposition. This option is especially useful in the case of co-evaporated thin films. However, considerable mobility is still needed on the surface, despite the longer waiting times. Sometimes increasing the temperature to increase the activity is an option. In the next section, a much more effective method is presented, without changing the temperature and pressure that are determined by the phase stability of the film material.
From the point of view of phase stability for many oxide materials, temperature and oxygen pressure have to be fixed. The only way to obtain true layer-by-layer growth is to apply manipulated growth, reducing the island size during growth. Here, a method will be briefly discussed, based on the high supersaturation attained during PLD; pulsed laser interval deposition. Although there is the general impression that, owing to the pulsed deposition, the growth mechanism differs partially from continuous physical and chemical deposition techniques, this has rarely been made use of. Here, we introduce a growth method based on a periodic sequence: fast deposition of the amount of material needed to complete one monolayer followed by an interval in which no deposition takes place and the film can reorganize. This makes it possible to grow in a layer-by-layer fashion in a growth regime (temperature, pressure) where otherwise island formation would dominate the growth.
Since small islands promote interlayer mass transport, one can utilize the high supersaturation achieved by PLD (Koster et al., 1999; Rijnders and Blank, 2007a) by maintaining it for a longer time interval and suppressing subsequent coarsening. Accordingly, to circumvent premature nucleation due to the limited mobility of the adatoms at a given pressure and temperature, causing a multilevel 2D growth mode, we have utilized interval deposition. Exactly one unit-cell layer is deposited in a very short time interval, of the order of the characteristic relaxation times, followed by a much longer interval during which the deposited material can rearrange. During the short deposition intervals, only small islands will be formed due to the high supersaturation typical for PLD. The probability of nucleation on the islands increases with their average radius (Rijnders and Blank, 2007a; Christen and Eres, 2008) and is, therefore, small in the case of fast deposition. The total amount of pulses needed to complete one unit-cell layer has to be as high as possible, to minimize the error introduced by the fact that only an integer number of pulses can be given. Both a high deposition rate and sufficiently accurate deposition of one unit-cell layer can be obtained by PLD using a high laser pulse frequency.
To prove the validity of this growth method, SrTiO3 was deposited using the KrF excimer laser with maximum repetition rate of 10 Hz as well as the XeCl excimer laser with a maximum repetition rate of 100 Hz. The same oxygen pressure and substrate temperature was used as in the case of continuous deposition where strong damping of the specular intensity is observed (Fig. 1.6(a)).
Figure 1.7 shows the RHEED intensity during 10 cycles of deposition (at 10 Hz) followed by a period of no deposition. In this case the number of pulses needed per unit-cell layer was estimated to be about 27. The decay of the intensity after each unit-cell layer is significantly lower compared with the situation in Fig. 1.6(d).
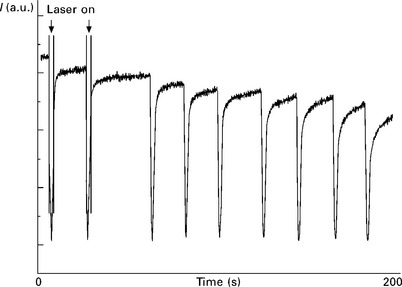
1.7 Intensity variations of the specular reflection during interval deposition of SrTiO3 using a laser repetition rate of 10 Hz. Reprinted with permission from Koster et al. (1999).
From Fig. 1.7, it can be seen that the recovery of the intensity after each deposition interval is fast at the beginning of deposition. The decrease in intensity can be ascribed to the fact that only an integer number of pulses can be given to complete a unit-cell layer, besides nucleation on the next level. A slightly lower or higher coverage causes a change in recovery time. This situation deteriorates with every subsequent unit-cell layer, as follows from increasing relaxation times.
1.7 RHEED intensity variations and Monte Carlo simulations
In order to describe the crystallization processes on the surface during thin film growth, an often-used model is the solid-on-solid (SOS) model introduced by Weeks and Gilmer (2007) and (Vvedensky et al., 1990). Diffusion of deposited material on a simple cubic crystal surface is described in terms of single-particle lattice hopping. If we assume that the particles on the oxide surface are cubes with the size of one unit-cell, the SOS model can be applied. In reality, the diffusion process is expected to be much more complicated, consisting of (de)composition steps, and the actually moving particles should be much smaller. However, effectively the process can be described by the simple cubic model. Note that the oxygen pressure will probably affect the rate of each reaction step. In our case, the oxygen pressure is assumed to be high enough and not to be rate limiting.
The diffusion kinetics is described by an Arrhenius hopping process on a l × l matrix, determined by the surface diffusion barrier ES and the nearest-neighbour coordination n (n = 0, 1, …, 4) of each particle with a lateral bond strength EN. The hopping probability k is then given by:
where k0 represents an attempt frequency (~ 1013 Hz) for atomic processes. To simulate an infinitely large crystal surface, periodic boundary conditions are applied. The Monte Carlo simulation method applied here has been extensively described by others (Vvedensky and Clarke, 1990; Maksym, 1988) and details can be found elsewhere (Van Setten, 1999).
The RHEED intensity, in view of the step density model, can be calculated as follows for the l × l matrix (Achutharaman et al., 1994):
where σ is the step density, hij are step heights on the surface and ϕ the azimuthal angle of the electron beam with respect to the principal directions of the matrix.
The pulsed way of deposition is simulated here by depositing a number of particles on the surface randomly and instantaneously, after which the particles can diffuse, when the next pulse arrives is determined by the repetition rate of the laser.
Figure 1.8 shows the simulation of continuous deposition using ES = EA = 2.2 eV, EN = 0.27 eV, k0 = 1013 Hz, f = 0° and T = 815 °C (curve 1). For these settings we observe damped intensity oscillations with a period of 20 seconds, indicating roughening of the surface. The relaxation behaviour of the intensity after each laser pulse, as seen in the inset of Fig. 1.8 (curve 1), depends on the coverage. These observations are in agreement with the experiments. Also the characteristic times obtained from the simulations agree with the measured values. Because the sampling rate (number of data points) is much higher than in the experiments, the relaxation behaviour is very pronounced even at the minimum, and the characteristic times can still be determined. Note that the amplitude decreases over time due to surface roughening. Finally, for the first period the minimum intensity seems to be shifted toward θ < 0.5, as indicated by the dashed line in the inset of Fig. 1.8, which is also observed in experiments.
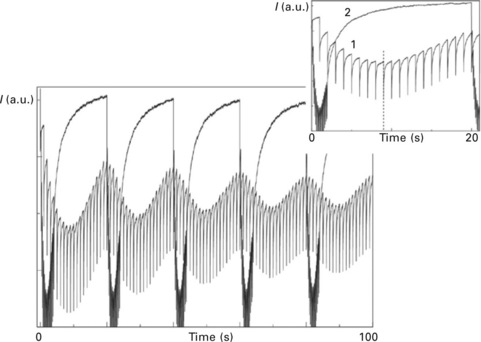
1.8 Simulated intensity variations during continuous deposition at 815°C using a laser repetition rate of 1 Hz (curve 1) and interval deposition at the same temperature using a laser repetition rate of 10 Hz (curve 2). The deposition rate was set at 20 pulses per unit-cell layer. The inset shows the first unit-cell layer.
When interval deposition is simulated, applying a laser repetition rate of 10 Hz, the typical shape of interval deposition emerges, as seen in Fig. 1.8 (curve 2). From these simulations it is clear that after each unit-cell layer, the intensity remains much higher in the case of interval deposition, which was also observed in the experiments.
1.8 Conclusions
In situ RHEED intensity monitoring of the specular reflection gives information about the nucleation of the deposited material. Moreover, by analysing the RHEED pattern, one can judge the surface quality and detect for example the origination of precipitates.
The combination of the pulsed method of deposition with intensity monitoring results in the possibility of time-resolved RHEED. Besides the observed intensity oscillations in the case of layer-by-layer growth, which enables accurate growth rate control, it is clear that intensity relaxation observed due to the typical pulsed method of deposition leads to a wealth of information about growth parameters.
To apply RHEED for growth rate monitoring at an atomic level, it is necessary to have a 2D or layer-by-layer growth mode. If possible, the deposition parameters should be adjusted to obtain a layer-by-layer growth mode. Yet, in view of phase stability, many oxide materials are not stable over large enough temperature and pressure ranges. The growth modes of layered oxide materials and the use of growth manipulation to impose a layer-by-layer growth mode have been discussed.
For successive deposition of unit-cell layers of different targets to create artificially layered structures, however, a true layer-by-layer mode is essential throughout the deposition of the entire film, since for every layer the starting surface has to be atomically flat again. A transition to multilevel has to be avoided as much as possible because the growth front may end up being thicker than each constituting layer.
For many oxide materials one cannot freely choose the deposition temperature and pressure, as in the case of homoepitaxy, to obtain layer-by-layer growth, in view of the phase stability. Often, the desired phase is stable only in a limited regime of the deposition conditions, depending on the substrate material.
The mechanisms resulting in the typical relaxation behaviour of the specular intensity after each deposition interval are expected to be more complex than in relaxation during continuous layer-by-layer growth, i.e. they do not consist of diffusion of non-interacting particles only. Therefore, we used the solid-on-solid model and simulated interval deposition using the Monte Carlo method. Experimental parameters determined earlier were used to characterize homoepitaxy of SrTiO3.
As an example, a clear difference in the calculated RHEED intensity variations is observed during continuous growth and interval deposition, which resemble the experimental results, both qualitatively as well as quantitatively. By comparing the characteristic relaxation times found for simulations using different laser repetition rates, a critical value of this repetition rate could be determined for the interval deposition method to be most effective; the deposition interval has to be shorter than this characteristic time.
1.9 Acknowledgements
The author would like to acknowledge Guus Rijnders, Dave H. A. Blank and Rik Groenen for discussions and help with graphics .
1.10 References
Achutharaman, V.S., Chandrasekhar, N., Valls, O.T., Goldman, A.M. Origin of RHEED intensity oscillations during the growth of (Y, Dy)Ba2Cu3O7–x thin-films. Phys. Rev. B. 1994; 50:8122.
Arrott, A.S. Introduction to reflection high energy electron diffraction. In: Bland J.A.C., Heinrich B., eds. Ultrathin Magnetic Structures I. Berlin, Heidelberg: Springer-Verlag; 1994:177–219.
Barabasi, A.L. Fractal Concepts in Surface Growth. Cambridge, UK: Cambridge University Press; 1995.
Beeby, J.L.Larsen P.K., Dobson P.J., eds. Reflection High-energy Electron Diffraction and Reflection Electron Imaging of Surfaces. Plenum Press: London, 1989; 29–42.
Blank, D.H.A., Rijnders, A.J.H.M., Koster, G., Rogalla, H. In-situ monitoring during pulsed laser deposition using RHEED at high pressure. Appl. Surf. Sci. 1998; 127:633.
Blank, D.H.A., Rijnders, G.J.H.M., Koster, G., Rogalla, H. In-situ monitoring by reflective high energy electron diffraction during pulsed laser deposition. Appl. Surf. Sci. 1999; 138:17.
Christen, D., Eres, G. Recent advances in pulsed-laser deposition of complex oxides. J. Phys. – Condensed Matter. 2008; 20:264005.
Dam, B., Stauble-Pumpin, B. Growth mode issues in epitaxy of complex oxide thin films. J. Mater. Sci.-Mater. El. 9(217), 1998.
Dudarev, S.L., Vvedensky, D.D., Whelan, M.J. Dynamical electron-scattering from growing surfaces. Surf. Sci. 1995; 324:L355.
Geohegan, D.B., Purektzky, A.A. Dynamics of laser-ablation plume penetration through low-pressure background gases. Appl. Phys. Lett. 1995; 67:197.
Gupta, A., Chern, M.Y., Hussey, B.W. Layer-by-layer growth of cuprate thin-films by pulsed laser deposition. Physica C. 1993; 209:175.
Heyn, Ch., Franke, T., Anton, R., Harsdorff, M. Correlation between island-formation kinetics, surface roughening, and RHEED oscillation damping during GaAs homoepitaxy. Phys. Rev. B. 1997; 56:13483.
Hirata, K., Baudenbacher, F., Lang, H.P., Guntherodt, H.-J., Kinder, H. Scanning-tunneling-microscopy study on YBa2Cu3O7–x films with growth stop by observing reflection high-energy electron-diffraction oscillations. J. Alloy Compd. 1993; 195:105.
Jorritsma, L. PhD thesis, University of Twente. Growth anisotropy in Cu(001) homoepitaxy. 1997.
Karl, H. In-situ RHEED studies of YBCO-film growth during pulsed laser deposition. IEEE Trans. Appl. Supercond. 1993; 3:1594.
Karl, H., Stritzker, B. Reflection high-energy electron-diffraction oscillations modulated by laser-pulse deposited YBa2Cu3O7–x. Phys. Rev. Lett. 1992; 69:2939.
Kawamura, T.Larsen P.K., Dobson P.J., eds. Reflection High Energy Electron Diffraction and Reflection Electron Imaging of Surfaces. Plenum Press: London, 1989; 501–522.
Korte, U., Maksym, P.A. Role of the step density in reflection high-energy electron diffraction: questioning the step density model. Phys. Rev. Lett. 1997; 78:2381.
Koster, G., Rijnders, A.J.H.M., Blank, D.H.A., Rogalla, H. Mater. Res. Soc. Symp. Proceedings. 1998; 526:33.
Koster, G., Kropman, B.L., Rijnders, A.J.H.M., Blank, D.H.A., Rogalla, H. Quasi-ideal strontium titanate crystal surfaces through formation of strontium hydroxide. Appl. Phys. Lett. 1998; 73:2920.
Koster, G., Rijnders, G., Blank, D.H.A., Rogalla, H. Imposed layer-by-layer growth by pulsed laser interval deposition. Appl. Phys. Lett. 1999; 74:3729.
Lagally, M.G., Savage, D.E., Tringides, M.C., Reflection High Energy Electron Diffraction and Reflection Electron Imaging of Surfaces. Larsen, P.K., Dobson, P.J. Plenum Press, London, 1989:139–174.
Lehmpfuhl, G., Ichimiya, A., Nakahara, H. Interpretation of RHEED oscillations during MBE growth. Surf. Sci. Lett. 1991; 245:L159.
Lent, C.S., Cohen, P.I. Diffraction from stepped surfaces. 1. Reversible surfaces. Surf. Sci. 139(121), 1984.
Lipmaa, M., Nakagawa, N., Kawasaki, M., Ohashi, S., Koinuma, H. Growth mode mapping of SrTiO3 epitaxy. Appl. Phys. Lett. 2000; 76:2439.
Maksym, P.A. Fast monte-carlo simulation of MBE growth. Semicond. Sci. Technol. 1988; 3:594.
Markov, I.V. Crystal Growth for Beginners. London: World Scientific; 1995. [pp. 81–86].
Mitura, Z., Dudarev, S.L., Whelan, M.J. Phase of RHEED oscillations. Phys. Rev. B. 1998; 57:6309.
Mutaftschiev, B.Lagally M.G., ed. Kinetics of Ordering and Growth at Surface. Plenum Press: London, 1990; 169–188.
Myers-Beahton, A.K., Vvedensky, D.D. Nonlinear equation for diffusion and adatom interactions during epitaxial-growth on vicinal surfaces. Phys. Rev. B. 1990; 42:5544.
Myers-Beahton, A.K., Vvedensky, D.D. Generalized Burton-Cabrera-Frank theory for growth and equilibration on stepped surfaces. Phys. Rev. A. 1991; 44:2457.
Neave, J.H., Joyce, B.A., Dobson, P.J., Norton, N. Dynamics of film growth of GaAs by MBE from RHEED observations. Appl. Phys. A. 1983; 31:1.
Neave, J.H., Dobson, P.J., Joyce, B.A., Zhang, J. Reflection high-energy electron-diffraction oscillations from vicinal surfaces – a new approach to surface-diffusion measurements. Appl. Phys. Lett. 1985; 47:100.
Nishikawa, H., Kanai, M., Kawai, T. Heteroepitaxy of perovskite-type oxides on oxygen-annealed SrTiO3(1 0 0) – important factors for preparation of atomically flat oxide thin films. J. Crystal Growth. 1997; 179:467.
Papajova, D., Vesely, M. Model of the RHEED intensity oscillations based on reflectivity of the MBE grown surface. Vacuum. 1998; 49:297.
Pukite, P.R., Cohen, P.I., Batra, S.Larsen P.K., Dobson P.J., eds. Reflection High Energy Electron Diffraction and Reflection Electron Imaging of Surfaces. Plenum Press: London, 1989; 427–447.
Ready, J.F. Development of plume of material vaporized by giant-pulse laser. Appl. Phys. Lett. 1963; 3:11.
Rijnders, A.J.H.M., Blank, D.H.A., Growth kinetics during PLD WileyEason R., ed. Pulsed Laser Deposition of Thin Films: Applications-led Growth of Functional Materials. 2007:177–190.
Rijnders, G., Blank, D.H.A. Materials science – build your own superlattice. Nature. 2007; 433:369.
Rijnders, A.J.H.M., Koster, G., Blank, D.H.A., Rogalla, H. In situ monitoring during pulsed laser deposition of complex oxides using reflection high energy electron diffraction under high oxygen pressure. Appl. Phys. Lett. 1997; 70:1888.
Rijnders, G., Blank, D., Choi, J., Eom, C. Enhanced surface diffusion through termination conversion during epitaxial SrRuO3 growth. Appl. Phys. Lett. 2004; 84:505.
Rosenfeld, G., Poelsema, B., Comsa, G., Epitaxial growth modes far from equilibrium Elsevier Science BVKing D.A., Woodruff D.P., eds. Growth and Properties of Ultrathin Epitaxial Layers. 1997:66–101.
Sakamoto, T., Kawai, N.J., Nakagawa, T., Ohta, K., Kojima, T., Hashiguchi, G. RHEED intensity oscillations during silicon MBE growth. Surf. Sci. 1986; 174:651.
Shitara, T., Vvedensky, D.D., Wilby, M.R., Zhang, J., Neave, J.H., Joyce, B.A. Misorientation dependence of epitaxial-growth on vicinal GaAs(001). Phys. Rev. B. 1992; 46:6825.
Shitara, T., Zhang, J., Neave, J.H., Joyce, B.A. Ga adatom incorporation kinetics at steps on vicinal GaAs(001) surfaces during growth of GaAs by molecular-beam epitaxy. J. Appl. Phys. 1992; 71:4299.
Shitara, T., Vvedensky, D.D., Wilby, M.R., Zhang, J., Neave, J.H., Joyce, B.A. Step-density variations and reflection high-energy electron-diffraction intensity oscillations during epitaxial-growth on vicinal GaAs(001). Phys. Rev. B. 1992; 46:6815.
Stoyanov, S., Michailov, M. Non-steady state effects in MBE – oscillations of the step density at the crystal-surface. Surf. Sci. 1988; 202:109.
Terashima, T., Bando, Y., Iijima, K., Yamamoto, K., Hirata, K., Hayashi, K., Kamigaki, K., Terauchi, H. Reflection high-energy electron-diffraction oscillations during epitaxial-growth of high-temperature superconducting oxides. Phys. Rev. Lett. 1990; 65:2684.
Van der Wagt, J.P.A. PhD thesis. Reflection high-energy electron diffraction during molecular-beam epitaxy. Stanford University: USA, 1994.
Van Hove, J.M., Lent, C.S., Pukite, P.R., Cohen, P.I. Damped oscillations in reflection high-energy electron-diffraction during GaAs MBE. J. Vac. Sci. Technol. 1983; 1:741.
Van Setten, E., M.Sc. thesis, University of Twente (1999).
Vvedensky, D.D., Clarke, S. Recovery kinetics during interrupted epitaxial-growth. Surf. Sci. 1990; 225:373.
Vvedensky, D.D., Clarke, S., Hugill, K.J., Myers-Beaghton, A.K., Wilby, M.R.Lagally M.G., ed. Kinetics of Ordering and Growth at Surface. Plenum Press: London, 1990; 297–311.
Weeks, J.D., Gilmer, J.H. Dynamics of crystal growth. Adv. Chem. Phys. 2007; 40:157.
Yang, H.-N., Diffraction from Rough Surfaces and Dynamic Growth Fronts. 1993. World Scientific, chapter 2
Yang, H.-N. G.-C. Wang and T.-M. Lu, Quantitative study of the decay of intensity oscillations in transient layer-by-layer growth. Phys. Rev. B. 1995; 51:17932.
Zandvliet, H.J.W., Elswijk, H.B., Dijkkamp, D., van Loenen, E.J., Dieleman, J. On the period of reflection high-energy electron diffraction intensity oscillations during Si molecular-beam epitaxy on vicinal Si(001). J. Appl. Phys. 1991; 70:2614.
Zhang, J., Neave, J.H., Dobson, P.J., Joyce, B.A. Effects of diffraction conditions and processes on RHEED intensity oscillations during the MBE growth of GaAs. Appl. Phys. A. 1987; 42:317.