
Real-time studies of epitaxial film growth using surface X-ray diffraction (SXRD)
G. Eres, J.Z. Tischler, C.M. Rouleau, B.C. Larson and H.M. Christen, Oak Ridge National laboratory, USA
Abstract:
We review recent results in the study of pulsed laser deposition growth kinetics using real-time surface X-ray diffraction. interlayer transport as the primary driving force behind formation of atomically sharp layers is analyzed quantitatively from the measurements of time constants and shot-to-shot changes in single laser shot time dependent coverages in the growth of the model perovskite srTiO3. The results show that direct deposition into the open layers and very fast interlayer transport driven by energetic species during the arrival of the laser plume are the main components of layer growth per laser shot in both homo-and heteroepitaxy of complex oxides.
9.1 Introduction
The interface between two dissimilar materials often gives rise to exotic behavior and novel physical phenomena (Sutton and Balluffi, 1995). The family of complex oxides is a class of materials that has drawn great attention in the past decade because of the rich variety of physical phenomena that have been observed at interfaces between two oxides (Dagotto, 2007; Mannhart and Schlom, 2010; Zubko et al., 2011). The most widely studied example is the interface between SrTiO3 (STO) and LaAlO3 (LAO) (Ohtomo and Hwang, 2004). It is remarkable that phenomena such as two-dimensional conductivity, magnetism, and superconductivity can arise from an interface between two oxides that are insulating in bulk (Huijben et al., 2009; Reiner et al., 2009). The chemical abruptness and the crystalline perfection of the layers play a critical role in the manifestation of interfacial phenomena. The interface sharpness is critical for the manifestation of interface phenomena in full extent and it is important for both technological applications and for facilitating fundamental understanding of the phenomena in terms of simple structural models.
Epitaxial growth is a highly controllable method for systematically assembling dissimilar materials into artificial structures with atomic-scale precision (schlom et al., 2008). The two most widely used techniques for epitaxial growth of complex oxide films are molecular beam epitaxy (MBE) (schlom et al., 2001; Doolittle et al., 2005) and pulsed laser deposition (PLD) (Lowndes et al., 1996). Both methods are capable of controlling the layer thickness with submonolayer precision to produce interfaces that change from one oxide to the other over a single unit cell distance (Lee et al., 2005; Jang et al., 2011). For its ability to control the layer thickness and layer stacking in superlattice growth, MBE has been held as the standard for epitaxial growth precision (Farrow, 1995). Over the past few years the perceived reliability gap between MBE and PLD has been closed by advances in practical implementation of PLD and fundamental understanding of the mechanisms of PLD related to layer-by-layer (LBL) growth (Willmott and Huber, 2000; Willmott, 2004; Christen and Eres, 2008).
In this chapter we discuss the advances in fundamental understanding of the growth kinetics of PLD realized by real-time studies using surface X-ray diffraction (SXRD). We discuss the reasons why these advances have been slow to materialize in application of PLD, and conclude that the potential of PLD for controlling oxide film growth is still far from being fully utilized. The goal is to understand PLD growth kinetics in terms of atomic surface transport processes from time-resolved sXRD measurements, and is not intended to be a comprehensive review of the literature. The chapter is focused on the special case of homoepitaxy of STO as a model system to study the growth kinetics of the family of perovskites in its pure form unobscured by various thermodynamic factors such as surface energies, lattice strain, and thermal expansion mismatch (Gorbenko et al., 2002; Tromp and Hannon, 2002). The general principles derived from these kinetics studies are expected to be the foundation for understanding and controlling heteroepitaxial growth that is a critical factor in developing electronic devices based on the properties of complex oxides.
9.1.1 The general features of growth intensity oscillations
We start by describing the features of growth intensity oscillations that are in general common to all diffraction methods. The specific difference between particular techniques using X-rays, helium scattering, and electrons is mainly in the surface penetration depth that must be taken into account in quantitative data analysis (Zangwill, 1988; Woodruff and Delchar, 1994). Because we use sXRD for the measurements, the rest of this discussion refers to X-rays unless otherwise noted. For the purpose of analysis the measured diffracted intensity consists of three components:
where Icoh(q) refers to the sharp specular peak that describes long-range order, Idiff(q) corresponds to the broad diffuse background surrounding the central peak that describes the short-range correlations, Ibkg is a weak slowly varying background component that is in most cases negligible. The vast majority of kinetic studies have been performed by measuring the intensity of the sharp central peak (Vlieg et al., 1988, 1995; Fuoss et al, 1992; van der Vegt et al., 1992). It is important to note that the separation of Icoh(q) + Idiff(q) depends delicately on the growth mode, and more significantly on the quality of film growth. Therefore, the analysis of the film growth kinetics in terms of layer coverages is ‘cleaner’ the closer the system is to LBL growth mode. High-quality growth is particularly important in PLD because it allows measurement of time-dependent coverages at the single laser shot level (Eres et al, 2002; Tischler et al, 2006; Christen and Eres, 2008). Analysis of the time-dependent coverages as a function of growth conditions enables extracting the surface transport timescales and narrowing down the possible mechanism of PLD growth.
The relationship between the intensity of the central peak and the coverage is according to the kinematic approximation described by the following equation:
where Fc is the structure factor, (θn − θn + 1) for n = 0, 1, 2 …, is the exposed coverage, and θ0 = 1 for the substrate. For the special case of only two levels (n = 0, 1) islands on top of the substrate Eq [9.2] describes LBL growth. The intensity of the central peak of a particular reflection is measured using a point detector. For cubic lattices the measurement point is typically the (0 0 ½) anti-Brag position where the surface sensitivity is the highest. When the X-ray beam is aligned at the destructive interference position the intensity is fully attenuated at θ = 0.5 and it recovers to its initial value again at a full layer. In this configuration the intensity of the specular rod describes the distribution of the growth species in layers parallel to the growing surface. The specular intensity contains no information concerning the size, shape, and the spatial distribution of islands. As the coverage increases from 0 to 1 in filling up of successive layers, the intensity undergoes periodic oscillations described by:
with the period of one oscillation corresponding to the time that is needed for growing one full layer. The sharp parabolic cusps in these oscillations shown in Fig. 9.1 (a) are the signatures of LBL growth.
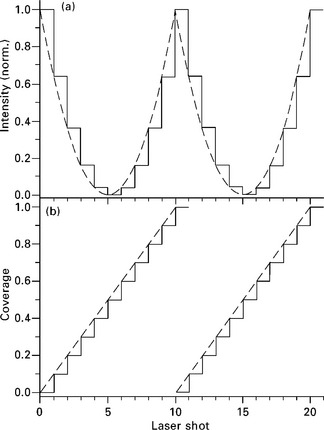
9.1 Comparison of the intensities in (a) and the coverages in (b) for LBL growth in continuous mode given by the dashed line, with pulsed LBL growth given by the solid lines.
Real growth systems are characterized by some degree of damping of the growth oscillation intensity envelope. A great deal of research has gone into generalizing these departures from LBL growth and relating them to actual growth parameters of the system. The most often observed departure is a decay of the intensity envelope that occurs as a consequence of the spreading of the growth front over multiple layers. At the simplest level of growth kinetics studies the growth intensity oscillations can be used to extract the layer coverages that provide a picture of how the interface formed and other parameters such as the interface width and surface roughness.
9.1.2 Simple models of interlayer transport
Interlayer transport is the migration of adatoms across step edges into a lower layer (Rosenfeld et al., 1997; Michely and Krug, 2004). The probability of this transport is affected by a step edge barrier, the so-called Ehrlich–Schwoebel barrier that arises from incomplete coordination of atoms at the terrace edges (Ehrlich and Hudda, 1966; Schwoebel and Shipsey, 1966). In contrast to intralayer transport or surface diffusion that is migration on a flat terrace and corresponds to lateral transport, interlayer transport refers to the effectiveness of downward vertical transport on the growing surface (Zhang and Lagally, 1997). The connection between the diffracted intensity, coverage, and interlayer transport was first made by a formalism discussed by Cohen et al. (1989). In the simplest form of this picture for a given adatom flux F, the adatoms migrate from the top of the growing islands into lower layers with an interlayer transport rate constant of k. The pulsed nature of PLD enables time-dependent studies of the growth process and the separation and identification of the various surface transport processes and the determination of their time constants (Karl and Stritzker, 1992; Chern et al., 1993; Blank et al., 1999; Lippmaa et al., 2000; Eres et al., 2002; Fleet et al., 2005). Interlayer transport plays a central role in PLD and to recognize its time-dependent features in actual growth we first discuss a couple of simple model systems.
The simplest possible model system is pulsed LBL growth, illustrated in Fig. 9.1(a), that has interlayer transport as the only transport process. The first notable feature of pulsed growth is that it breaks up the continuous parabolic growth intensity oscillation into discrete steps. The number of steps is 1/p, where p = the number of pulses that are needed for growing one full layer. The key assumption in pulsed LBL growth is that interlayer transport is infinitely fast. This assumption leads to the discrete drops and jumps in the intensity that correspond directly to the coverage changes. The perfectly flat segment separating two successive pulses is indicative of the absence of time-dependent transport processes in growth. Infinitely fast interlayer transport leads to the extreme situation that all adatoms go into the topmost unfilled layer until it is complete. This growth mode in which the growing layer is complete before a new layer starts growing is referred to as LBL growth. Such a system cannot exist on a vicinal surface because step flow would supersede LBL growth when the characteristic length scale of a terrace size is reached (Rosenfeld et al., 1997; Michely and Krug, 2004).
The next model system closer to real growth is one that has a finite interlayer transfer rate. For a system of islands on a flat surface (a two-level system) the intensity dependence on the coverage can be calculated according to the transport model by Cohen et al. (1989). In this system the intensity is allowed to recover fully to its maximum possible value for a particular step (see Fig. 9.2b) before the next pulse is applied. The time-dependent coverage in the recovery is obtained by solving the simple differential equation:
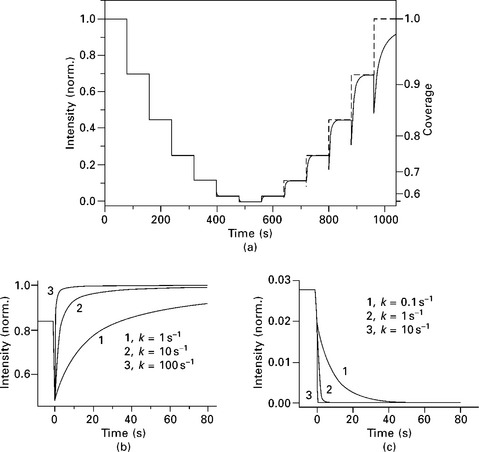
9.2 A finite interlayer transport rate shown by the solid line in (a) is manifested as recovery toward the infinitely fast interlayer transport steps given by the dashed line. The plots in (b) show that the change of the interlayer transport rate causes large changes in the shape of the recovery curves near full coverage, and barely observable rounding off in (c) near and below half coverage.
where k is the interlayer transport rate constant and b is an integration constant given by the initial coverage θ1. In Fig. 9.2(a) the intensity recovery at a given initial coverage (θ1) for a fixed coverage increase ∆θ = 1/p is compared with pulsed LBL growth. The first important feature of note is that for a finite value of interlayer transport rate the intensity curve is no longer symmetric around the minimum intensity point (θ = 0.5). This asymmetry is the manifestation of the fact that at low coverages interlayer transport is more effective than at high coverages, the island sizes are small and the adatoms can transfer off the top of the islands very quickly. With increasing coverage there are fewer holes available and the adatoms must travel longer to find them. Figure 9.2(b) shows that increasing the interlayer transport rate – this is equivalent to increasing the substrate temperature in growth – speeds up the recovery, and for very fast interlayer transport the intensity curves approximate the discrete steps in pulsed LBL growth. It is also important to note that for sluggish and incomplete interlayer transport the segment separating two successive pulses is no longer flat. Because of the quadratic dependence of the intensity on the coverage, the diffraction signal is most sensitive to interlayer transport near full coverage (Ichimiya and Cohen, 2004). The important conclusion from analyzing this simple model with finite interlayer transport is that the appearance of the recovery signal is affected not just by the time constant k = 1/τ, but also by the initial coverage (see Figs 9.2b and 9.2c) where the coverage change occurs.
9.2 Growth kinetics studies of pulsed laser deposition (PLD) using surface X-ray diffraction (SXRD)
9.2.1 Reasons for using X-rays
The purpose of using diffraction techniques in film growth studies is to obtain surface-specific real-time information on the formation and evolution of the crystalline structure on the growing surface. Over the past two decades in situ monitoring in epitaxial film growth has become synonymous with reflection high-energy electron diffraction (RHEED) (for details see Chapter 1 by Koster) (Braun, 1999; Ichimiya and Cohen, 2004; Rijnders and Blank, 2005). The use of RHEED as a growth monitoring tool is widespread primarily because the equipment is affordable, relatively easy to implement, and valuable information on the surface structure and surface ordering can be obtained instantaneously by qualitative examination of the diffraction patterns (Ingle et al., 2010). The grazing incidence geometry of RHEED provides a high degree of surface sensitivity and the configuration of the source and detection scheme does not interfere with the growth environment. However, the strong interaction of electrons with the surface causes dynamic scattering effects that require a difficult and complex theoretical treatment to explain the results. The most important feature of RHEED for growth kinetic studies is the periodic oscillation of the intensity of the diffraction spots with increasing layer thickness. Despite widespread use, the origin of the RHEED intensity oscillations remains controversial and the contributions to the scattering intensity by the coverage and the step edge density are still unresolved (Clarke and Vvedensky, 1987; Braun et al., 1998; Korte and Maksym, 1997; Joyce and Joyce, 2004). The complicated data analysis that is required to treat the RHEED scattering intensities limits RHEED to a qualitative role in growth kinetics studies.
X-ray diffraction has been the dominant tool for bulk crystallography since the discovery of X-rays (Giacovazzo et al., 2011). The superior ability of X-rays to measure length scales precisely is of great significance for the study of perovskite interfaces in film growth because their properties can be dramatically affected by minute changes in lattice parameters, atomic coordination, and symmetry. However, the large penetration depth and the low signal intensity make X-ray diffraction unfavorable for surface studies. The 1012 photons/s intensity available at third generation synchrotrons helps to overcome the main obstacle for application of X-rays in surface structure studies and opens up the possibility of using X-ray diffraction as a routine surface science tool. These high intensities enable the use of special configurations and techniques that maximize the surface sensitivity of X-rays leading to rapid growth of SXRD applications. The increasing availability of beam time at third generation synchrotrons over the past decade has resulted in the rapid growth of techniques using X-ray diffraction for surface studies. Further details of performing SXRD with synchrotron X-rays will be given in the following section.
The main justification for using synchrotron X-ray diffraction for growth kinetics studies is the straightforward data analysis (Fuoss and Brennan, 1990; Braun and Ploog, 2006). The weak interaction of X-rays with the surface makes the kinematic treatment of the scattering intensity fully adequate for analyzing the data (Kaganer, 2007). The key advantage of SXRD is that, unlike RHEED, it enables quantitative determination of surface coverages directly from the measured intensities (Rijnders and Blank, 2005). The step edge density is irrelevant for sXRD. The analysis of the scattering intensity in terms of the coverages of incomplete layers is the starting point for testing and validating simple growth models. Another advantage related to the high brilliance of synchrotron X-rays is that time-resolved measurements of structural changes can be performed. The faster the timescales are, the higher is the X-ray intensity needed to perform the measurements with adequate signal to noise ratio. The processes that are most interesting for understanding the mechanism of PLD growth occur on a microsecond or faster timescale.
9.2.2 The use of SXRD for growth kinetic studies
The surface sensitivity of X-ray diffraction originates from the truncation of the three-dimensional periodicity of the bulk lattice by the surface. The X-ray scattering theory of the surface sensitivity has been treated extensively and for details the interested reader is referred to the books and a number of excellent review articles cited in the references (Feidenhans’l, 1989; Robinson and Tweet, 1992; Als-Nielsen and McMorrow, 2001). As a consequence of the abrupt termination of the crystal lattice, the Bragg points of the bulk lattice are connected by streaks of intensity with the minimum value at the mid-point (anti-Bragg) between two neighboring Bragg peaks, corresponding to scattering from a single lattice plane. The mathematical form of the scattering intensity is given by:
where Fc the structure factor contains all the atomic coordinates. The rods of scattering intensity described by this equation are referred to as crystal truncation rods (CTRs). The CTRs provide information about the vertical structure of the surface and are extremely sensitive to changes of the lateral periodicity with respect to the bulk. Several orders of magnitude variation of the scattered intensity can be observed with changes in atomic site occupancy, surface relaxation, presence of adatoms, and surface roughness. Feidenhans’l, (1989) and Saldin and Shneerson (2008) are excellent review articles providing details concerning the use of CTRs for surface structure determination.
The most significant feature of the CTRs for growth kinetics studies is that they are sensitive to the surface coverage. This dependence of the scattering intensity on the coverage illustrated in Fig. 9.3 is used for performing growth kinetics studies by measuring the intensity of the cTRs at some point along the CTRs. The surface specificity is the highest at the anti-Bragg point. The perfection of the initial surface is a critical requirement for using the CTR intensity measurements for growth kinetic studies because surface roughness weakens the CTRs, resulting in significantly reduced scattering (Robinson, 1986).
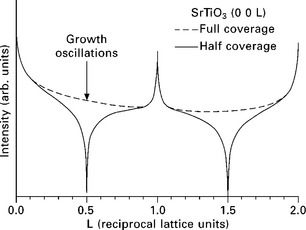
9.3 Illustration of the intensity of the (0 0 L) specular crystal truncation rod at half and full surface coverage. The anti-Bragg position marked with the arrow is where the largest intensity changes occur with coverage and is the most favorable point for measuring the growth intensity oscillations.
9.2.3 Experimental set-up
The typical components of the experimental set-up for SXRD studies of film growth include a PLD chamber that is coupled or integrated with a diffractometer used for positioning the sample and the detector with respect to a fixed incident X-ray beam. The chamber is equipped with two Be windows to permit the entrance and the exit of X-rays with minimal attenuation and scattering. Beyond the basic components, the actual implementation of SXRD measurements can vary greatly in terms of the chamber configuration, the diffractometer geometry, and the detection method and scheme chosen.
Our PLD chamber is mounted on a diffractometer that uses the (2 + 2)- circle diffraction geometry that is optimized for surface X-ray diffraction measurements (Evans-Lutterodt and Tang, 1995). The schematic illustration of the main components of this system is shown on Fig. 9.4 and a picture of the portable growth system in Fig. 9.5. The diffractometer has four degrees of freedom consisting of two angles γ and δ for setting the position of the detector, and χ and ϕ for setting the angle of incidence and the azimuth of the sample, respectively. The sample is mounted with its surface in the vertical plane and a set of three motorized micrometer pushrods attached to the back of the sample holder are used for changing the two tilt angles χ1 and χ2 that are used for aligning the surface normal perpendicular to the incident X-ray beam. The X-ray beam enters through a 2.5 cm (one inch) wide rectangular Be window and the diffracted X-rays exit through a recessed cylindrical segment Be window that covers an angle of 120° at 10 cm (4 inch) radius and is 12.5 cm (5 inches) wide. The scattered X-rays are detected by either point detectors of the thallium-doped NaI scintillator type or by fast avalanche photodiode detectors mounted on the detector arm. Using area detectors such as a CCD camera no scanning is required and the entire diffraction profile can be captured faster to enable time-resolved studies of the broad diffuse scattering around the CTR.
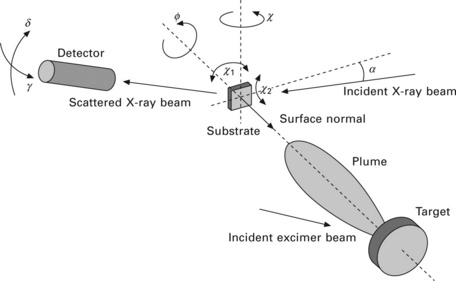
9.4 Schematic illustration of the (2 + 2)-circle diffractometer angles for real-time measurements of PLD growth by SXRD. The angles γ and δ are used to position the detector. The angle of incidence of the X-ray beam on the sample is set using χ, and ϕ changes the azimuth of the sample. The sample normal is aligned perpendicular to the incident X-ray beam using a set of three motorized micrometer pushrods that adjust the angles χ1 and χ2.
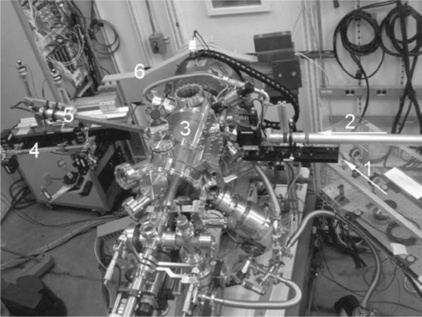
9.5 A picture of the portable PLD chamber aligned in the hutch. The excimer laser beam path is designated by 1, the X-ray beam enters the chamber along 2, and the scattered X-rays exit through a large Be window 3. The detector arm shows the bottom detector 4 aligned on the (0 0 ½) and the top detector 5 aligned on the (0 0 ½) position. The δ motion of the detector is shown by 6.
The excimer laser enters the chamber through a quartz window and a projection optical system is used for obtaining a laser spot with an exactly defined shape and size with a uniform energy density on the target. Laser ablation is performed in the typical fluence range of 1–3 J/cm2. The targets are loaded in a computer-controlled multi-target carousel that accommodates three targets, and is programmable for superlattice growth. The sample heating is performed by a pyrolytic boron nitride encapsulated graphite filament heater. The sample temperature is determined by measuring the lattice constant expansion at the (0 0 2) Bragg angle using a Ge analyzer and comparing it with the thermal expansion data for sTo. The chamber is evacuated by a turbo molecular pump to a background pressure in the low 10− 7 torr range. PLD of STO was performed in an oxygen pressure range from vacuum to 10 mtorr.
9.3 Real-time SXRD in SrTiO3 PLD: an experimental case study
The preparation of the STO substrate surface is a critical step in the SXRD growth experiments. It is known that high-quality growth occurs only on TiO2-terminated STO surfaces (Kawasaki et al., 1994; Koster et al., 1998; Ohnishi et al., 2004). There is a large amount of literature regarding the exact details of how such surfaces are prepared by different groups. The previous studies of static STO surface structure by CTR measurements provide background information about the state of the starting STO surface (Charlton et al., 2000; Herger et al., 2007). The most important factor for SXRD is the initial scattering intensity by the substrate measured at the growth temperature. The initial intensity for good substrates at 650 °C is higher than 5 × 10⁵ cps, and for excellent substrates exceed 106 cps and is roughly equal for the specular (0 0 ½) and the off-specular (0 1 ½) rod. The higher these initial intensity values are, the better the time-resolution that can be achieved and the faster the kinetics that can be studied.
The scattering conditions in the film growth experiments are set to monitor the formation of STO unit cells (u.c.). The scattered intensity is measured simultaneously at the (0 0 ½)specular and the (0 1 ½)off-specular rod before, during, and after each laser shot. The significance of measuring simultaneously the intensity of a specular and an off-specular rod is that the timescale of surface ordering can be confirmed from the time delay between the transients corresponding to the two rods. The specular rod has momentum transfer along the surface normal and provides information only about the arrival and height distribution of material. The in-plane registry with the lattice on the growing surface corresponding to crystal growth is determined by measuring the intensity of an off-specular rod (H,K) ≠ (0,0) which has an in-plane momentum transfer component.
Persistent growth intensity oscillations illustrated in Fig. 9.6(a) are observed simultaneously at both specular and off-specular rods during STO PLD from 310 to 780 °C (Eres et al., 2002). Figures 9.6(b) and 9.6(c) show that the PLD growth oscillations made up of single laser shot signal retain the overall parabolic shape. In the rest of this chapter the steps corresponding to single laser shots are referred to as SXRD transients or just transients. Each SXRD transient is a unique description of the conditions on the growing surface for the time duration between two laser shots referred to as the dwell time. The transients have a characteristic shape that depends on the surface coverage at the time of the laser shot. All transients that occur below half-coverage have a different shape shown in Fig. 9.6(c) from those above half-coverage. The transients clearly consist of two stages as Fig. 9.6(d) shows that occur on vastly different timescale.
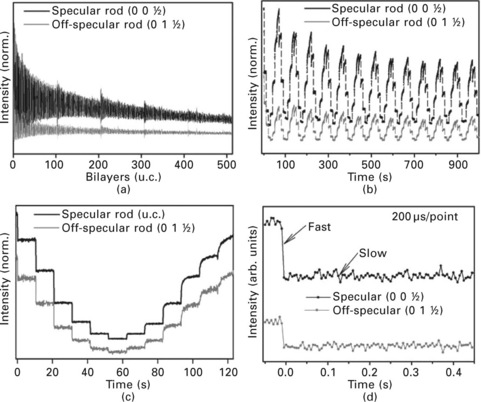
9.6 (a) Persistent layer-by-layer growth oscillations for more than 500 bilayers of STO simultaneously measured for both specular (black) and off-specular rods (gray). (b) Parabolic growth intensity oscillations for both (0 0 ½) and (0 1 ½) rods showing the single laser shot transients. (c) One full period showing time-resolved individual laser shots for both specular and off-specular rods. (d) Single shot transients measured with 200 μs/point time resolution clearly show the fast and the slow steps.
9.3.1 Surface transport timescales
In a continuous growth system such as MBE the coverage evolution is governed by a steady state among the various surface transport processes. chopping a continuous beam was explored as a way of uncoupling the various surface transport processes and determining their role in the surface structure formation. The few experimental studies performed by chopping continuous molecular beams have produced inconclusive results on the benefits of incident flux modulation (Larsson et al., 1995). The weak effect from chopped beams suggests that pulsing of thermal beams alone is not sufficient to produce smoother surfaces. Subsequent work directly comparing MBE and PLD growth concluded that the energetic effects of arriving growth species play an important role in the ability of PLD to produce a smooth surface (Taylor and Atwater, 1998; Hinnemann et al., 2001; Shin and Aziz, 2007; Warrender and Aziz, 2007, Aziz, 2008; Schmid et al., 2009).
The inherently pulsed nature and the enormous dynamic range of PLD with ratios of instantaneous to time-averaged growth rates that by some accounts exceed six orders of magnitude make PLD an ideal method for real-time studies of growth kinetics. These studies are greatly needed because the mechanism of PLD remains unresolved and the topic is not immune to occasional controversy (Tischler et al., 2006; Willmott et al., 2006; Vasco and Sacedon, 2007; Ferguson et al., 2009). In the prevailing picture of PLD the deposition and the growth processes are assumed to be two separate stages. The deposition stage consists of the landing of the laser plume on the growing surface where the growth species begin their search for the proper crystallographic sites. The growth stage is best described as the actual time spent on the growing surface before incorporation at the proper crystallographic site occurs. This is a very important timescale for understanding the PLD mechanisms because this is the stage during which the extra kinetic and internal energy that the growth species arrive with must be transformed or dissipated.
Some insight into the rate at which this extra kinetic energy is dissipated can be gained from theoretical calculations and Monte Carlo simulations of energetic ions impinging on the surface (Jacobsen et al., 1998; Adamovic et al., 2007). These calculations show that the energy of ions in a 20–50 eV range is dissipated in a few collisions that occur on a picosecond timescale. Obviously this timescale is inaccessible by any current diffraction technique. These simulations provide direct evidence that the transition from three-dimensional (3D) growth to two-dimensional growth (2D) is induced by atomistic processes that occur within the initial 10 ps following the collision with the growing surface (Adamovic et al., 2007).
9.3.2 A brief stage of perfect layer growth
A closer look at the features of the SXRD transients reveals that the growth of the first layer in PLD growth of STO is uniquely different from the rest of the growth. The kinetic signature of the SXRD transients in this regime shown in Fig. 9.6(c) is that of the sharp drops and flat steps that characteristically occur only for the model system of pulsed LBL growth in Fig 9.1(a). This is a special situation that occurs only on extremely high-quality substrates that have very few or no residual holes left by the substrate preparation step on the starting STO surface. On these perfectly terminated initial surfaces STO growth starts by nucleation of small islands of a few nm size. The average island spacing shown in Fig. 9.7(a) corresponds to a parameter referred to as the nucleation distance (l) (Pimpinelli and Villan, 1998). At this stage the number and density of islands increase rapidly, but cannot increase indefinitely because as the inter-island spacing falls, the growth species are more likely to collide with the edges of existing islands, than with each other. This island density is known as the saturation island density (Ns) and is characterized by the smallest inter-island separation (λ) shown in Fig. 9.7(b) that can occur on a particular growing surface. PLD is unlike other film growth methods in that Ns, which typically occurs at a few percent of surface coverage, is almost always reached during the very first laser shot (Lam et al., 2002; Schmid et al., 2009). The growth on this surface is LBL growth because on smooth starting surface there can be only one layer open (incomplete) and all incoming material must go into this single open layer. As already mentioned, LBL growth is a hypothetical situation that is unsustainable in real systems (Rosenfeld et al., 1997; Michely and Krug, 2004).
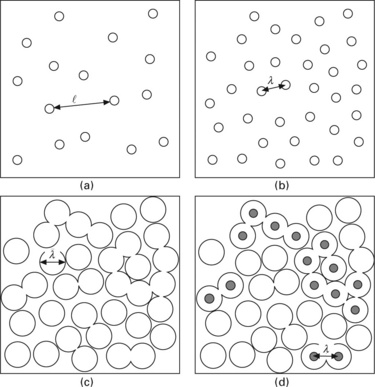
9.7 (a) The nucleation distance ![]() at low coverage. (b) The island separation λ near saturation island density. (c) The onset of coalescence occurs when λ matches the island diameter 2r resulting in formation of networks of interconnected islands. (d) Nucleation of a new top layer (black islands) on top of the base layer by the first shot after coalescence.
at low coverage. (b) The island separation λ near saturation island density. (c) The onset of coalescence occurs when λ matches the island diameter 2r resulting in formation of networks of interconnected islands. (d) Nucleation of a new top layer (black islands) on top of the base layer by the first shot after coalescence.
This brief stage of LBL-like growth ends when the island size (r) reaches λ as shown in Fig. 9.7(c). The mechanism by which r increases to reach λ is coalescence, which occurs when the islands grow so large that their edges run into each other (Zinke-Allmang, 1999; Evans et al., 2006). In a post-coalescence regime a percolation network forms that corresponds to an instantaneous jump in the effective island size (or connectivity length) because the islands are partially or fully interconnected into a larger continuous network. The significance of r reaching or exceeding λ is that now the island nucleation requirement is satisfied on top of the growing islands and new islands must nucleate on the growing layer. The growing layer from here on is referred to as the ‘base’ layer to differentiate it from the substrate as a layer on which a second layer can nucleate, which is referred to as the ‘top’ layer. It is well established by mathematical models of various levels of sophistication and independently by experimental studies of numerous growth systems that the onset of percolation on surfaces always occurs before full coverage (Evans et al., 2006). The percolation threshold is 0.593 for a random adlayer on a square lattice and the onset can be delayed to about 0.8 for special island configurations. The experimental values estimated for the percolation threshold in STO PLD fall in the range from > 0.5 to < 0.8. The onset of coalescence in STO completes the brief stage of LBL-like growth and opens up a new growth stage that is the highest perfection growth mode physically possible by any growth method, and it is this growth mode that is truly representative of PLD film growth.
9.3.3 Simultaneous two-layer growth
Island coalescence transforms the growing surface from island growth on a flat surface to island growth on a base layer with holes (island growth on top of islands that are on a flat surface). This is a permanent transformation and a single layer growth surface (truly atomically flat surface) never appears again because the conditions for nucleation of the next layer are always satisfied before the previous (base) layer is completed. It is important to note that a step edge (Ehrlich–Schwoebel) barrier is not necessary for the nucleation of the second layer (Rosenfeld et al., 1997; Michely and Krug, 2004). However, the presence of a step edge barrier would accelerate the growth front broadening and force an earlier transition into three-dimensional growth (Tersoff et al., 1994). Coalescence is a convenient reference point for distinguishing the growth behavior that occurs simultaneously on the two respective layers. The island nucleation and island growth process on top of the base layer (top layer) is referred to as the pre-coalescence stage and the hole filling in the base layer as the post-coalescence stage. In this growth mode that we refer to as simultaneous two-layer (S2L) growth there is always one layer in the pre-coalescence and one layer in the post-coalescence stage of growth.
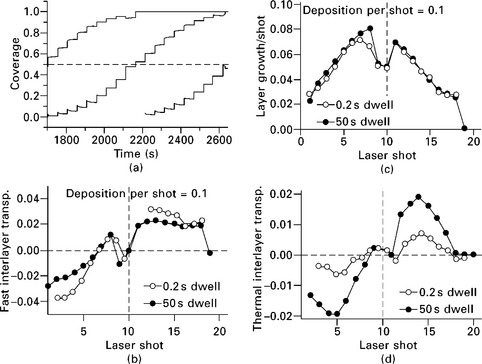
An important consequence of the opening of an extra layer is that the intensity maxima in the growth oscillations never again reach their initial value. The intensity maxima (marked by dashed lines in Fig. 9.8) now occur at coverage where more adatoms join islands on top of the base layer than are filling holes in the base layer (i.e. equal hole and island areas). The magnitude of these maxima is always less than the initial intensity because even when the base layer is complete there are already islands that according to Eq [9.2] interfere destructively with the base layer and reduce the intensity.
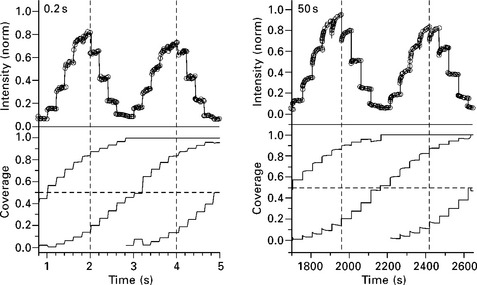
9.8 The time-dependent coverages in the bottom plots were extracted by calculating the intensity of the growth transients given by the solid black lines for each measured data point given by the circles for 0.2 s and 50 s dwell time. The vertical dashed lines mark one oscillation period as the time between two successive maxima, and the horizontal dashed lines mark the half coverage point.
The simple model by Cohen discussed in Section 9.1.2 vividly illustrates the important role that interlayer transport plays in the formation of sharp interfaces. There is a striking similarity between the features of the PLD SXRD transients in Fig. 9.8 with the simple model systems in Section 9.1.2, suggesting that PLD is remarkably close to LBL growth. In practice, the Cohen-type transport models never work satisfactorily because a single interlayer transport is unable to capture the complexities of surface transport during film growth in real systems. The usual approach is to introduce fitting parameters to extract the surface coverage by fitting the growth intensity oscillations (van der Vegt et al., 1992; Alvarez et al., 1998). In this approach the true growth kinetic information is not available because the physical meaning of the fitting parameters is not clear. Nevertheless, the important contribution of the early SXRD studies of continuous growth systems (MBE) is that they show that a simple mathematical model can be used to unambiguously connect the diffracted intensity with coverage evolution that is governed by some type of surface transport.
Instead of fitting the data to transport models we developed an approach that allows direct determination of the time-dependent surface coverages from the diffracted intensity (Tischler et al., 2006) under two-layer growth conditions. This analysis is performed without any further assumption about the physics of the underlying growth process, such as the shape of the islands. The analysis is based on the fact that the kinematic approximation allows a straightforward calculation of the intensity subject only to the coverage of the incomplete layers. In contrast the RHEED intensities must be interpreted in terms of the step edge density.
The validity of the two-layer assumption for calculating the time-resolved coverage from the SXRD intensities was confirmed by analysis of the surface roughness of the starting growth surface and the films grown on the same substrates. AFM imaging of a great number of films illustrated in Fig. 9.9 with different thickness grown under different conditions shows that even for films more than 100 u.c. thick the surface roughness for high-quality S2L PLD growth never exceeds two layers. The best samples that exhibit persistent growth intensity oscillations show minimal growth front broadening compared to the substrate as shown by the histograms in Fig. 9.9(b). Because the overall intensity is the result of cancellation of the scattering contribution from all even layers by all odd layers (see Eq. 9.2), the interface width cannot be determined uniquely from the value of the intensity alone. The AFM images provide independent data that exclude the possibility of interface broadening beyond two layers in high quality S2L growth and confirm that the data are consistent with a two-layer (three-level) surface illustrated in Fig. 9.10.
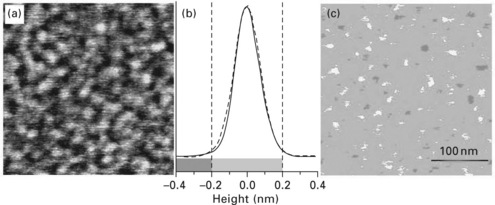
9.9 Atomic force microscopy (AFM) image of the STO film surface after growth of more than 20 u.c. given in standard image presentation in (a). The same image was plotted in (c) by adjusting the grayscale shades defined at the bottom of the histogram in (b) to change at one u.c. height to convey what the X-rays are ‘seeing’ and to aid visualization of the height distributions. The histogram in (b) compares the surface width after growth (dashed line) with the surface width of the starting surface of STO (solid line).
9.10 (a) The expected coverages for the three levels given by fractions fn (n = 1–3) of the incoming plume distributed on the growing surface according to the exposed surface area. (b) The components of fast interlayer transport gfn and the growth of the layer ∆θn (c) Thermal interlayer transport is separated out to emphasize that STO growth is over and that only already crystallized STO transfers in this step.
Accordingly, the starting point for the quantitative analysis of the SXRD transient intensities is given by the following two-layer form of Eq. [9.2]:
where I0 represents the initial intensity and θ1(t) and θ2(t) are the fractional coverages of the base layer θ1(t) and the top layer θ2(t), respectively. With the constraint that the deposition per shot 1/p = θ1(t) + θ2(t) is fixed, the time-dependent coverages θ1(t) and θ2(t) are the solution of the above equation for I(t) at each experimentally measured data point. It is important to understand that this approach does not force a fit to the starting structure of islands on an incomplete base layer. This method distinguishes directly between LBL growth and S2L growth through the initiation of coverage of a top layer before completion of filling of the base layer in order to account for the observed intensities as a function of deposition.
The single laser shot time-dependent (intra dwell-time) coverages of the individual layers extracted from the SXRD intensities by this two-layer approach are the most important data available from the STO PLD growth experiments. The time-dependent coverages allow determination of the time constants and identification of the particular surface transport processes based on the magnitude and the dependence of the time constants on the growth parameters. The time-dependent coverages shown in Fig. 9.8 resemble a rising staircase. Comparison with the pulsed LBL growth model in Fig. 9.1 (a) reveals that each step is unique and slightly different from the simple model. Similar to the simple models, each coverage step magnified in Fig. 9.11 has two components that are clearly separable; an instantaneous jump that corresponds to a very fast interlayer transport process, and a slow part that occurs during the dwell time between successive laser shots.
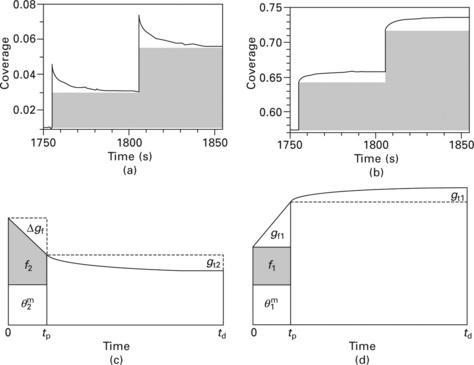
9.11 Pre-coalescence and post-coalesce time-dependent coverages (a) and (b), respectively replotted from Fig. 9.8 for 50 s dwell time show the departure from the shaded steps for pulsed LBL growth. (c) Schematic illustration of pre-coalescence components of interlayer transport: t = 0 expected coverage, actual coverage after fast interlayer transport ∆gf out of the layer is completed at t = tp(the time of plume arrival), thermal interlayer transport gt2 out of the layer is measured at t = td (the dwell time). (d) Schematic illustration of post-coalescence components of interlayer transport: t = 0 expected coverage, actual coverage after fast interlayer transport gf1 into the layer is completed at t = tp’, thermal interlayer transport gt1 into the layer is measured at t = td. For detailed explanation see text.
The subtle differences in the shape of the slow component are indicative of net interlayer transport for a particular shot. These steps can be categorized in three groups based on their shape. The first group of steps that are flat occurs near 0.5 coverage and indicates that no net interlayer transport occurs into or out of the layer near half coverage. The second group of steps has a slightly downward curvature that indicates interlayer transport out of the layer at coverage below 0.5. The third group of steps has a slightly upward curvature that indicates interlayer transport into the growing layer above coverage 0.5. The curvature of the non-flat steps becomes more pronounced with increasing dwell time, indicating increasing interlayer transport with time between successive laser shots. The curvature also increases with increasing growth temperature. Based on the temperature dependence and the sluggish nature of the process during the dwell time we conclude that this component corresponds to thermally driven interlayer transport.
The coverage transients provide a quantitative picture of the closeness of S2L growth in STO to LBL growth. The defining feature of LBL growth is that the single growing layer must be full before a new layer can start growing. Although LBL is not realizable physically it represents a useful benchmark for comparison. Indeed, Fig. 9.8, to be discussed later, shows clearly that LBL growth is not happening in STO PLD growth. The dwell time also plays an important role in determining the quality of LBL growth. For example, Fig. 9.8 shows that when the base layer coverage reaches 0.9 the coverage on the top of a base layer is about 0.3 for a dwell time of 50 s and less than 0.2 for a dwell time of 0.2 s. These trends indicate that PLD growth becomes more like LBL growth as the dwell times become shorter. In connection with this trend, it will be shown below that the thermal interlayer transport component is not essential for PLD film growth.
9.3.4 The crystallization timescale
The crucial question for understanding the mechanism of PLD is what happens during the very fast interlayer transport step. The first approximation for the timescale of this step is the crystallization time. Another advantage of using a third generation synchrotron is that the high brightness permits measurement of the structural changes with the highest time resolution available. The crystallization time refers to the time when a crystalline structure formation can be detected on the growing surface. This initial crystallization represents an upper limit for the combination of surface transport steps that must occur to enable incorporation at the proper lattice site. This measurement is performed using a reflection that has a momentum transfer component parallel to the growing surface. In MBE growth of Ge it was observed that the intensity of the (0 0 ½) specular rod falls immediately after the shutter is opened (Vlieg et al., 1988). In contrast, there was a few seconds’ delay before the intensity started falling in the off-specular reflection after the Ge shutter was opened. This delay is attributed to the time that it takes the first arriving Ge atoms to find the right crystallographic sites for incorporation into the lattice. The delay was found to decrease with increasing substrate temperature indicating the presence of thermally driven surface transport.
The crystallization time is also important for understanding the mechanism of PLD growth. Based on the timescale of crystallization it is possible to determine whether the conventional picture that deposition and growth are separate in PLD is correct. The assumption that these two stages are separable is also the basis for the interpretation of the recovery in some earlier PLD growth experiments using RHEED. The recovery in the RHEED intensity where only the slow thermally driven component was observed was attributed to crystallization of the plume species (Karl and Stritzker, 1992). In our experiments the time delay between the arrival of the plume and crystallization was determined by simultaneously measuring the intensity of the (0 0 ½) specular and the (0 1 ½)off-specular rods of STO. The absence of a measurable time delay between the fast transients for these two rods shown in Fig. 9.12 indicates that crystallization is instantaneous on the timescale of the measurement. The single shot transient data measured with time resolution in the μs range show that the instantaneous drop and jump occur on the same time scale and confirm that crystallization occurred faster than our measurements. It is known from independent measurements that plume arrival also occurs in a few [is (Wood et al, 1997; Sambri et al, 2008). Based on the similar timescales for plume arrival and crystallization we conclude that crystallization occurs during the arrival of the plume, suggesting that the interpretation of the slowest timescale to be crystallization is incorrect. The overlapping of the plume arrival timescale and the crystallization time scale also implies that separation of deposition and crystallization processes requires microsecond or faster pulse deposition timescales.
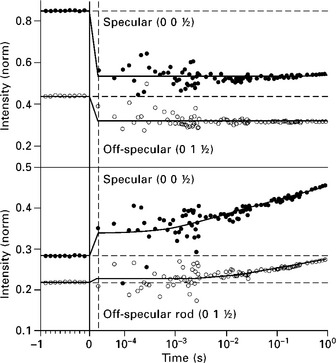
9.12 The measurement of fast transients for the specular (0 0 ½) and off-specular (0 1 ½) rods with ms scale resolution. Note that the data are plotted on a logarithmic scale that spans the time 1 s before and 1 s after the laser shot. The top shows a drop in the first shot following the maximum intensity, and the bottom shows a jump in the first shot following the minimum. The horizontal dashed lines mark the intensity before the laser shot. The vertical solid line marks t = 0 when the laser fires, the vertical dashed line corresponds to tp, the end of the plume arrival time, and the end of the time axis corresponds to td, the dwell time.
9.3.5 Quantitative determination of interlayer transport components
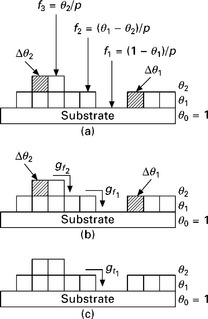
The simultaneous presence of two layers in S2L growth creates three exposed levels (see Fig. 9.10). The expected coverage fn (n = 1–3) for these three surfaces is given by the exposed coverage (θn – θn + 1) and the shot number p needed to deposit one layer. The expected coverage on top of the substrate is the fraction of the pulse that lands into the holes, f1 = (1 – θ1)/p. This material stays in the holes and contributes to the growth of the base (first) layer, ∆θ1. The growth of the layer ∆θn (n = 1,2) is the coverage that is found as crystalline STO immediately following the laser shot. The expected coverage on top of the base layer (islands on the substrate) is given by f2 = (θ1 – θ2)/p. Figures 9.10(b) and 9.10(c) show that f2 consists of three components. The first component stays on top of the layer and contributes to the growth of the top (second) layer ∆θ2. The second component corresponds to the amount transferred by the fast interlayer transport step into the base layer, gf1. And the third component shown in Fig. 9.10(c) is the amount transferred during the dwell time by the slow thermal step into the base layer, gt1 The expected coverage f3 = (θ2 – θ3)/p comes from the fact that the plume also lands on top of the second layer islands. However, as long as the second layer islands are smaller than λ (below coverage 0.6) the third layer cannot start growing and the entire amount must completely transfer down onto the base layer by fast interlayer transport, gf2. The fraction f3 increases with the island size and just before coalescence it is more than half of the incoming plume. The quantitative determination of these interlayer transport fractions is enabled by the separation of the timescales for thermal and fast interlayer transport that is possible because of the four orders of magnitude difference in their magnitude.
The thermal interlayer transport component, gtn (n = 1,2) is the simplest to determine. This amount can be read off directly from the time-dependent coverage plots in Figs 9.8 and 9.11(a) and 9.11(b) as the difference between the coverages corresponding to the slow stage at the end (td) and the beginning of the dwell time (tp). A positive value means that the material transfers into the layer and a negative value means that it transfers out of the layer. The fast interlayer transport component, gfn (n = 1, 2) is also straightforward to determine. As already shown, the expected coverage fn (n = 1–3) of the particular layer after the laser shot (θm + 1) shown in Figs 9.11(c) and 9.11(d) at t = 0 is calculated from the known coverages before laser shot m, θm. The actual coverage determined immediately after the laser shot t = tp is different because fast interlayer transport already occurred before the measurement was performed. The difference between the expected coverage and the actual coverage (at the beginning and the end of the slanted segment in Figs 9.11(c) and 9.11(d) corresponds to the fast interlayer transport fraction for that particular laser shot.
After all the interlayer transport components are determined, the growth of the layer ∆θn (n = 1,2) is computed depending on whether the layer is in the pre-coalescence stage or in the post-coalescence stage. In the pre-coalescence stage the net fast interlayer transport ∆gf2 = gf2 – gf1 is first negative (out of the layer). With increasing coverage it turns positive (into the layer), and in the post coalescence stage fast interlayer transport ∆gf1 = gf1 always occurs into the layer. As would be expected, the growth of the layer mirrors the trends in fast interlayer transport. In the pre-coalescence stage the growth of the layer ∆θ2 = f2 + gf2 – gf1 consists only of the material that is left behind after the fast interlayer transport out of the layer was completed. In the post-coalescence stage the growth of the layer ∆θ = f1 + gf1 has two components. The first component is the fraction deposited directly into the holes (f1) and the second component is the material that transferred into the layer by fast interlayer transport. Note that the slow interlayer transport component does not figure in the growth of the layer (∆θn) calculations because the fast crystallization implies that the growth is complete at the end of the plume arrival, tp.
The entire PLD growth of STO is summarized by the plots in Fig. 9.13. Because the shape of the time-dependent coverages depends on the initial coverage, the magnitudes of the fast interlayer transport gfn, the growth of the layer ∆θn, and the thermal interlayer transport gtn that are derived from the time-dependent coverages will also be coverage-dependent. The first plot Fig. 9.13(b) shows the fast interlayer transport as a function of the number of laser shots. These coverage values are normalized such that it takes 10 shots (p = 1/10) to deposit 1 u.c. of STO. Negative values indicate transport out of the layer and positive values designate transport into the layer. Although, only the values for one growing layer are plotted, these plots are best understood by making a mental reference to the coverage of the second growing layer (see Fig. 9.8) for convenience replotted in Fig. 9.13(a), and remembering that complete filling of a layer occurs over time that corresponds to the deposition of two new layers. The time-dependent coverage data in Figs 9.8 and 9.13(a) show that the growing layer is always in communication with two other layers. Below 0.5 coverage the communication is with the layer below (base layer). Communication with the second (top) layer is established above 0.5 coverage when a new layer nucleates on top of the growing layer after the base layer is filled.
9.13 (a) The coverages of three successive layers for 50 s dwell time are replotted from Fig. 9.8 to aid understanding this figure. (b) Fast interlayer transport, (c) growth of the layer, and (d) thermal interlayer transport plotted as a function of the number of laser shots for 0.2 and 50 s dwell times. For detailed explanation see text.
The coverage of the base layer just before coalescence is a convenient reference point for the zero of the coverage axis. At this coverage λ is still smaller than l, the length scale required for nucleation of a new layer, and the coverage of the top layer must be zero, meaning that complete interlayer transfer out of the layer (largest negative value) occurs. With the next shot coalescence is reached and new islands that nucleate on top reduce the amount of material available for interlayer transport out of the layer. With the following shots the islands are growing larger, slowing down further interlayer transport out of the layer. As the base layer approaches full coverage there are fewer holes remaining and interlayer transfer approaches zero. With completion of the base layer interlayer transport can occur only into the top layer and the value turns positive and increases with subsequent shots until coalescence is reached. After coalescence, interlayer transport into the layer slows down as the number of holes into which interlayer transport can occur decreases rapidly when approaching full coverage.
The second plot Fig. 9.13(c) shows that the growth-of-a-layer ∆θn as a function of the number of laser shots mirrors nicely the fast interlayer transport plot. ∆θ2 reaches a maximum when the base layer is near filling up and the top layer coverage is ~ 0.4. Because effectively there is only one layer open here, there can be little or no interlayer transport and all material must go into ∆θ2. However, because of the two layer nature of growth a laser shot going 100% in a single layer is never observed. Even at the maximum (near 0.4 coverage) less than 90% of the laser shot contributes to the growth of a single layer. Past the maximum, ∆θ2 develops a downward trend because the increasing layer coverage θ2 effectively blocks the surface and decreases the exposed coverage (θ1−θ2) and with that the fraction f2 of the plume that is directly contributed to ∆θ2.
The behavior of the slow thermally driven interlayer transport component shown in Fig. 9.13(d) is the easiest to understand. A distinctive feature of this plot is that it clearly depends on the dwell time. The amount of material transferred is determined from the data in Fig. 9.8 to increase with increasing dwell time from about 5% of a single shot for 0.2 s dwell time to about 20% of a single shot for 50 s dwell time. This behavior represents clear confirmation of the thermal nature of this interlayer transport component. The thermal interlayer transport component corresponds to transport of already crystallized STO unit cells. The plot in Fig. 9.13(d) shows that the transport out of the layer below 0.5 coverage is balanced by the transport into the layer above 0.5 coverage.
9.3.6 Diffuse scattering
Another advantage of using synchrotron X-rays is that they provide sufficient intensity to perform time-resolved measurements of the very weak diffuse scattering component that originates from incoherent fluctuations in local order and lateral organization (Fuoss et al., 1992; Robinson et al., 1996). Diffuse scattering measurements are performed by using an area detector, such as a CCD camera to capture the entire diffraction profile including both the sharp central peak and the broad diffuse scattering. Presented in the form of two-dimensional diffraction intensity maps shown in Fig. 9.14, diffuse scattering data provide information on the size of islands as illustrated by the change of the q (nm− 1) distribution of intensity as a function of deposition given in terms of the number of laser shots. The variations in the grayscale shades are used to aid visualization of the intensity changes. These two-dimensional diffraction maps contain the complete information about the formation and the evolution of the surface structure during STO film growth. The vertical line that cuts through the diffraction maps at q = 0 describes the growth intensity oscillations of the sharp central peak discussed previously. The larger elliptical shape features appearing at q ≠ 0 on both sides of the central peak correspond to diffuse scattering.
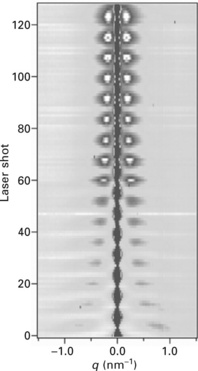
9.14 The complete diffraction intensity map from growth of 17 u.c. of STO obtained by measuring the (0 0 diffraction profile using a CCD for growth at 10 s dwell time at 680 °C. The spine of the plot corresponds to the growth intensity oscillations of the specular beam. The side lobes at q ≠ 0 on both sides give the diffuse scattering that is indicative of a well-developed correlation between the islands.
The diffuse scattering describes the spatial distribution of the islands on the growing surface (Fuoss et al, 1992; Alvarez et al., 1998; Ferguson et al, 2009). The presence of the diffuse side lobes indicates that a well-defined correlation exists between the islands. The q dependence of these features given by ∆q = 2π/L describes a characteristic length scale in terms of L, the correlation length that corresponds to the island separation ![]() in the pre-coalescence stage of the growth. Therefore, the shifting of q of the diffuse side lobes toward q = 0 correspond to increasing island sizes. From time-dependent measurements it is estimated that these changes are slow and are in the timescale of seconds.
in the pre-coalescence stage of the growth. Therefore, the shifting of q of the diffuse side lobes toward q = 0 correspond to increasing island sizes. From time-dependent measurements it is estimated that these changes are slow and are in the timescale of seconds.
The relationship between the central peak and the diffuse side lobes in layer filling during growth of the first three layers is illustrated in Fig. 9.15. As Fig. 9.14 shows the diffuse scattering signal is weak and distributed over a wide q range when the islands are very small at the onset of growth. Less noisy data are obtained by using δ-scans with a point detector. As expected, the plot shows that the intense central peak and the diffuse scattering are oscillating out of phase. The first appearance of the weak diffuse scattering component is observed at q ≅ 0.15 after the first laser shot. The island size estimated from ∆q = 2π/r is r = 5 nm. An increasing island density after the second laser shot would be manifested as an increase in q. Simple layer filling at a fixed island density with increasing island sizes would result only in the change of the intensity of the diffuse side lobes located at a fixed q. At a full layer the diffuse scattering should vanish and nucleation of the next layer would occur for a q equal or close to the value for the first shot. Instead the plots in Figs 9.14 and 9.15 show that q decreases continuously with subsequent laser shots. This behavior is unexpected for simple layer filling and indicates that the island size is increasing during growth. This trend is characteristic of thermally driven processes such as island ripening. It was confirmed that q shifts to smaller values quicker for longer dwell times at a fixed temperature, and for increasing temperature at a fixed dwell time.
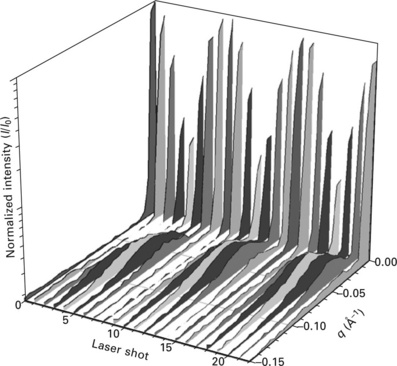
9.15 Single shot data obtained using δ-scans with a point detector showing the relative intensity of the specular and diffuse intensity peaks during growth of the first 3 u.c. of STO. The diffuse scattering oscillates out of phase with the specular intensity during layer filling.
The shifting of q toward smaller values even when deposition of a new layer – referenced to the maximum intensity of the specular peak – is started, indicates the absence of independent renucleation on a flat growth surface. The dependence of the q for a newly growing layer on the q of the filling layer suggests that some type of communication exists between these two layers. This memory effect between the growth of two successive layers is a confirmation of the simultaneous growth of two layers in the S2L growth mode as concluded from the time-dependent coverage evolution. The most likely explanation for the existence of the memory effect is that interlayer transport makes the growth of two successive layers interdependent on each other. A careful examination of the scattering maps reveals that after the first few layers the diffuse scattering between two successive layers never fully vanishes in agreement with the conclusion that a flat growing surface is never again restored.
9.4 Future trends
The SXRD studies reveal new details of the PLD growth mechanism, leading to the conclusion that the potential of PLD is currently underutilized. The most important of these findings is that the actual film growth of STO in PLD – where growth is equivalent to initial crystallization confirmed by the first detectable presence of the crystalline STO phase – occurs on a much faster timescale than previously thought. The crystallization time in PLD as the upper limit for combination of surface transport needed for the arrival of the growth species at the proper crystallographic sites was determined to occur faster than it can be measured with μs scale time resolution. Using diffuse scattering measurements it was shown that a second much slower step that corresponds to continuous island ripening occurs throughout the growth process. The island ripening process occurs by thermally driven conversion of already crystalline smaller STO islands into larger ones. The formation of larger islands (by long dwell times) is not only unnecessary for PLD, it is actually detrimental to LBL growth because it reduces the nucleation density and favors premature nucleation of the second layer and eventually acceleration of the interface broadening and 3D growth. Longer dwell times and higher substrate temperatures increase the impact of thermal processes and diminish the non-equilibrium effects of PLD growth.
The S2L growth mode will persist indefinitely during high quality growth and represents the highest perfection growth mode physically possible by any growth method. Post-growth AFM characterizations show that STO films grown in the S2L growth mode reveal no interface broadening even after the growth of more than 100 u.c. thick STO. In terms of a kinetic picture it is now clear why PLD is so similar to LBL growth. Although the presence of the second layer certainly interferes and slows down fast interlayer transport into the base layer, it appears that interlayer transport is sufficiently effective to enable a ‘stretched out’ LBL growth mode to complete one full layer over two periods.
It is appealing to think about a ‘pure’ PLD growth process in which the thermal component is suppressed and the surface smoothing effects of energetic deposition (non-equilibrium growth) from the plume are fully preserved. The first step toward realizing such a process is to reduce the dwell time. An added benefit of eliminating or reducing the dwell times is an increase in the average growth rate that is presently used with PLD growth conditions not much higher than typical MBE growth rates of about 1 ML/ min. It is concluded that an effective growth manipulation scheme for PLD film growth (Koster et al., 1999) must be based on maximizing the role of the fast interlayer transport step and suppressing the contribution from the sluggish thermal interlayer transport component during the dwell time, by reducing the substrate temperature, or the dwell time, or a combination of the two.
The growth kinetics picture of STO PLD that emerges from SXRD data is part of a general framework that is also applicable in homo-and heteroepitaxial growth of other perovskites. The present studies of kinetics from single laser shot deposition show that departure from LBL growth in homoepitaxy happens as a consequence of impeded fast interlayer transport. This is the factor that is most likely to adversely affect LBL growth in heteroepitaxy as well. But the mechanisms through which the interactions between the dissimilar atoms of the substrate and the film can alter the rate of interlayer transport in layer filling at the onset of growth are not known. The macroscopic manifestation of these interactions includes 3D growth, strain, chemical inhomogeneity, and phase change that fundamentally alter the properties of the near-interface region. Manipulating the growth kinetics becomes an indispensible tool in heteroepitaxial growth because it provides a way to open film growth pathways that are closed by thermodynamics in near-equilibrium growth methods. The special importance that the growth of the first layer plays in homoepitaxial kinetics becomes magnified in heteroepitaxy by the fact that it is both kinetically and structurally different from the rest of the layers that make up the film. Direct determination of interlayer transport rates from the time-dependent coverages, island size distributions, and island size evolution from diffuse scattering can be used for understanding how interface sharpness will be affected by island nucleation and island growth governed by the additional factors that are present in heteroepitaxial growth.
Acknowledgment
Research sponsored by the Materials Sciences and Engineering Division, Basic Energy Sciences (BES), US Department of Energy (DOE), and performed in part at the Advanced Photon Source, a DOE-BES user facility.
References
Adamovic, D., Chirita, V., Munger, E.P., Hultman, L., Greene, J.E. Kinetic pathways leading to layer-by-layer growth from hyperthermal atoms: a multibillion time step molecular dynamics study. Physical Review B. 2007; 76:115418–115425.
Als-Nielsen, J., McMorrow, D. Elements of modern x-ray physic. New York: John Wiley; 2001.
Alvarez, J., Lundgren, E., Torrelles, X., Ferrer, S. Determination of scaling exponents in Ag(100) homoepitaxy with X-ray diffraction profiles. Physical Review B. 1998; 57:6325–6328.
Aziz, M.J. Film growth mechanisms in pulsed laser deposition. Applied Physics A. 2008; 93:579–587.
Blank, D.H.A., Rijnders, G.J.H.M., Koster, G., Rogala, H. In situ monitoring by reflective high-energy electron diffraction during pulsed-laser deposition. Applied Surface Science. 1999; 138–139:17–23.
Braun, W. Applied RHEED: reflection high-energy electron diffraction during crystal growth. Berlin, Heidelberg: Springer-Verlag; 1999.
Braun, W., Ploog, K.H. In situ studies of epitaxial growth by synchrotron X-ray diffraction. Surface Review and Letters. 2006; 13:155–166.
Braun, W., Daweritz, L., Ploog, K.H. Origin of electron diffraction oscillations during crystal growth. Physical Review Letters. 1998; 80:4935–4938.
Charlton, G., Brennan, S., Muryn, C.A., McGrath, R., Norman, D. Surface relaxation of SrTiO3 (001). Surface Science Letters. 2000; 457:L376.
Chern, M.Y., Gupta, A., Hussey, B.W., Shaw, T.M. Reflection high-energy electron diffraction intensity monitored homoepitaxial growth of SrTiO3 buffer layers by pulsed-laser deposition. Journal of Vacuum Science and Technology A. 1993; 11:637–641.
Christen, H.M., Eres, G. Recent advances in pulsed-laser deposition of complex oxides. Journal of Physics: Condensed Matter. 2008; 20:264005.
Clarke, S., Vvedensky, D.D. Origin of reflection high-energy electron-diffraction intensity oscillations during molecular-beam epitaxy: a computational modeling approach. Physical Review Letters. 1987; 80:2235–2238.
Cohen, P.I., Petrich, G.S., Pukite, P.R., Whaley, G.J., Arrott, A.S. Birth-death models of epitaxy: I. Diffraction oscillations from low index surfaces, Surface Science. 1989; 216:222–248.
Dagotto, E. When oxides meet face to face. Science. 2007; 318:1076–1077.
Doolittle, W.A., Carver, A.G., Henderson, W. Molecular beam epitaxy of complex metal-oxides: where have we come, where are we going, and how are we going to get there? Journal of Vacuum Science and Technology B. 2005; 23:1272–1276.
Ehrlich, G., Hudda, F.G. Atomic view of surface self-diffusion: tungsten on tungsten. Journal of Chemical Physics. 1966; 44:1939.
Eres, G., Tischler, J., Yoon, M., Larson, B., Rouleau, C., Lowndes, D., Zschack, P. Time-resolved study of SrTiO3 homoepitaxial pulsed-laser deposition using surface X-ray diffraction. Applied Physics Letters. 2002; 80:3379–3381.
Evans, J.W., Thiel, P.A., Bartelt, M.C. Morphological evolution during epitaxial thin film growth: formation of 2D islands and 3D mounds. Surface Science Reports. 2006; 61:1–128.
Evans-Lutterodt, K.W., Tang, M.T. Angle calculations for a ‘2 + 2’ surface X-ray diffractometer. Journal of Applied Crystallography. 1995; 28:318.
Farrow, R.F.C. Molecular beam epitaxy: Applications to key materials. Park Ridge: Noyes Publications; 1995.
Feidenhans’l, R. Surface structure determination by X-ray diffraction. Surface Science Reports. 1989; 10:105–188.
Ferguson, J.D., Arikan, G., Dale, D.S., Woll, A.R., Brock, J.D. Measurements of surface diffusivity and coarsening during pulsed laser deposition. Physical Review Letters. 2009; 103:256103.
Fleet, A., Dale, D., Suzuki, Y., Brock, J.D. Observed effects of a changing step-edge density on thin-film growth dynamics. Physical Review Letters. 2005; 94:036102.
Fuoss, P.H., Brennan, S. Surface sensitive X-ray scattering. Annual Review of Materials Science. 1990; 20:365–390.
Fuoss, P.H., Kisker, D.W., Lamelas, F.J., Stephenson, G.B., Imperatori, P., Brennan, S. Time-resolved X-ray scattering studies of layer-by-layer epitaxial growth. Physical Review Letters. 1992; 69:2791–2794.
Giacovazzo, G., Monaco, H.L., Viterbo, F., Gilli, G., Zanotti, G., Catti, M. Fundamentals of crystallography. Oxford: Oxford University Press; 2011.
Gorbenko, O.Y., Samoilenkov, S.V., Graboy, I.E., Kaul, A.R. Epitaxial stabilization of oxides in thin films. Chemistry of Materials. 2002; 14:4026–4043.
Herger, R., Willmott, P.R., Bunk, O., Schleputz, C.M., Patterson, B.D., Delley, B. Surface of strontium titanate. Physical Review Letters. 2007; 98:076102.
Hinnemann, B., Hinrichsen, H., Wolf, D.E. Unusual scaling for pulsed laser deposition. Physical Review Letters. 2001; 87:135701.
Huijben, M., Brinkman, A., Koster, G., Rijnders, G., Hilgenkamp, H., Blank, D.H.A. Structure–property relation on SrTiO3/LaAlO3 interfaces. Advanced Materials. 2009; 21:1665–1677.
Ichimiya, A., Cohen, P.I.Reflection high-energy electron diffraction. Cambridge: cambrige university Press, 2004.
Ingle, N.J.C., Yuskauskas, A., Wicks, R., Paul, M., Leung, S. The structural analysis possibilities of reflection high energy electron diffraction. Journal of Physics D: Applied Physics. 2010; 43:133001.
Jacobsen, J., Cooper, B.H., Sethna, J.P. Simulations of energetic beam deposition: from picoseconds to seconds. Physical Review B. 1998; 58:15847–15865.
Jang, H.W., Felker, D.A., Bark, C.W., Wang, Y., Niranjan, M.K., Nelson, C.T., Zhang, Y., Su, D., Folkman, C.M., Baek, S.H., Lee, S., Janicka, K., Zhu, Y., Pan, X.Q., Fong, D.D., Tsymbal, E.Y., Rzchowski, M.S., Eom, C.B. Metallic and insulating oxide interfaces controlled by electronic correlations. Science. 2011; 331:886–889.
Joyce, B.A., Joyce, T.B. Basic studies of molecular beam epitaxy – past, present and some future directions. Journal of Crystal Growth. 2004; 264:605–619.
Kaganer, V.M. Crystal truncation rods in kinematical and dynamical X-ray diffraction theories. Physical Review B. 2007; 75:245425.
Karl, H., Stritzker, B. Reflection high-energy electron diffraction oscillations modulated by laser-pulse-deposited YBa2Cu3O7-x. Physical Review Letters. 1992; 69:2939–2942.
Kawasaki, M., Takahashi, K., Maeda, T., Tsuchiya, R., Shinohara, M., Ishiyama, O., Yonezawa, T., Yoshimoto, M., Koinuma, H. Atomic control of the SrTiO3 crystal surface. Science. 1994; 266:1540.
Korte, U., Maksym, P.A. Role of the step density in reflection high-energy electron diffraction: questioning the step density model. Physical Review Letters. 1997; 78:2381–2384.
Koster, G., Kropman, B.L., Rijnders, G.J.H.M., Blank, D.H.A., Rogalla, H. Quasi-ideal strontium titanate crystal surfaces through formation of strontium hydroxide. Applied Physics Letters. 1998; 73:2920–2922.
Koster, G., Rijnders, G.J.H.M., Blank, D.H.A., Rogalla, H. Imposed layer-by-layer growth by pulsed laser interval deposition. Applied Physics Letters. 1999; 74:3729–3731.
Lam, P.-M., Liu, S.J., Woo, C.H. Monte Carlo simulation of pulsed laser deposition. Physical Review B. 2002; 66:045408.
Larsson, M.I., Ni, W.X., Hansson, G.V. Manipulation of nucleation by growth rate modulation. Journal of Applied Physics. 1995; 78:3792.
Lee, H.N., Christen, H.M., Chisholm, M.F., Rouleau, C.M., Lowndes, D.H. Strong polarization enhancement in asymmetric three-component ferroelectric superlattices. Nature. 2005; 433:395–399.
Lippmaa, M., Nakagawa, N., Kawasaki, M., Ohasi, S., Koinuma, H. Growth mode mapping of SrTiO3 epitaxy. Applied Physics Letters. 2000; 76:2439–2441.
Lowndes, D.H., Geohegan, D.B., Puretzky, A.A., Norton, D.P., Rouleau, C.M. Synthesis of novel thin-film materials by pulsed laser deposition. Science. 1996; 273:898–903.
Mannhart, J., Schlom, D.G. Oxide interfaces – an opportunity for electronics. Science. 2010; 327:1607–1611.
Michely, T., Krug, J. Islands, mounds and atoms, Springer Series in Surface Sciences; vol 42. Springer-Verlag, Berlin, 2004.
Ohnishi, T., Shibuya, K., Lippmaa, M., Kobayashi, D., Kumigashira, H., Oshima, M., Koinuma, H. Preparation of thermally stable TiO2-terminated SrTiO3 (100) substrate surfaces. Applied Physics Letters. 2004; 85:272–274.
Ohtomo, A., Hwang, H.Y. A high-mobility electron gas at the LaAlO3/SrTiO3 heterointerface. Nature. 2004; 427:423–426.
Pimpinelli, A., Villan, J. Physics of crystal growth. Cambridge: Cambridge University Press; 1998.
Reiner, J.W., Walker, F.J., Ahn, C.H. Atomically engineered oxide interfaces. Science. 2009; 323:1018–1019.
Rijnders, G., Blank, D.H.A. Real-time monitoring by high-pressure RHEED during pulsed laser deposition, in Thin Films and Heterostructures for Oxide Electronics, ed. New York, Springer: S.B. Ogale; 2005.
Robinson, I.K. Crystal truncation rods and surface roughness. Physical Review B. 1986; 33:3830–3836.
Robinson, I.K., Tweet, D.J. Surface X-ray-diffraction. Reports on Progress in Physics. 1992; 55:599–651.
Robinson, I.K., Whiteaker, K.L., Walko, D.A. Cu island growth on Cu(110). Physica B. 1996; 221:70–76.
Rosenfeld, G., Poelsema, B., Comsa, G. Epitaxial growth modes far from equilibrium, p. 66 in Growth and properties of ultrathin epitaxial layers. In King D.A., Woodruff D.P., eds.: The chemical physics of solid surfaces, 8, Amsterdam: Elsevier, 1997.
Saldin, D.K., Shneerson, V.L. Direct methods for surface crystallography. Journal of Physics: Condensed Matter. 2008; 20:304208.
Sambri, A., Amoruso, A., Wang, X., Miletto Granozio, F., Bruzzese, R. Plume propagation dynamics of complex oxides in oxygen. Journal of Applied Physics. 2008; 104:053304.
Schlom, D.G., Haeni, J.H., Lettieri, J., Theis, C.D., Tian, W., Jiang, J.C., Pan, X.Q. Oxide nano-engineering using MBE. Materials Science and Engineering B. 2001; 87:282–291.
Schlom, D.G., Chen, L.-Q., Pan, X., Schmehl, A., Zurbuchen, M.A. A thin film approach to engineering functionality into oxides. Journal of American Ceramic Society. 2008; 91:2429–2454.
Schmid, M., Lenauer, C., Buchsbaum, A., Wimmer, F., Rauchbauer, G., Scheiber, P., Betz, G., Varga, P. High island density in pulsed laser deposition: causes and implications. Physical Review Letters. 2009; 103:076101.
Schwoebel, R.L., Shipsey, E.J. Step motion on crystal surfaces. Journal of Applied Physics. 1966; 37:3682.
Shin, B., Aziz, M.J. Kinetic-energy induced smoothening and delay of epitaxial breakdown in pulsed-laser deposition. Physical Review B. 2007; 76:085431.
Sutton, A.P., Balluffi, W. Interfaces in crystalline materials. Oxford: Clarendon Press; 1995.
Taylor, M.E., Atwater, H.A. Monte Carlo simulations of epitaxial growth: comparison of pulsed laser deposition and molecular beam epitaxy. Applied Surface Science. 1998; 127–129:159.
Tersoff, J., Dernier van der Gon, A.W., Tromp, R.M. Critical island size for layer-by-layer growth. Physical Review Letters. 1994; 72:266–269.
Tischler, J.Z., Eres, G., Larson, B.C., Rouleau, C.M., Zschack, P., Lowndes, D.H. Nonequilibrium interlayer transport in pulsed laser deposition. Physical Review Letters. 2006; 96:226104.
Tromp, R.M., Hannon, J.B. Thermodynamics of nucleation and growth. Surface Review and Letters. 2002; 9:1565–1593.
van der Vegt, H.A., van Pinxteren, H.M., Lohmeier, M., Vlieg, E., Thornton, J.M.C. Surfactant induced layer-by-layer growth of Ag on Ag (111). Physical Review Letters. 1992; 68:3335–3338.
Vasco, E., Sacedon, J.L. Role of cluster transient mobility in pulsed laser deposition-type growth kinetics. Physical Review Letters. 2007; 98:036104.
Vlieg, E., Dernier van der Gon, A.W., van der Veen, J.F., Macdonald, J.E., Norris, C. Surface X-ray scattering during crystal growth: Ge on Ge(111). Physical Review Letters. 1988; 61:2241–2244.
Vlieg, E., Lohmeier, M., van der Vegt, H.A. Surface X-ray crystallography of growing crystals and interfaces. Nuclear Instruments and Methods Research B. 1995; 97:358–363.
Warrender, J.M., Aziz, M.J. Kinetic energy effects on morphology evolution during pulsed laser deposition of metal-on-insulator films. Physical Review B. 2007; 75:085433.
Willmott, P.R. Deposition of complex multielemental thin films. Progress in Surface Science. 2004; 76:163–217.
Willmott, P.R., Huber, J.R. Pulsed laser vaporization and deposition. Reviews of Modern Physics. 2000; 72:315–328.
Willmott, P.R., Herger, R., Schlepütz, C.M., Martoccia, D., Patterson, B.D. Energetic surface smoothing of complex metal-oxide thin films. Physical Review Letters. 2006; 96:176102.
Wood, R.F., Leboeuf, J.N., Puretzky, A.A., Geohegan, D.B. Dynamics of plume propagation and splitting during pulsed-laser ablation. Physical Review Letters. 1997; 79:1571–1574.
Woodruff, D.P., Delchar, T.A. Modern techniques of surface-science. Cambridge: Cambridge University Press; 1994.
Zangwill, A. Physics at surfaces. Cambridge, New York: Cambridge University Press; 1988.
Zhang, Z., Lagally, M. Atomistic processes in the early stages of thin-film growth. Science. 1997; 276:377.
Zinke-Allmang, M. Phase separation on solid surface: nucleation, coarsening and coalescence kinetics. Thin Solid Films. 1999; 346:1.
Zubko, P., Gariglio, S., Gabay, M., Ghosez, P., Triscone, J.-M. Interface physics in complex oxide heterostructures. Annual Review of Condensed Matter Physics. 2011; 2:141–165.