
The .NET library source code has already been released. This gives you a chance to locate and debug the actual source code that has been used to build the library that you are using. This is very useful as the code that has been downloaded from the server will contain a lot of comments, which will help you with the internals of the library that we are using.
Source code debugging is another technique for .NET library debugging. Let's take a look at how you can use Visual Studio to step into Microsoft Source for the .NET library:
- To debug your code with the .NET library source code, you first need to go to Tools | Options and then navigate to Debugging | General.
- Turn off Enable Just My Code.
- Turn on Enable source server support, as shown in the following screenshot:
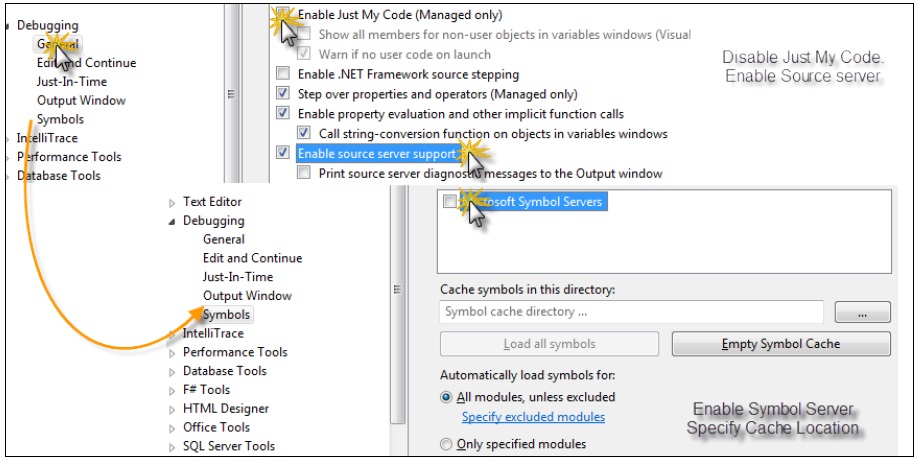
- Now, in the Symbols tab of the window, you need to specify the cache server location where it can get the program debug information.
- Set the symbol file location to
http://referencesource.microsoft.com/symbols. - Set the cache location where the symbols will get downloaded as soon as you use it during debugging. You need to make sure that the location is accessible from your user account.
- You can select a list of options for which the reference server will be connected to the symbols. For best results, we should select the modules that you need to load symbols to.
- You can also load all the symbols once at this time and use them during debugging.
- You can now start debugging.
Microsoft actually maintains a number of servers that hold static files. These files are available based on the checksum. Once the symbols are loaded onto your machine, the reference server can be used to download the appropriate source file directly while you are debugging your application and press Step Into to a method that is defined in the .NET class library. As we already know, a program database (PDB) file holds all the information about line numbers, location, and even the checksum of the file. Visual Studio invokes a request to a file by sending this information available in the symbol files and downloads the appropriate file.
Let's start our sample application and place a breakpoint in the first line of the code. Now run the project until the breakpoint is hit. Open Call Stack, right-click on MSCorlib, and select Load Symbols. This will download the symbols of MScorlib, which will take a considerable amount of time. Once the symbols are downloaded, you can start debugging your application.
You can see that when the download is complete, the Call Stack frames turn dark because all the line numbers are now available. Now you can press F11 to step into the library code, say, for instance, Console.WriteLine.
You will be prompted with a license agreement when you choose Call Stack for the first time. You can even use Call Stack to move back and forth to different call statements.
Tip
You cannot evaluate some of the variables and values while debugging as .NET bits that are shipped with the .NET framework are built in the optimized mode. Putting a break just above the line can show the content of the code.
Don't expect the source of all .NET dlls to be available. Most of the dlls are already made available and as time goes, it will increase the numbers. If you see that Load Symbols is disabled or the PDB isn't loading, then you should consider that the dll is not available.