
There is a KNIME Labs plug-in named KNIME Datageneration (http://tech.knime.org/datageneration). It gives support to generate values from different distributions for existing rows to new columns:
- Random Number Assigner: It supports uniform distribution
- Gaussian Distributed Assigner: It supports Gaussian distribution
- Beta Distributed Assigner: It supports beta distribution
- Gamma Distributed Assigner: It supports gamma distribution
To generate rows with numeric content, the most obvious node is Data Generator. It generates data for clusters of normally distributed data for various dimensions with different cluster centers on the [0,1] interval. It also generates the cluster labels.
To generate empty rows for existing tables, the Add Empty Rows node gives options. You might also want to create a table specification before you add (new or additional) empty rows. This can be done using the Create Table Structure or the Table Creator nodes. Both are manual, but if you have a tab/comma-separated file with the header, it might be easier to read that file using the File Reader node.
If you have a table with empty rows, you can use the Java Snippet node to generate sequences or grids to that table. You can see the idea in action in the workflow from the GenerateGrid.zip file.
The Time Generator node allows you to generate rows with equidistant values with a single date column between two dates.
You can also use the Empty Table Creator node from the data generation plug-in to generate empty rows without columns
The SMOTE node fills the spare parts of a class of rows with new rows. It uses an algorithm to generate similar rows to previously existing ones in a class based on their numeric attributes.
We created a workflow which demonstrates how we can generate a grid with equidistant points in each dimension. In this section, we will introduce some of the details of this workflow. You can import the workflow from the GenerateGrid.zip file.
First of all, you have to set the column structure and the parameters of the grid. The column names should match in the Parameters node's colName column and the Empty structure node columns.
Description of the Parameters node columns are as follows:
colName: The name of the column to be generatednumberOfPoints: Specifies the number of points that will be generated for that dimension (including end points)minValue,maxValue: Specifies the two end points of the closed intervals
In the Generate Grid meta node, first (Java Snippet and helper columns), we generate a few auxiliary values. The product of the number of points will be used to find out how many rows should be generated, while the modulo will be used to compute the row index's range for the column.
Next, we find out how many rows should be generated, by sorting in descending order, based on the cumulativeProduct column and then converting the first row to a workflow variable.
Using this variable, we add new empty rows to the table (Add Empty Rows).
Now, we have to create an expression using the String Manipulator node, for each parameter row, to generate the Java snippet formula. Fortunately, we have the ROWINDEX information available when we use the $$ROWINDEX$$ expression. Here is the whole expression of the node:
join("return ($$ROWINDEX$$ / ", string($modulo$), " % ", string($numberOfPoints$), " / (", string($numberOfPoints$), " - 1.0)) * (", string($maxValue$), " - ", string($minValue$), ") + ", string($minValue$), ";")It could have been easier if we used the Java Snippet node, but because this is just concatenating few values, it was a more consistent option, and we can use this opportunity to introduce a few String Manipulator functions. The join function just concatenates its arguments, but it assumes all of them are textual. For this reason, our numeric values are converted to text using the string function.
An example expression might look like the following after the execution of the function:
return ($$ROWINDEX$$ / 7 % 11 / (11 - 1.0)) * (30.0 - 10.0) + 10.0;
The number 7 is the modulo value, 11 is the number of points (n), and 1.0 is an adjustment constant (the length of the [0, n-1] interval is n-1, which is the reason for this constant), which also converts the expression to double, but 30.0 and 10.0 are the maximum and minimum end points of the interval of the current column.
The remaining part of the meta node is a loop over the extended parameters data table (TableRow To Variable Loop Start); however, the content is not collected in new rows for the consecutive runs, but in the columns (because we used the Loop End (Column Append) looping node). We have to keep only the target column from the original table, else the column names would generate conflict during the loop end node's column append step, and these would be renamed. For this reason, we used the Column Filter node. The final step within the loop is generating the value we want in the target column for the specified rows using the Java Snippet (Simple) node.
In the end, you get a grid which looks like the following screenshot (the y-z projection of it):
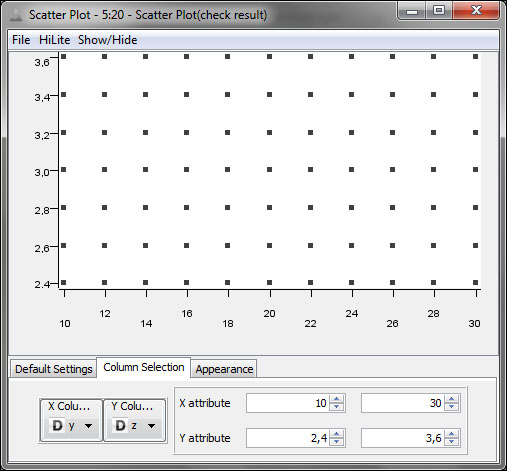
A generated grid with 11 data points from 10 to 30 for y values and 7 data points from 2.4 to 3.6 on the z axis.
The final node of the workflow is the Scatter Plot node to visualize (and check) the results.