
Chapter 12. Monitoring jobs
- Understanding the job metadata managed by Spring Batch
- Using Spring Batch objects to interact with the job metadata
- Monitoring jobs
In the real world, errors occur when running batch jobs. Batch jobs exchange data between different information systems and tools, and it’s not always easy to guarantee consistency among these systems. Detecting job errors is more difficult because jobs don’t require user interaction during execution. Detecting errors is also more challenging because applications generally execute batch jobs in the background.
In some cases, rerunning batch jobs is enough to solve problems, such as when a system like a database is temporarily down. When errors are caused by bad data, running the batch job again won’t solve the problem. Because batch jobs run mainly in the background, receiving notifications when errors occur is critical. How do you solve this problem? You provide support in your application for batch monitoring and management.
Batch monitoring tracks batch job executions. Spring Batch makes it possible to monitor a job because it collects data on job and step executions and saves it to a database. Spring Batch provides classes to access the database and acts as the foundation for monitoring tools.
In this chapter, we cover what monitoring is and how to monitor job executions in Spring Batch. We then go through the different ways to monitor batch job executions as supported by the job repository database. First, let’s see what monitoring is.
12.1. Introducing monitoring
In the scope of computer science, the word monitoring is used in different contexts: network, system, and website monitoring, for example. In all cases, monitoring aims to detect problems automatically and notify administrators through dedicated consoles and applications. This is a best practice used to detect errors that may occur in an application. For Spring Batch applications, this means detecting errors in jobs and notifying administrators.
In this section, we show what monitoring looks like at a high level and see its function in the context of batch job executions.
12.1.1. Monitoring overview
Before we get into the benefits of monitoring, let’s first look at a high-level example by monitoring a web application. The goal is to make sure the application is reachable and that it responds to requests within a given time limit. Figure 12.1 depicts monitoring a web application.
Figure 12.1. Monitoring a web application and checking its availability
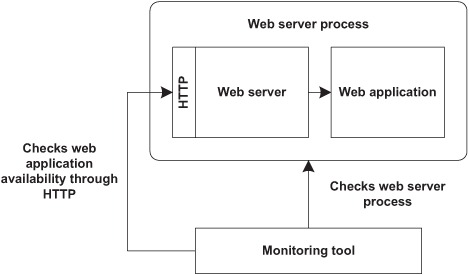
For this use case, you can imagine a monitoring tool that checks that the web server process is up, the web application is available through HTTP, and the application responds to requests within a given time limit. This tool displays its results through a web page that it updates periodically and notifies administrators via email when problems occur.
A monitoring tool has two main features: detection and notification. The tool detects job execution errors and automatically sends notifications to application administrators depending on the severity of the problem. We call these notifications alerts. A tool can send an alert using email, Short Message Service (SMS), instant messaging, and so on. Monitoring an application warns you quickly of errors and provides information to allow you to diagnose and solve problems. This improves applications’ availability.
You now have a high-level view of monitoring. Let’s see how monitoring works with batch jobs in Spring Batch.
12.1.2. Batch jobs and monitoring
Monitoring is particularly useful and even essential in the context of batch jobs because applications execute jobs in the background without a user interface.
Monitoring is possible with Spring Batch because it records everything that happens during batch job executions in a job repository database. Figure 12.2 shows interactions between batch job executions and monitoring tools using the job repository database.
Figure 12.2. Monitoring batch jobs using execution data from the job repository database
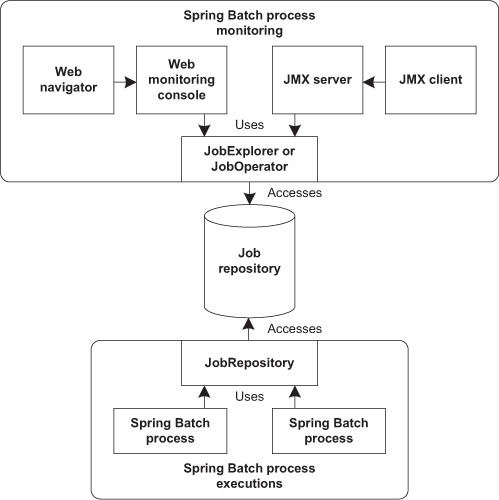
In figure 12.2, you can see that Spring Batch stores everything that happens during job execution in the job repository database; tools also access the job repository database to provide monitoring and management. The repository tracks not only the whole batch job but also its component steps. This makes it possible to know precisely when and where errors occur.
You now know what monitoring is and what it looks like in general, as well as how it applies to batch jobs. It’s time to get to the meat of the chapter by focusing on the job repository and detecting errors. Next, we describe accessing the job repository database from Java applications using the Spring Batch API. We also use Spring Batch Admin and JMX to monitor batch job executions.
When executing batch jobs, Spring Batch records information about what happens in the job repository database. This information is the foundation used to monitor executions.
12.2. Accessing batch execution data
As described in the previous section, monitoring uses data from the job repository database managed by the Spring Batch infrastructure. The first step in monitoring batch job executions is to understand the Spring Batch database schema. You’ll then learn how to access the data using Spring Batch.
In this section, you use a database-based repository with JDBC. You should use an in-memory repository only for tests, not in production environments. Spring Batch provides a set of Data Access Objects (DAOs) that every class interacting with the persistent job repository uses internally. First, we look at the job database schema used by Spring Batch for a persistent job repository. Learning about this schema helps you understand how to monitor applications.
12.2.1. Job database schema
Spring Batch includes a built-in database schema for persistent job repositories but doesn’t provide automatic schema creation. Spring Batch does, however, contain all the necessary scripts used to create this schema depending on your database. The scripts are located in the org.springframework.batch.core package. Spring Batch uses JDBC to interact with the job repository database. You use Spring’s JDBC facilities and its JDBC XML vocabulary to create the database structure, as in following snippet:
<bean id="dataSource" class="(...)"> (...) </bean>

<jdbc:initialize-database data-source="dataSource">
  <jdbc:script
     location="classpath:/org/springframework/batch/core/schema-h2.sql"/>
  <!-- Additional scripts for application -->
  <jdbc:script location="classpath:/create-tables.sql"/>
</jdbc:initialize-database>
After configuring the data source to access the job repository, you specify the class path location of the H2 database script. Script filenames follow the pattern schema-<DATABASE-TYPE>.sql. All SQL scripts create the tables described in figure 12.3. Notice that Spring Batch also provides cleanup scripts for dropping the tables. These scripts are located in the same package and follow the pattern schema-drop-<DATABASE-TYPE>.sql.
Figure 12.3. Database schema for the Spring Batch job repository
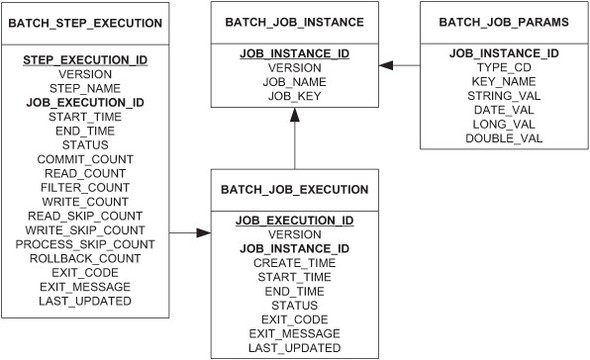
Figure 12.4 shows the Spring Batch classes that carry the same data as the database tables. These classes store everything that happens during batch job executions. Because they provide an object-oriented representation of the tables they map, we use these classes to describe the schema.
Figure 12.4. Job execution classes

Table 12.1 provides a short description of each class involved in job executions.
Table 12.1. Job execution classes and descriptions
|
Class |
Description |
|---|---|
| JobInstance | A job instance with a set of parameters |
| JobParameters | The parameters of a job instance |
| JobExecution | An execution of a job instance |
| StepExecution | An execution of a step within a job execution |
To help you understand the roles these classes play, we describe how Spring Batch populates these objects when it executes a job.
When Spring Batch launches a job, it first checks to see if a job instance exists. A job instance includes a set of parameters. With this information, Spring Batch determines if it can launch the job. Spring Batch then creates a job execution that includes information like the creation timestamp, start time, and a link to its job instance. The last task is to execute the job steps. After Spring Batch executes each job step, the exit status is set on each step; the global exit status for the job is set after all steps are executed.
Figure 12.5 shows the interactions between a job’s lifecycle and the job repository.
Figure 12.5. Interactions between job and repository during batch execution

You now know what happens during job execution and how Spring Batch populates data in the job repository. It’s time to see what data is present in the job repository database after an execution of the imports products job from our case study. As you may recall, the job consists of a single step: read products from a file and insert them in a database table.
You launch the job importProductsJob four times with different parameters. Figure 12.6 shows the contents of the BATCH_JOB_INSTANCE table.
Figure 12.6. Contents of the BATCH_JOB_INSTANCE table

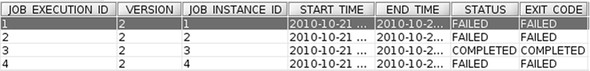
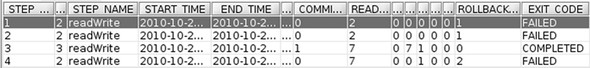
Because you launched the job importProductsJob four times, you have four rows in the BATCH_JOB_INSTANCE table. For each job instance, you execute the job only once, so you find one job execution row per job instance in the BATCH_JOB_EXECUTION table, for four rows, as shown in figure 12.7. In addition to the start and end times of the execution, you can also see the status and exit codes and that only one execution completed successfully; the other three failed.
Figure 12.7. Contents of the BATCH_JOB_EXECUTION table
The BATCH_STEP_EXECUTION table provides an additional level of detail. You can see which steps the job executed for each job execution, as described in figure 12.8. Because there’s only a single step in the importProductsJob job, you find four rows for the executions (one per execution) and see that only a single step ended successfully. The exit codes of these step executions correspond to the exit codes of the job executions.
Figure 12.8. Contents of the BATCH_STEP_EXECUTION table
These database tables let you follow the execution of batch jobs and see what happens at both the job and step levels. You can easily get into the database with a tool like Squirrel—a universal SQL client for JDBC—but Spring Batch provides entities and facilities to access and visualize the data from Java applications and monitoring tools.
In the next section, we describe how to explore the job repository using Spring Batch facilities and how to detect problems in batch job executions.
12.2.2. Accessing data from the job repository
In addition to providing data structures for job metadata, Spring Batch provides entities that provide easy access to the job repository. In chapter 2, we introduced the JobRepository interface. In chapter 3, section 3.3, we showed how to configure a repository but not how to use it in detail. In this section, we explore this subject and describe different ways to interact with the job repository. We begin by using the JobRepository interface.
Using the Jobrepository Interface
Spring Batch defines the JobRepository interface for its internal infrastructure use when executing batch jobs. Spring Batch uses a JobRepository to interact with the job repository during batch job execution. Spring Batch also uses a JobRepository to check parameters when starting jobs and storing information corresponding to job and step executions. You configure a JobRepository and reference it from the job configuration.
This section presents an overview of the services the JobRepository interface offers. We describe how to use a JobRepository during batch execution, but we don’t use it for batch monitoring. The following listing shows the JobRepository interface.
Listing 12.1. The JobRepository interface
public interface JobRepository {
  boolean isJobInstanceExists(String jobName, JobParameters jobParameters);
  JobExecution createJobExecution(
      String jobName, JobParameters jobParameters)
      throws JobExecutionAlreadyRunningException, JobRestartException,
             JobInstanceAlreadyCompleteException;
  void update(JobExecution jobExecution);
  void add(StepExecution stepExecution);
  void update(StepExecution stepExecution);
  void updateExecutionContext(StepExecution stepExecution);
  void updateExecutionContext(JobExecution jobExecution);
  StepExecution getLastStepExecution(
                  JobInstance jobInstance, String stepName);
  int getStepExecutionCount(JobInstance jobInstance, String stepName);
  JobExecution getLastJobExecution(
               String jobName, JobParameters jobParameters);
}
Spring Batch defines the JobRepository interface for use by the job infrastructure to populate the job repository with job and step execution data. We don’t recommend using a JobRepository outside the Spring Batch infrastructure. Fortunately, Spring Batch provides other objects for such use cases. The first one we discuss, the JobExplorer interface, lets you explore the job repository content in read-only mode.
Exploring the Job Repository
The Spring Batch infrastructure uses the JobRepository interface during batch job execution to store job and step data. But JobRepository methods aren’t well suited to exploring the job repository.
To explore the job repository, Spring Batch provides a dedicated interface, the JobExplorer, which offers methods to get information about job and step executions for both running and completed jobs and steps. The JobExplorer interface defines methods to get job execution, step execution, and job instance data, as described in the following listing.
Listing 12.2. The JobExplorer interface
public interface JobExplorer {
  Set<JobExecution> findRunningJobExecutions(String jobName);
  JobExecution getJobExecution(Long executionId);
  List<JobExecution> getJobExecutions(JobInstance jobInstance);
  JobInstance getJobInstance(Long instanceId);
  List<JobInstance> getJobInstances(
                         String jobName, int start, int count);
  List<String> getJobNames();
  StepExecution getStepExecution(
                    Long jobExecutionId, Long stepExecutionId);
}
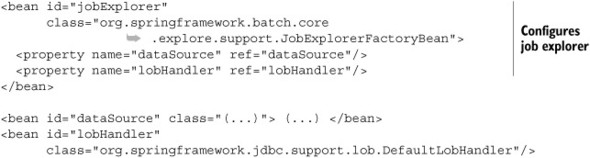
As for the JobRepository interface, Spring Batch provides a built-in default implementation based on JDBC and previously described DAOs. To facilitate configuring a JobExplorer, Spring Batch provides the JobExplorerFactoryBean class. This factory class requires only a data source and a large object (LOB) handler for configuration. This allows the explorer to configure DAOs to save execution contexts automatically.
The following snippet configures a job explorer using the JobExplorerFactoryBean class.
Now that you’ve configured a JobExplorer entity, let’s see how you can use it. Table 12.2 describes each method of the JobExplorer interface. These methods act as the foundation for the next section, which describes how to detect job execution problems.
Table 12.2. JobExplorer interface methods
|
Method |
Description |
|---|---|
| getJobNames | Gets the names of running or completed jobs. Use the names returned by this method to find job instances. |
| findRunningJobExecutions | Finds all currently running job executions. |
| getJobExecution | Returns a job execution based on an identifier. Use this method with a job execution identifier from the getJobExecutions method. |
| getJobExecutions | Gets all job executions for a job instance. |
| getJobInstance | Gets a job instance for an identifier. |
| getJobInstances | Gets all job instances for a job name. |
| getStepExecution | Gets a job execution for a job and step execution identifier. The JobExplorer interface doesn’t have a method to return all step executions. Use the JobExecution class to do this. |
The following snippet describes how to use the JobExplorer interface to find all currently running job instances.
List<JobExecution> runningJobInstances = new ArrayList<JobExecution>();
List<String> jobNames = jobExplorer.getJobNames();
for (String jobName : jobNames) {
  Set<JobExecution> jobExecutions
          = jobExplorer.findRunningJobExecutions(jobName);
  runningJobInstances.addAll(jobExecutions);
}
The JobExplorer interface is the root interface used to browse data contained in the job repository. The JobOperator interface let’s you interact with and control job executions using job metadata. We cover this interface, which can also stop jobs, in chapter 4, section 4.5.1.
The JobOperator interface is similar to the JobExplorer interface but uses simpler types. The JobOperator interface also includes methods to start and stop jobs. The following listing shows the JobOperator interface.
Listing 12.3. The JobOperator interface
public interface JobOperator {
  List<Long> getExecutions(long instanceId);
  List<Long> getJobInstances(String jobName, int start, int count);
  Set<String> getJobNames();
  String getParameters(long executionId);
  Set<Long> getRunningExecutions(String jobName);
  Map<Long,String> getStepExecutionSummaries(long executionId);
  String getSummary(long executionId);
  Long restart(long executionId);
  Long start(String jobName, String parameters);
  Long startNextInstance(String jobName);
  boolean stop(long executionId);
}
As you can see, the JobOperator interface is similar to the JobExplorer interface, but it uses String and Long identifiers instead of Spring Batch metadata objects. Note the difference in the behavior of the getJobNames methods: the JobExplorer method looks at the repository and returns a sorted list of unique job instance names. The JobOperator method returns the available job names you can launch with the start method.
The JobOperator interface is lightweight and particularly suitable for monitoring technologies like JMX, which we examine in section 12.5.
Using what we’ve learned in this section, particularly the JobExplorer interface, we see next how to address real-life use cases monitoring batch jobs.
Detecting Problems During Job Executions
As emphasized early in this chapter, the primary goal of job monitoring is to find out if, when, and where something went wrong. In this section, we present a practical example to detect problems and their causes. In sections 12.4 and 12.5, we follow the same pattern to find problems.
A common use case in monitoring is detecting batch job failures. You detect failed jobs by iterating over all job names and then finding job executions for job instances that end with a failed exit status. The following listing shows how to implement this detection algorithm using the JobExplorer interface. You use this code to iterate over the job names retrieved with the getJobNames method.
Listing 12.4. Detecting failed job instances
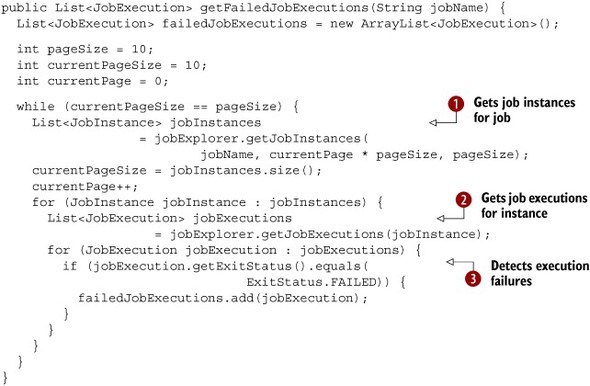
First, you use the job name to get job instances, in pages, using the getJobInstances method ![]() from the JobExplorer interface. You call this method until you get to the last page. Using the job instance list, you then get the corresponding
job executions with the getJobExecutions method
from the JobExplorer interface. You call this method until you get to the last page. Using the job instance list, you then get the corresponding
job executions with the getJobExecutions method ![]() . By checking the exit status of each job execution, you can find which jobs ended in failure. You use the getExitStatus of the JobExecution class
. By checking the exit status of each job execution, you can find which jobs ended in failure. You use the getExitStatus of the JobExecution class ![]() to check the exit status.
to check the exit status.
When you detect failed batch jobs, you investigate causes. Failures can occur at two levels during batch execution: job and step. After identifying the failed job execution, you can collect errors at both the job execution and step execution levels. The JobExecution and StepExecution classes can also provide this information using the getExitStatus and getFailureExceptions methods, as described in table 12.3.
Table 12.3. JobExecution and StepExecution methods related to failures
|
Method |
Description |
|---|---|
| getFailureExceptions | Returns the list of exceptions that caused the execution failure. Spring Batch populates this list during batch execution. |
| getExitStatus | Returns the execution exit code. The method returns an ExitStatus, which contains both the exit code and exit description. |
These methods provide information on what went wrong during job executions. Exceptions are accessible through the getFailureExceptions method. The following listing describes how to query a failed job execution to get to the exceptions that caused the failures.
Listing 12.5. Getting exceptions that cause job execution failure
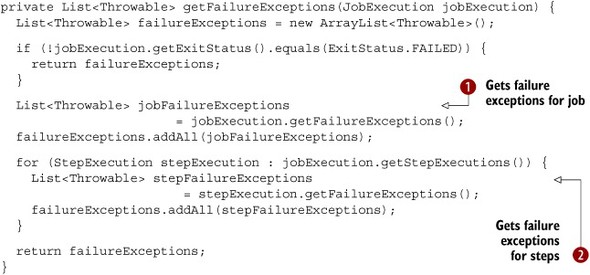
After checking the exit status to see if the job execution failed, you get a list of failure exceptions for this execution
![]() . You then iterate over executed steps for the job execution and get the corresponding failure exceptions
. You then iterate over executed steps for the job execution and get the corresponding failure exceptions ![]() . You add all exceptions to a List returned by the method.
. You add all exceptions to a List returned by the method.
Because Spring Batch doesn’t save these exceptions in the job repository, this information is reachable only from the same process that runs the job execution. If you want to find the cause of a job execution failure after the job completes, you need to use the description of the exit status. The following listing describes how to retrieve all failure descriptions for a job execution.
Listing 12.6. Getting descriptions of problems that cause job execution failure

The implementation of the getFailureExitDescriptions method is similar to the implementation of the getFailureExceptions method. After using the exit status to check that the job execution failed, you get the exit status description for the failed
execution ![]() . You then iterate over executed steps for the job execution and get the corresponding failure exit descriptions
. You then iterate over executed steps for the job execution and get the corresponding failure exit descriptions ![]() . You add all descriptions to a List returned by the method.
. You add all descriptions to a List returned by the method.
In some cases, it’s interesting to get execution information even if the executions are successful. It’s particularly interesting when skips or retries occur. This makes it possible, for example, to detect whether or not skips are normal. The getSkipCount method of the StepExecution class provides information on the number of processed skips during execution, as described in the following snippet:

By iterating over all executed steps for a job execution, the method checks if the step execution contains skips using the
JobExecution getSkipCount method ![]() . If the returned value is greater than zero, the job contains at least one skip.
. If the returned value is greater than zero, the job contains at least one skip.
You can translate this processing using the JobOperator interface. Because JobOperator methods deal only with simple types, you must use the summary methods, getSummary and getStepExecutionSummaries, to get details on errors or skip counts. In section 12.5, we describe how to use the JobOperator methods to monitor job executions.
You can use the JobExplorer and JobOperator interfaces to monitor job executions. You can also use tools to save time, receive notifications, and explore the job repository. Next, we describe how to receive notifications using a listener.
12.3. Monitoring with listeners
You can use two approaches to monitor jobs: active and passive. In this section, we show how to implement passive monitoring to send notifications when something goes wrong during batch job executions. We base our implementation on the Spring Batch listener feature.
We also describe how to implement and configure a generic monitoring listener for any use case. In this example, monitoring doesn’t use data from the job repository but uses in-memory objects for the current batch job execution. When the listener receives failure notifications, you can then query the repository for more information.
12.3.1. Implementing a monitoring listener
The batch listener triggers notifications when failures occur during batch executions. Because you want to support different notification mechanisms (in our examples, email and Spring messaging), you create a general-purpose interface called BatchMonitoringNotifier. By using this interface with a notification listener, you keep the listener generic and configurable.
The BatchMonitoringNotifier interface defines a single method named notify, which takes one argument: the current JobExecution instance. The job execution contains the job instance and failure exceptions. The following snippet shows the BatchMonitoringNotifier interface:
public interface BatchMonitoringNotifier {
  void notify(JobExecution jobExecution);
}
With this interface defined, you can build a generic monitoring listener. This listener uses the notifier when a job execution fails. The following listing provides an implementation of such a listener using Spring Batch annotations.
Listing 12.7. Implementation of the monitoring execution listener
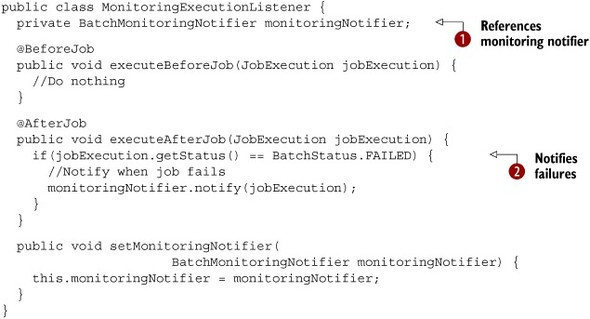
The BatchMonitoringNotifier interface is an instance variable ![]() in the MonitoringExecutionListener class. When Spring Batch calls this listener after a job executes, if the status of the job execution is FAILED
in the MonitoringExecutionListener class. When Spring Batch calls this listener after a job executes, if the status of the job execution is FAILED ![]() , the listener calls the monitoring notifier with the current JobExecution instance as its parameter.
, the listener calls the monitoring notifier with the current JobExecution instance as its parameter.
The configuration of this execution listener follows the same rules as described in chapter 3, section 3.4.3. The following listing uses the listeners XML element to register the monitoring notifier in the importProductsJob job.
Listing 12.8. Configuring the monitoring listener

You use the listener XML element ![]() to register the listener in the job with a bean reference. You then define the listener
to register the listener in the job with a bean reference. You then define the listener ![]() . You also define a property of type BatchMonitoringNotifier and inject it in the listener configuration
. You also define a property of type BatchMonitoringNotifier and inject it in the listener configuration ![]() .
.
You have implemented a generic framework to trigger notifications when failures occur; you can now implement some notifiers. You start with a JavaMail notifier, which sends emails when the listener detects a problem.
12.3.2. Notifying using emails
Our first notification use case is sending emails when failures occur. In this case, the application administrator receives emails containing error descriptions for failed jobs. This implementation is based on the JavaMail API and the corresponding Spring support.
This example uses a Spring MailSender to send an email and a Spring SimpleMailMessage to build the message content. The following listing describes this MonitoringNotifier implementation.
Listing 12.9. JavaMail failure notifier
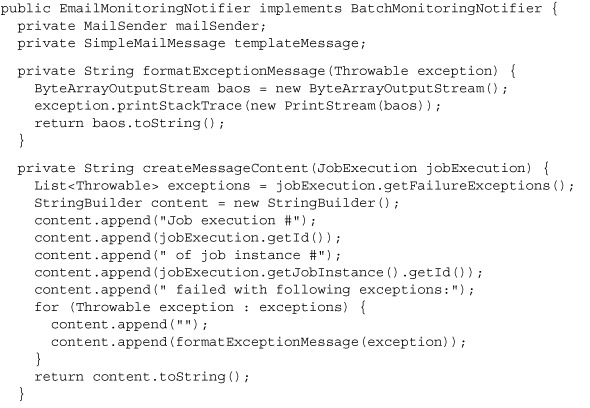

In the notify method, you create an email message using the SimpleMailMessage class. You set the recipient address and the plain text content created from data contained in the job execution ![]() . You then use the injected MailSender instance to send the message
. You then use the injected MailSender instance to send the message ![]() .
.
To configure this notifier, you define a Spring JavaMail sender and a template for messages. The following listing describes how to configure the email-based notifier.
Listing 12.10. Configuration of the JavaMail failure notifier

You first define JavaMail entities using Spring support ![]() and then inject them in the email-based notifier
and then inject them in the email-based notifier ![]() .
.
Because Spring provides a generic messaging mechanism between beans configured in application contexts, it’s also possible to provide a BatchMonitoringNotifier implementation that triggers events in this system rather than using JavaMail. This mechanism provides the ability to implement transparent bridges between technologies. In the next section, we describe how to implement a monitoring notifier that creates and sends messages using Spring messaging.
12.3.3. Notifying using Spring messaging
Sending email messages is good, but it’s specific to a single messaging technology. Using the generic messaging feature in Spring opens the door to using other technologies for failure notifications like Java Management Extension (JMX). This feature is built in to the ApplicationContext and allows beans to send messages to each other. This corresponds to implementing the listener pattern in the Spring container. The Spring container itself uses this generic messaging framework to notify entities it manages of events like container initialization and finalization.
The two key messaging types are the ApplicationEventPublisher interface for sending messages and the ApplicationEvent class for consuming them. In order to notify, you configure Spring to inject an ApplicationEventPublisher instance in the notifier, which must also implement the Spring ApplicationEventPublisherAware interface. The following listing shows the implementation of a Spring messaging notifier.
Listing 12.11. Spring messaging notifier

In this example, the notify method uses the ApplicationEventPublisher instance (configured through injection) to send a message ![]() to other beans present in the Spring application context. You create the message using the Spring SimpleMessageApplicationEvent class.
to other beans present in the Spring application context. You create the message using the Spring SimpleMessageApplicationEvent class.
Configuration of the ApplicationEventMonitoringNotifier class is simple because all you do is define the notifier as a bean:
<bean id="applicationEventMonitoringNotifier"
      class="com.manning.sbia.ch12.notification
                        .ApplicationEventMonitoringNotifier"/>
As you can see, this mechanism is generic and dispatches events from batch jobs in the Spring configuration, but this isn’t all you can do. You can also plug in a listener using the ApplicationListener interface.
We’ve now finished our overview of the API used to implement monitoring of batch job executions. Choosing this low-level approach can be a bit tedious. We focus next on higher-level tools to monitor batch jobs. We begin with Spring Batch Admin.
12.4. Web monitoring with Spring Batch Admin
Spring Batch Admin is the monitoring web console that ships with Spring Batch. It provides a quick and convenient way to explore the job repository using a web browser. This approach falls into the active monitoring category because you need to use the tool to see if something went wrong; it doesn’t provide notifications. We introduced this tool briefly in chapter 2 to display batch execution results. Appendix B covers how to install and set up Spring Batch Admin.
Figure 12.9 provides an overview of Spring Batch Admin and shows the tool running in a Java web server using Spring Batch execution data and JDBC-based DAOs to access the job repository.
Figure 12.9. Overview of the Spring Batch Admin architecture

Because Spring Batch Admin maps batch execution concepts and data into its UI, the information displayed will be familiar when using the tool. You can find batch execution problems with the same concepts as when using the Spring Batch API. In this section, we first provide an overview of the tool’s capabilities and then describe how to detect problems.
12.4.1. Feature overview
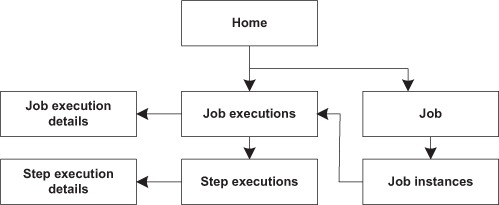
You can look at Spring Batch Admin as an application layer on top of the job explorer described in section 12.2.2. Figure 12.10 shows how to navigate Spring Batch Admin.
Figure 12.10. Navigating Spring Batch Admin
One feature of Spring Batch Admin is the ability to import job configuration files. This feature makes it possible to manage executions (start, stop, and so on) directly through the web console. This section concentrates on how to use the tool to access information on job executions.
You execute the importProductsJob job from our case study, which contains a step named readWrite. When the job execution is in progress or is finished, the corresponding job and job instance are present in the UI, as shown in figures 12.11 and 12.12.
Figure 12.11. Job names registered
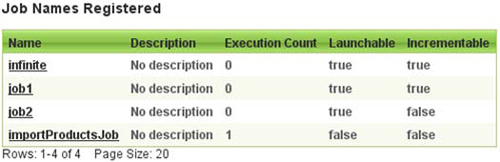
Figure 12.12. Job instances for a given job
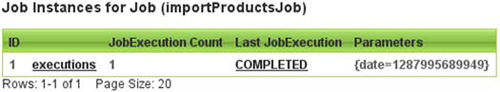
Figure 12.12 shows that the job instance contains the execution you launched and that it completed successfully. You can quickly see that the last execution completed successfully. You can then go to the recent and current job executions page and click on the job execution to see its details, as shown in figures 12.13 and 12.14.
Figure 12.13. Recent and current job executions

Figure 12.14. Details for a job execution

The last details you can get to are those of step executions. You reach these pages by following the link on the job execution details page from figure 12.14. This gives you access to the information illustrated in figures 12.15 and 12.16.
Figure 12.15. Step execution list for the job execution

Figure 12.16. Details of the step execution

The Spring Batch Admin tool lets you quickly access information on batch job executions. It provides a job list and the ability to drill down to details, all from a web browser. This is a great tool for monitoring batch jobs remotely. The main benefit is that you now have a way to detect failures.
12.4.2. Detecting problems encountered during batch executions
In the previous section, the tables in the figures contained fields named Status and ExitCode, which tell you about the success and failure of job and step executions.
If you see FAILED, you can conclude that something went wrong during an execution. As when using the job explorer, you look at the job and step details to know more about what failed. As an example of finding a failure, we introduce a malformed field in the input file of the importProductsJob batch job of our case study. Execute the job again, and you’ll see in the job executions list and details that there was a problem, as shown in figures 12.17 and 12.18.
Figure 12.17. Recent and current job executions containing a failed job execution
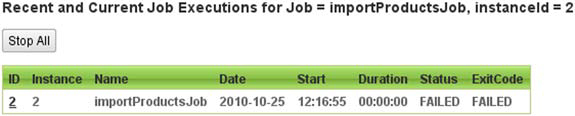
Figure 12.18. Details of a failed job execution

Because the error occurs while importing the input file, you can’t see the details of this error at the job execution level. You must look at the details of the corresponding step. This is the readWrite step from our case study, the only step in the importProductsJob job.
When displaying the step details, you see the corresponding error in the exit message field. This message corresponds to the exception thrown when trying to parse the malformed field. This exception is a FlatFileParseException, as shown in figure 12.19.
Figure 12.19. Details of a step execution failure include a stack trace in the exit message.
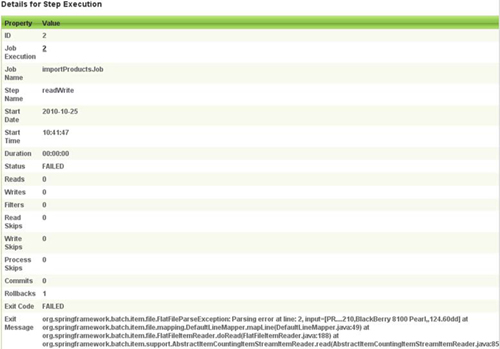
Figure 12.19 shows the step execution details page, which displays information related to failures and skips. This makes it possible to detect when skips occur during executions if they occur using the read skips, write skips, and process skips properties.
Using tools like Spring Batch Admin layered on top of Spring Batch to access the job repository saves you a lot of time. Spring Batch Admin uses the Spring Batch low-level API to provide a web console to monitor batch jobs. Next, we use JMX, the Java technology dedicated to management, to monitor our application.
12.5. Monitoring with JMX
JMX supplies management and monitoring tools for applications and devices (like printers). JMX represents resources with objects called MBeans (Managed Beans).
The success of JMX is such that Sun integrated it in J2SE as of version 5.0. Today, many Java EE application servers and frameworks use JMX. Applications that implement JMX provide access to information about application resources and provide administrative operations for live applications.
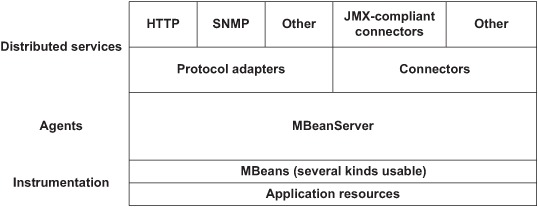
To understand how Spring Batch integrates with JMX, you must understand the JMX architecture. The layered architecture of JMX exposes application resources as MBeans through the instrumentation layer. The MBean server is responsible for handling resources exposed as remote resources through the distributed services layer. Figure 12.20 shows the layers of the JMX architecture. JMX clients like JConsole or applications can connect to agents through server-side connectors using client-side connectors.
Figure 12.20. JMX architecture
Integrating Spring Batch with JMX involves exposing Spring Batch resources as JMX-managed resources. Spring provides support to expose any POJO as an MBean. Although exporting jobs is possible, you normally expose JobOperator entities as MBeans. Note that using a JobExplorer through JMX isn’t great because it exposes complex objects, not simple ones like a JobOperator.
The JMX launcher configures and registers a JobOperator with JMX for running jobs asynchronously. Monitoring clients can then access the JobOperator through JMX. Clients include the standard Java jconsole application and any clients accessing entities remotely through JMX connectors. Figure 12.21 illustrates this architecture.
Figure 12.21. Using JMX with Spring Batch
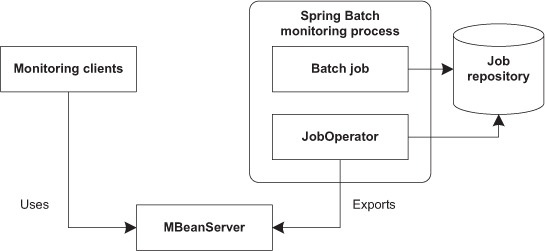
As shown in the figure, the first step is to define the Spring Batch monitoring process that configures Spring Batch’s entities for JMX monitoring. This means configuring the JobOperator entity and exporting it as an MBean in the JMX server through Spring’s JMX support. Although not mandatory, you commonly define batch structures at this level to manage them (start, stop, and so on) directly through JMX via a JobOperator. Next, we describe how to access and use entities present in the JMX server. Based on these entities, we monitor batch jobs and their executions.
12.5.1. Configuring JMX for Spring Batch
The main type in Spring JMX is the MBeanExporter class, which is responsible for transparently creating MBeans from POJOs and determining which fields and methods are reachable through JMX. Because Spring JMX is out of the scope of this book, we focus only on how to use Spring JMX to export Spring Batch entities through JMX. If you want to go deeper, refer to Craig Walls’ Spring in Action, Third Edition (Manning Publications, 2010).
We describe how to configure the JobOperator entity in chapter 4, listing 4.6. Based on this configuration, you export objects through JMX. The first step is to define the bean corresponding to the JobOperator in the beans property of the MBeanExporter that defines beans to export and their corresponding JMX identifiers. The second step uses the assembler property to determine which data to export through JMX. The following listing shows how export a JobOperator bean through JMX.
Listing 12.12. Exporting a JobOperator through JMX

When you reference the jobOperator bean in the beans property of the MBeanExporter bean, you specify its corresponding object name in JMX ![]() . In the case of the jobOperator bean, the domain is spring with two key-value property pairs. The first property specifies that the object be relative to a batch. The second property
is the bean name.
. In the case of the jobOperator bean, the domain is spring with two key-value property pairs. The first property specifies that the object be relative to a batch. The second property
is the bean name.
Within the assembler property, you use the InterfaceBasedMBeanInfoAssembler class, which uses beans to define which fields and methods are reachable through JMX ![]() . For the previous JMX path, you specify use of the JobOperator interface.
. For the previous JMX path, you specify use of the JobOperator interface.
A JMX object name is an MBean identifier and must conform to the syntax defined by the JMX specification. This syntax is a domain name and a colon, followed by a comma-separated list of key-value pairs. For example:
spring:service=batch,bean=jobOperator.
The configuration doesn’t define an MBean server for the MBeanExporter bean. The MBeanExporter bean can detect the current MBean server automatically from the JVM process. For example, Spring uses the MBean server from the JVM process with no additional configuration.
You access JMX remotely because the MBean server doesn’t run on the same machine as the clients (by design). Therefore, you must configure a JMX server connector, which the JMX specification defines to allow remote access to JMX agents. JMX supports Remote Method Invocation (RMI) natively, and you can configure Spring JMX using its ConnectorServerFactoryBean class, as shown in the following listing. In this case, JMX manages RMI transparently for remote access.
Listing 12.13. Configuring a JMX server connector

You create the RMI registry with the Spring RmiRegistryFactoryBean class ![]() and set the RMI port. You then configure a JMX server connector with the ConnectorServerFactoryBean class
and set the RMI port. You then configure a JMX server connector with the ConnectorServerFactoryBean class ![]() . After defining the path of the connector in JMX with the objectName property, you specify the address to access the JMX server through RMI with the serviceUrl property.
. After defining the path of the connector in JMX with the objectName property, you specify the address to access the JMX server through RMI with the serviceUrl property.
At this point, you’ve configured everything to monitor Spring Batch jobs through JMX. The next section focuses on how to explore batch execution data and find problems.
12.5.2. Monitoring with JMX consoles
Starting with Java 5, JMX, an MBean server, and JConsole are built into the Java platform. You launch JConsole using the jconsole command on the command line.
JConsole provides monitoring information on the Java process, its memory usage, thread and class information, and MBeans. JConsole displays both internal and user-defined MBeans. For JMX configurations used to monitor batch jobs in JConsole, corresponding MBeans are located under the spring/batch tree node of the MBean explorer tree in the left pane, as shown in figure 12.22.
Figure 12.22. Monitoring batch jobs using JConsole
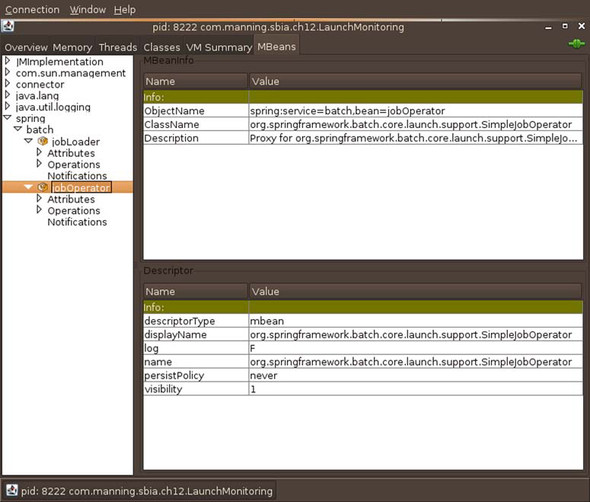
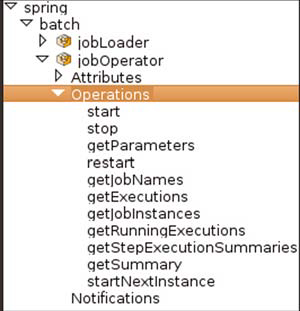
Each MBean has a set of attributes and operations. In the case of the JobOperator MBean, these operations allow retrieving execution data, as shown in figure 12.23.
Figure 12.23. Viewing JobOperator operations (methods) in JConsole
Using these methods, you monitor and manage a Spring Batch job, its instances, and its failures. This section follows the same use case as in the Spring Batch Admin section. First, you get job instances based on a job name, importProductsJob for the case study, as described in figure 12.24. The getJobInstances method returns job instance identifiers. Remember that the JobInstance class uses simple types exclusively. Using these identifiers, you can retrieve identifiers corresponding to job executions with the getExecutions methods, as shown in figure 12.25.
Figure 12.24. Getting job instance identifiers for a job name
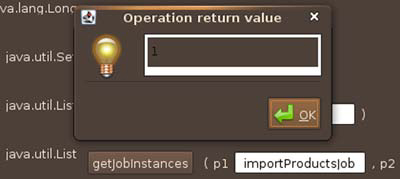
Figure 12.25. Getting job execution identifiers for a job instance
Using a job execution identifier, you can use the getSummary and getStepExecutionSummaries methods to get detailed information of what happened during execution at both the job and step execution levels. These two methods return a String containing information on executions, including the exit status and exit description, which you can use to detect errors and their causes.
Figures 12.26 and 12.27 describe calls to the methods getSummary and getStepExecutionSummaries. Figures 12.18 and 12.19 show the same information.
Figure 12.26. Displaying the summary of a job execution

Figure 12.27. Displaying summaries for all step executions of a job execution

Spring Batch integrates well with JMX, the Java standard management technology, for monitoring purposes. Using Spring JMX support, you can expose JobOperator objects and interact with the job repository. You can then access these objects remotely through a JMX console like JConsole to remotely execute operations, get execution information, and manage batch job executions.
12.6. Summary
Monitoring is an important aspect of working with batch jobs because it lets you see what happens during job executions and detect failures. All through this chapter, we focused on which features and tools Spring Batch provides to monitor batch job executions and detect failures.
Spring Batch offers various ways to monitor batch job executions:
- Directly browse the job repository database —The most basic approach is to browse history data directly in the job repository database using a SQL client and executing SQL requests.
- Access execution history using the Spring Batch API —The JobExplorer and JobOperator interfaces implement a thin object-oriented layer on top of the job repository database.
- Use Spring Batch Admin —Spring Batch provides the Spring Batch Admin web console used to monitor batch job executions based on the job repository database.
- Monitor with JMX —You can use Spring Batch and JMX together to expose Spring Batch entities and access job execution history.
We don’t recommend using the Spring Batch API directly in most cases. A better approach is to use high-level tools like Spring Batch Admin or JMX through a console like JConsole. In chapter 13, we focus on advanced features of Spring Batch used to improve performance: scaling jobs and parallelizing executions.