Variation and What It Means to be in Control and Capable
To make a thing the way we want to make it is one popular conception of control.
—Walter Shewhart
Why is it that there is so much variability in what we do? Why can’t we better predict how our processes will perform from day-to-day or even hour-to-hour? If you find yourself asking questions such as these, statistical process control (SPC) is a tool you will find useful. Let us begin with a discussion of variation.
Variation1
More than 80 years ago, Walter Shewhart, the father of SPC, asked, “What can we say about the future behavior of a phenomenon acting under the influence of unknown or chance causes? I doubt that, in general, we can say anything.”2 Shewhart went on to discuss two types of variation: assignable cause variation and chance cause variation. We will also refer to chance cause variation as common cause variation and assignable cause variation as special cause variation—the terms most frequently encountered today. So, what is the difference between common and special cause variation?
Suppose you drive to work by the same route and at about the same time every workday. Sometimes you are lucky and make every light. Other days you miss most of them. Traffic is sometimes heavier on some days than others. These are examples of common cause variation and they can result in variation in the length of time it takes to drive to work. The American Society for Quality (ASQ) defines common “causes of variation (as those) that are inherent in a process over time. They affect every outcome of the process and everyone working in the process.”3 It is the variation that exists in a process when it is operating as designed and, in the case of our example, these causes result in variation in travel time to work but that variation is predictable. That is, we can predict that the drive to work should fall within a certain range, which is determined by the common cause variation.
Suppose that one day, in addition to the traffic lights, traffic, and other common causes, we run out of gas. This additional source of variation is unusual and is referred to as an assignable cause. ASQ defines assignable cause as “A name for the source of variation in a process that is not due to chance and therefore can be identified and eliminated. Also called special cause.”4 Special causes can have a profound effect on a process and make it unpredictable. The range of travel times established when only common cause variation was present is out the window when one or more assignable causes are also present. Thus you can no longer predict how long it will take to get to work on a day when you run out of gas. The length of the drive will depend on a number of additional factors. Is there a gas station nearby? If not, how long will it take for your roadside assistance service to send help? Will a policeman stop to offer assistance? These additional factors are now paramount in how long it will take us to make our commute.
Process Variation: In and Out of Control
We say that a process is in control when “the variations among the observed sampling results can be attributed to a constant system of chance causes.”5 That is, the variation in the length of the drive to work is due exclusively to the identified common causes in the system, which include our luck with traffic lights and the amount of traffic.
We say that a process is out of control when “the variations among the observed sampling results cannot be attributed to a constant system of chance causes.”6 That is, the variation in the length of the drive to work is due to both the identified common causes IN ADDITION TO the assignable causes such as running out of gas.
So, we now understand the difference between common and assignable cause variation and what it means to be in control or out of control. But, what difference does it make? Let us continue with the driving to work example. Suppose you keep a record of your drive times and determine that on average it takes 57 minutes to get to work. There are two “outliers”: drive times that appear to be significantly higher than the others, which you eliminate before doing your calculations so as not to overly affect the average. The outliers appear to be due to assignable causes—you ran out of gas twice while driving to work. With the outliers removed, you observe that the longest drive time is 67 minutes and the lowest is 47 minutes.
When someone asks about the length of your commute, you might respond that it is 57 minutes even though it would be more accurate to say it is between 47 and 67 minutes. If you want to assure that you are never late for work, you might decide to leave 67 minutes before start time. By doing so you assure that you will be either early or on time almost every day so long as only common cause variation is present.
But what about the outliers? If you really want to decrease the probability of arriving late for work, you should examine why these outliers (assignable causes of variation) occurred. Once you determine that both are due to your running out of gas, you might decide to change your refueling system. Instead of refueling only when the low fuel light comes on indicating your fuel level is alarmingly low, you might decide to check the gauge every afternoon before leaving for home and refueling whenever the gauge shows a quarter tank or less. This modification of the system should assure that you will never again run out of gas on the way to work.
Example 2.1
Evaluating Worker Productivity
A few years ago I was given a tour of a new automated warehouse. During the tour the warehouse manager showed me how he measured and managed stock picker productivity. A large chart was prominently displayed where each worker’s productivity was recorded. Workers who fell below a specified number of picks per day were issued disciplinary warnings.
As the tour progressed, we stopped at a picking station where several conveyor belts moved overhead. Periodically the packages on one belt jammed and the picker was required to use a broom handle to clear the jam. The manager explained that this happened fairly often, but wasn’t really a problem since the jams were easily cleared. Since clearing the jams obviously took time away from the picking job, I asked whether an adjustment was made in the picking standard for this station to prevent the picker from being reprimanded for a system’s problem over which he had no control. The manager replied that no adjustment was necessary. Since the pickers were rotated daily, no one picker would stay on this station often enough to receive enough reprimands to trigger disciplinary action.
In this case, management was aware of a specific assignable cause yet still treated the situation as if the variation was due to common causes under the control of the picker. Does such a situation exist somewhere in your organization?
Knowledge about whether a process is in or out of control has other, more significant implications. Consider the heating, ventilating, and air conditioning (HVAC) system in your office. It consists of a number of components, but let us consider just the thermostat in this example. Suppose you wish to maintain the temperature in the office at 72°F year round. When the thermostat is operating in control, sampling the ambient temperature may reveal that it varies between 70° and 74°. You notice one day that it is particularly hot in the office although the thermostat is still set at 72°. You check the actual temperature and find it to be 80°. The maintenance technician finds the assignable cause—the thermostat has malfunctioned—replaces the device and brings the process back into control.
Suppose someone in the office is particularly sensitive to small variations in temperature. They are too warm when the temperature is 74° and too cool when the temperature is 70°. They assume the process is out of control and begin to manually manipulate the thermostat in an effort to stay comfortable. When the temperature is 74°, they adjust the thermostat to 68° to cool it down, Since the thermostat controls to within ±2°, it cools until the actual temperature reaches 66°. Now freezing, they readjust the thermostat to 76°, which results in a peak temperature of 78°. By overadjusting a process that is in control at between 70° and 74° (72° ± 2), the process now is performing between 66° and 78° (72° ± 6). The process variation is now three times greater than if the thermostat had been left alone.* This is an example of what can happen if all variation is treated as if it has an assignable cause. If the organization is not happy with the ±2° common cause variation in the process, an appropriate response would be to invest in a more precise thermostat that can maintain a set temperature to within ±1°.
W. Edwards Deming created an exercise to illustrate the dangers associated with tampering with a process that is in control. It is called Deming’s Funnel Experiment.7 In the experiment, a marble is dropped through a funnel onto a piece of paper on which a bull’s eye is marked, and the location where the marble lands is marked on the paper. This is repeated many times first without moving the funnel (Rule 1 in Deming’s experiment). Typical results are shown in Figure 2.1a. Next the funnel is adjusted after each drop according to one of several rules. In one rule, if a marble lands one inch north of the bull’s eye, the funnel is adjusted one inch south of its original position (Rule 2 in Deming’s experiment). Rather than decreasing the variation, this adjustment after each marble results in a dramatic increase in variation as shown in Figure 2.1b. The same result can be expected when an overzealous machine operator measures each part that is produced by a machine operating in control and adjusts that machine based on each measurement. The performance of the machine as measured by the variation in the dimensions of the parts produced will be much worse than if the operator had left the machine alone.
The primary tool for determining the state of control of a process is the control chart. The control chart represents the process talking to you—telling you about its state of control, and when it shows the process is in control actually represents a kind of statistical model of the process. This model allows one to make predictions about the process. Control charts are discussed in Chapters 3–6.
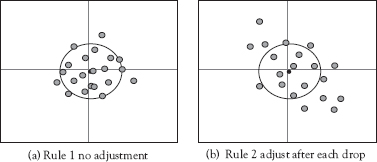
Figure 2.1 Results of rules 1 and 2 of Deming’s funnel experiment
Source: A macro is available to conduct Deming’s Funnel Experiment using Minitab® at http://support.minitab.com/en-us/minitab/17/macro-library/macro-files/educational-macros/funnel/ A video of the Deming funnel experiment is available on line at https://www.youtube.com/watch?v=t5DV69_2VeQ
Having determined that a process is in control, the next step is to determine how well the stable process is able to meet specifications. This is referred to as process capability analysis.
Capable
It is important to note that simply because a process is in control does not mean that process is capable of achieving the results we desire. A process that produces 100 percent defective product may be in control and predictable; however, no one would consider that to be a satisfactory result.
ASQ defines process capability as “A statistical measure of the inherent process variability of a given characteristic”9 and assumes the process is in control. We can think of capability as measuring the ability of an in control process to meet specifications or expectations. We may derive a first order estimate of the capability of our commuting example by using the range. The current commuting example process is capable of providing a drive time between 47 and 67 minutes with an average of 57 minutes. The range for this process is 67 – 47 = 20 minutes.
But suppose you are not satisfied with having to leave 67 minutes before start time each day in order to minimize the probability of being late. You would like to spend more time with the family at breakfast. To reduce the time you have to leave before work starts (i.e., make the process more capable), another change to the system is required. One alternative to consider might be to use the Metro Park-and-Ride system. You drive 10 minutes to a parking lot, board a bus that uses the high occupancy vehicle (HOV) lane, and delivers you to the downtown station in only 15 minutes. Your office is a 5-minute walk from the station. Your total “drive” time is now reduced to an average of 30 minutes. The new system also has a smaller range of transit times of 25–35 minutes or 10 minutes. To assure that you have the same on time arrival at work performance with the new system as with the old, you should leave home 35 minutes instead of 67 minutes before start time. This allows you to spend 32 additional minutes with your family and has the ancillary benefit of allowing you to read the paper or work while riding the bus instead of driving. You have improved the capability of the process by improving, or in this case redesigning, the system.
So how do we know what type of variation is present in a process and how do we measure process capability? These topics are discussed in Chapters 3 and 7, respectively.
Measurement Variation
Humorist Evan Esar once defined statistics as the “science of producing unreliable facts from reliable figures.” The more common problem encountered in SPC is associated not with unreliable facts but unreliable figures. We are often too quick to assume that because we measured a value, it is a fact. However, there are significant potential sources of error associated with measurement processes of all types. If we ignore these potential sources of error, we are subject to the GIGO—garbage in; garbage out— effect and we try to produce reliable facts from unreliable figures.
Perhaps you have, as I have, weighed yourself at home, at the fitness center, and at the doctor’s office on the same day. Never are the three weights the same. Consequently, I have doubts about knowing what I really weigh—the figures are unreliable. With SPC, it is vital that we have reliable data. So we conclude our discussion of variation with a discussion of variation in measurement or measurement error.
When we measure something—physical dimensions, customers’ satisfaction, numbers of errors—the number we obtain is actually a function of the actual value and the variation in measurement, often referred to as measurement error. The study of the science of measurement is referred to as metrology.8 Measurement error consists of two parts. We refer to these two parts of measurement error as accuracy and precision when talking about physical measurement of things such as height, weight, and length. When talking about qualitative measurement of things such as customer satisfaction and employee attitudes, we refer to these parts as validity and reliability.
Accuracy and Precision for Dimensional Measurements
Accuracy is the characteristic of a measurement that tells how close an observed value is to a true value.10 In the case of weighing myself on multiple scales and obtaining different weights, there is evidence that one or more of the scales is inaccurate. My actual weight is a true value. My weight as measured on my home scales may or may not be accurate. The only way to minimize error due to inaccuracy is by calibration against an accepted reference value. Were I to employ a certified technician who uses a set of reference standard weights that are traceable to the National Institute of Standards and Technology (NIST) to calibrate my home scales, I would be assured that error due to inaccuracy would be minimized.
“Precision is the aspect of measurement that addresses repeatability or consistency when an identical item is measured several times.”11 Precision, as applied to instruments used to measure physical dimensions, is comprised of two parts: repeatability and reproducibility (R&R). Repeatability is the ability of a single operator to obtain the same measurement value multiple times using the same measuring device on the same part. Reproducibility is the ability of separate operators to obtain the same measurement value multiple times using the same measuring device on the same part.12 Precision for dimensional gauges is assessed through gauge R&R studies.13
Assuring the accuracy and precision of measurement systems is essential. Before beginning to collect data for SPC, examine the measurement system to assure that it has been properly calibrated and that a gauge R&R study has demonstrated its suitability for the task. These checks should be routine parts of the measurement process. Otherwise, you really have no idea whether the reported value is fact or fiction.
Example 2.2
Trendy Wire Company
A number of years ago I was working with a client that manufactured wire products such as power cords, connecters, and wire harnesses for consumer electronic devices. One process involved extruding a plastic insulating coating onto copper wire. Since the thickness of the coating determined how well the wire was insulated, it was a critical parameter that had to be controlled in order to maintain certification of the products by Underwriters Laboratories (UL). The problem was that the measurement data indicated there was excessive variation in the thickness of the extruded coating that had resulted in hundreds of miles of wire either being downgraded to a lessor standard and sold at a much reduced price or being sold as scrap.
Plant records showed that this problem had surfaced about three weeks previously and several process engineers had spent hours trying to determine what had changed in the process at that time. To this point, they had found nothing that seemed to correlate with the onset of the problem.
At this time, the plant did not use SPC. Indeed I had been asked to help them with SPC training and implementation. I thought that this process might be a good place to start, so I began working with the process engineers to determine the root cause of the problem.
We started by talking with the operators and assessing the measurement process. Micrometers were used by the operators to make thickness measurements which they used to make necessary adjustments to the process. Records showed that the micrometers were in calibration and that gauge R&R studies found that total RR was 10 percent of tolerance—a value the company considered to be acceptable. However, when I asked the operator to train me in making the measurements, I was unable to obtain repeatable results on a sample of the wire. Further investigation determined that the micrometer had been dropped about three weeks before which resulted in damage to the instrument. The operator did not notice any damage and failed to report the incident. When the micrometer was replaced, the problem disappeared.
Validity and Reliability for Qualitative Measurements
We often collect qualitative data from customers, suppliers, employees, and others using some form of survey methodology such as mail survey, telephone survey, on-line survey, or face-to-face interview. When doing so, we must be concerned with the validity and reliability of our measurement system. In this context, validity is the degree to which the method used to collect data actually measures what it is intended to measure. Reliability is the consistency of the method.14 For an example of how to assess the validity and reliability of a survey instrument, the reader is directed to Sower, Duffy, Kilbourne, Kohers, and Jones.15
The use of previously validated scales is one way to address validity. However, one must exercise care to assure that the previous validation was conducted appropriately and that the constructs measured in its published use are identical to those you plan to measure. Scales found in the literature have generally been evaluated for reliability as well. However, one should always measure reliability each time the scale is used since reliability can vary with the population and sample being assessed.
Just as it is always dangerous to use dimensional measurement systems whose accuracy and precision are unknown, it is dangerous to use measurement scales whose validity and reliability are unknown. Spurious measurements incur two costs: the cost of making the measurement and the cost of being wrong about the true value of what is being measured. When using SPC, the cost of being wrong about the true value can be substantial because decisions are made about the state of control of the system being assessed. Spurious measurements can result in an organization failing to detect shifts, for example, in customer satisfaction because the survey instrument does not measure the key factors customers use to determine the quality of the products and services they receive.
Example 2.3
Maddie’s Weenie Stand
Madeline Grace had experience in the food service industry and decided to unleash her entrepreneurial ambitions and open her own restaurant. She had leased a small storefront and opened Maddie’s Weenie Stand. She wanted to grow her business and realized that customer feedback was an important input. She started by using customer feedback cards, but very few customers bothered to fill them out. So she asked members of the local Chamber of Commerce how they obtained customer feedback. A local banker told her he used a survey he found on-line to measure the quality of the services his bank offered. He selected a random sample of residents from the telephone directory each month and mailed them a survey. He suggested she do the same.
So Madeline substituted Maddie’s Weenie Stand for the bank’s name on the survey form and began mailing 100 survey forms a month. She was disappointed to find that only about 5 percent of the forms were returned and the information they provided did not give her a clear direction about how to improve her products and services. So, she contacted the local university and ended up partnering with a management class adopting her business as a class project.
The students contacted the individuals on Maddie’s mailing list and invited them to participate in focus groups. Maddie agreed to provide coupons for free hot dogs to all focus group participants. When the students reported their results at the end of the semester, Maddie was astounded.
Among the top reasons recipients failed to respond to the survey is that they were frustrated that the questions did not address the factors they considered important. Once this was discovered, the students asked the participants what factors they considered important in assessing the quality of a small specialty food restaurant such as Maddie’s. One factor was product variety. Another was aesthetics— how the product was presented. Another was product freshness. The banker’s survey did not ask about any of these factors.
The next semester, Madeline partnered with another management class to develop a survey instrument that addressed the factors that the focus groups showed were important to her customers. At the end of the semester the students presented Madeline with a survey instrument they had developed and pilot tested to assure that it was valid and reliable.
The first thing that Madeline found was that her response rate more than doubled with the new instrument. When she evaluated the information the surveys provided she noticed that a common theme was that she did not offer enough product variety. She decided she would begin launching a new product—often one suggested by customers— each month. Those that sold well would become part of the standard mix. Those that didn’t would be phased out. Several of the respondents to her survey had specifically mentioned Chicago-style hot dogs, so that was her first new product.
Her new strategy paid off. Business began increasing at a more rapid rate as shown by her run chart (Figure 2.2) and repeat customers increased dramatically. Asked what she learned from all of this, she replied: “One size does not fit all in hot dogs or survey instruments. You have to be sure you are asking the right questions of the right people and that you react to the input you receive in an appropriate way.” Put another way, you must always be sure that your survey instrument is valid and reliable for your intended use then use the information it provides to guide business decisions.
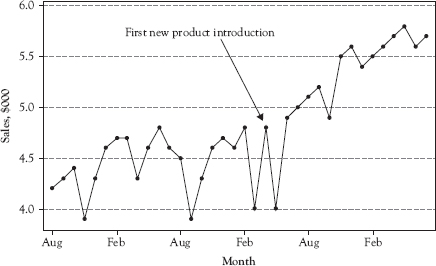
Figure 2.2 Run chart of sales
Source: Made using Microsoft ExcelTM.
Assessing the validity and reliability of survey instruments requires extensive knowledge and skills. In our example, Maddie was well advised to seek assistance in assessing her survey instrument.
Using measurement systems whose accuracy and precision or validity and reliability have not been assessed can lead to considerable waste of time in attempting to control and improve processes. In addition, they may lead to poor decisions that may do more harm than good. When employing SPC, always assure that you have properly assessed the measurement systems that will provide the data on which decisions are made.
Chapter Take-Aways
• All processes contain variation. Variation in processes can result from common causes and assignable causes.
• A process with only common cause variation present is predictable and is referred to as being in control. Overadjusting an in-control process increases variation.
• A process that contains assignable causes of variation is unpredictable and is referred to as being out of control. The root cause(s) of assignable variation must be determined and appropriately addressed in order to bring an out-of-control process into a state of control.
• In control does not mean that the process is meeting expectations. That is measured by process capability.
• Capability refers to the ability of an in-control process to meet expectations.
• Measurement processes are also subject to variation. Measurement variation is variation that derives from the process used to measure a characteristic. For physical measurement systems, accuracy and precision must be assessed. For qualitative measurement systems, validity and reliability must be assessed. Using a measurement system whose variation is unknown is akin to taking measurements with a rubber ruler.
Questions You Should be Asking About Your Work Environment
• How many of your processes can be said to be predictable? If less than 100 percent, what would be the value of making all processes predictable?
• Do all of your processes consistently meet all expectations? If not, what would be the value of making all of your processes capable?
• Are all of your measurement systems regularly assessed? If not, how do you know that you are not being provided with “unreliable facts” from those systems upon which you are basing decisions?
* This actually happened and the company responded by providing each employee with his or her own thermostat, which they could adjust at will. Everyone agreed that they were more comfortable. No one told them that the thermostats were dummies—not connected to the HVAC system.