
2
Risk Assessment
In the risk assessment step the enterprise identifies the critical risks to strategy, it analyses and evaluates these critical risks and it prioritizes the critical risks. Risk assessment has been the traditional focus of many risk managers for decades. However, in ERM critical risks include all risks whether operational, competitive, financial, regulatory or from other sources. Finally both positive and negative risks are considered in the context of their criticality as it could affect the strategy.
2.1 RISK QUANTIFICATION: CORNERSTONE FOR RATIONAL RISK MANAGEMENT
Jean-Paul Louisot
Formerly Université Paris 1 Panthéon-Sorbonne, Directeur pédagogique du CARM Institute, Paris, France
Laurent Condamin, Ph.D
Consultant and CEO ELSEWARE1
Patrick Naim
Consultant and Partner ELSEWARE
Enterprise-wide risk management (ERM) is a key issue for boards of directors worldwide. Its proper implementation ensures transparent governance with all stakeholders' interests integrated into the strategic equation. Furthermore, risk quantification is the cornerstone of effective risk management, at the strategic, tactical, and operational level, covering finance as well as ethics considerations. Both downside and upside risks (threats and opportunities) must be assessed to select the most efficient risk control measures and to set up efficient risk financing mechanisms. Only thus will an optimum return on capital and a reliable protection against bankruptcy be ensured, i.e. long-term sustainable development.
Within the ERM framework, each individual operational entity is called upon to control its own risks, within the guidelines set up by the board of directors, whereas the risk financing strategy is developed and implemented at the corporate level to optimize the balance between threats and opportunities, systematic and non-systematic risks, pre- and post-loss financing and finally retention and transfer.
However, those risk reduction measures, including risk avoidance, that entail substantial investments and financial impacts may have to be decided at the top management level for approval within the global financial strategy.
However daunting the task, each board member, each executive and each field manager must be equipped with the toolbox enabling them to quantify the risks within his/her jurisdiction to the fullest possible extent and thus make sound, rational and justifiable decisions, while recognizing the limits of the exercise. Beyond traditional probability analysis, used by the insurance community since the 18th century, the toolbox offers insight into new developments like Bayesian expert networks, Monte Carlo simulation, etc., with practical illustrations on how to implement them within the three steps of risk management: diagnostic, treatment and audit.
Recent progress in risk management shows that the risk-management process needs to be implemented in a strategic, enterprise-wide manner, and therefore, account for conflicting objectives and trade-offs. This means that risk can no longer be limited to the downside effect; the upside effect must also be taken into account. The central objective of global risk management is to enhance opportunities while curbing threats, i.e. driving up stockholders' value, while upholding other stakeholders' expectations. Therefore, risk quantification has become the cornerstone of effective strategic and enterprise-wide risk management.
2.1.1 Why Is Risk Quantification Needed?
The volatile context within which organizations must operate today calls for a dynamic and proactive vision aimed at achieving the organization's mission, goals and objectives under any stress or surprise. It requires a new expanded definition of “risks”. The “new” risk manager must think and look beyond the organization's frontiers, more specifically to include all the economic partners and indeed all the stakeholders of the organization. Special attention must be devoted to the supply chain, or procurement cloud, and the interdependences of all parties.
The ISO 31000:2009 standard provides a very broad definition of risk as the impact of uncertainties on the organization's objectives. It provides a road map to effective ERM (enterprise-wide risk management) rather than a compliance reference; this is why the principles and framework provide a track to explore.
But whatever the preferred itinerary, all managers will need to develop a risk register and quantify the possible or probable consequences of risks to make rational decisions that can be disclosed to the authorities and the public. In many circumstances the data available are not reliable and complete enough to open the gates for traditional probability and trend analysis, other toolboxes may be required to develop satisfactory quantification models to help decision makers include a proper evaluation of uncertainty in any strategic or operational decision.
As a reminder, we believe that the cornerstone of risk management is the risk management process completed by a clear definition of what is a risk or exposure:
- The definition of an exposure: resource at risk, peril, and consequences.
- The 3-step risk management process: diagnostic of exposures (risk assessment), risk treatment, and audit (monitor and review), the risk treatment step being further broken down into design, development, and implementation phases of the risk management program.
Therefore, quantification is the key element for strategic – or holistic – risk management, as only a proper evaluation of uncertainties allows for rational decision-making. Only a robust perspective on risk could support the design of a risk management program, both at tactical and strategic levels, for implementation at the operational level. One of the key tasks of the risk manager is to design a risk management program and have it approved.
2.1.2 Causal Structure of Risk
Risks are situations where damaging events may occur but are not fully predictable. Recognizing some degree of unpredictability in these situations means that events must be considered as random. But randomness does not mean that these events can't be analyzed and quantified!
Most of the risks that will be considered throughout this book are partially driven by a series of factors, or drivers. These drivers are conditions or causes that would make the occurrence of the risk more probable, or more severe.
From a scientific viewpoint, causation is the foundation of determinism: identifying all the causes of a given phenomenon would allow prediction of the occurrence and unfolding of this event. Similarly, the probability theory is the mathematical perspective on uncertainty. Even in situations where an event is totally unpredictable, the laws of probability can help to envision and quantify the possible futures. Knowledge is the reduction of uncertainty – when we gain a better and better understanding of a phenomenon, the random part of the outcome decreases compared to the deterministic part.
Some authors introduce a subtle distinction between uncertainty and volatility, the latter being an intrinsic randomness of a phenomenon that cannot be reduced. In the framework of deterministic physics, there is no such thing as variability, and apparent randomness is only the result of incomplete knowledge. Invoking Heisenberg's “uncertainty principle” in a discussion on risk quantification seems disproportionate. But should we do it, we understand the principle as stating that the ultimate knowledge is not reachable, rather than that events are random by nature:
“In the sharp formulation of the law of causality (if we know the present exactly, we can calculate the future) it is not the conclusion that is wrong but the premise.” (W. Heisenberg, 1969)
Risk management is maturing into a fully-fledged branch of managerial sciences dealing with the handling of uncertainty with which any organization is confronted, due to more or less predictable changes in the internal and external context in which they operate, as well as evolutions in their ownership and stakeholders that may modify their objectives.
Judgment can be applied to decision making in risk-related issues, but rational and transparent processes called for by good governance practices require that risks be quantified to the fullest extent possible. When data are insufficient, unavailable or irrelevant, expertise must be called upon to quantify impacts as well as likelihoods. This is precisely what this chapter is about. It will guide the reader through the quantification tools appropriate at all three steps of the risk management process: diagnostic to set priority; loss control and loss financing to select the most efficient methods with one major goal – long-term value to stakeholders – in mind; and audit to validate the results and improve the future.
2.1.3 Increasing Awareness of Exposures and Stakes
The analysis of recent major catastrophes outlines three important features of risk assessment. First, major catastrophes always hit where and when no one expects them. Second, it is often inaccurate to consider they were fully unexpected, but rather that they were consciously not considered. Third, the general tendency to fight against risks that have already materialized leaves us unprepared for major catastrophes.
A sound risk assessment process should not neglect any of these points. What has already happened could strike again; and it is essential to remain vigilant. What has never happened may happen in the future, and therefore we must analyze potential scenarios with all available knowledge.
The Bayesian approach to probabilities can bring an interesting contribution to this problem. The major contribution of Thomas Bayes to scientific rationality was to clearly express that uncertainty is conditioned to available information. In other words, risk perception is conditioned by someone's knowledge.
Using the Bayesian approach, a probability (i.e. a quantification of uncertainty) cannot be defined outside an information context. Roughly speaking, “what can happen” is meaningless. I can only assess what I believe is possible. And what I believe possible is conditioned by what I know. This view is perfectly in line with an open approach of risk management. The future is “what I believe is possible”. And “what I know” is not only what has already happened but also all available knowledge about organizations and their risk exposure. Risk management starts by knowledge management.
2.1.4 Risk Quantification for Risk Control
Reducing the risks is the ultimate objective of risk management, or should we say reducing some risks. Because risks cannot be totally suppressed – as a consequence of the intrinsic incompleteness of human knowledge – risk reduction is a trade-off.
Furthermore, even when knowledge is not the issue, it may not be “worth it” for an organization to attempt a loss reduction exercise, at least not beyond the point when the marginal costs and the marginal benefits are equal. Beyond that point it becomes uneconomical to invest in loss control. Then two questions will have to be addressed:
- At the microeconomic level: how to handle the residual risk, including the treatments through risk financing.
- At the macroeconomic level: or should we say at the societal level, in the situation left as is by the individual organization, are there any externalities, risks or cost to society not borne in the private transaction? In such a case the authorities may want to step in through legislation or regulation to “internalize” the costs so that the organization is forced to reconsider its initial position. A clear illustration is the environment issue: many governments and some international conventions have imposed drastic measures to clean the environment that have forced many private organizations to reconsider their pollution and waste risks.
Beyond the macro-micro distinction, there are individual variations on the perception of risk by each member of a given group; each group and the final decisions may rest heavily on the perception of risk by those in charge of the final arbitration. This should be kept in mind throughout the implementation of the risk management process. Why do people build in natural disaster prone areas without really taking all the loss reduction measures available, while at the same time failing to understand why the insurer will refuse to offer them the cover they want or at a premium they are willing to pay?
Every individual builds his own representation that dictates his perception of risks and the structural invariants in his memory help in understanding the decision he reached. His reasoning is based on prototypes or schemes that will influence the decision he reaches. In many instances, decisions are made on a thinking process based on analogies: they try to recall previous situations analogous to the one they are confronted with. Therefore, organizing systematic feedback at the unit level and conducting local debriefing should lead to a better grasp of the local risks and a treatment more closely adapted to the reality of the risks to which people are exposed.
This method should partially solve the paradox we have briefly described above, as the gradual construction of a reasonable perception of risk in all should lead to more rational decisions.4
There remains to take into account the pre-crisis situation when the deciders are under pressure and where the time element is a key to understanding sometimes disastrous decisions. Preparing everyone to operate under stress will therefore prove key to the resilience of any organization.
From a quantitative point of view, the implementation of any risk control measure will:
- Change the distribution of some risk driver, either at the exposure, occurrence, or impact level;
- Have a direct cost, related to the implementation itself; and
- Have an indirect or opportunity cost, related to the potential impact on the business.
Therefore, the cost of risks is the sum of three elements: accident losses, loss control cost, and opportunity cost.5 These elements are of course interrelated. Reaching the best configuration of acceptable risks is therefore an optimization problem, under budget and other constraints. From a mathematical point of view, this is a well-defined problem.
Of course, since loss reduction actions have an intrinsic cost, there is no way to reduce the cost of risks to zero. Sometimes, the loss control action is simply not worth implementing. The opportunity cost is also essential: ignoring this dimension of the loss control would often result in a very simple optimal solution – reducing the exposure to zero, or in other words, stopping the activity at risk! This loss control method is called avoidance, and will be discussed further.
As we will see, the quantitative approach to risks is a very helpful tool for selecting the appropriate loss control actions. But here we must be very careful as four categories of drivers can be identified:
- Controllable drivers can be influenced by a decision.
- Predictable drivers cannot really be influenced by a decision, but their evolution can be predicted to some extent.
- Observable drivers cannot be influenced, nor predicted. They can only be observed after the facts, a posteriori. Observable drivers should not normally be included in a causal risk model, since they cannot be used as levers to reduce impacts. On the other hand, they are helpful to gain a better understanding of risk and as some of these drivers are measurable they assist in piloting the risk.
- Hidden drivers cannot be measured directly, not even a posteriori, but may be controlled to some extent.
When a first set of risk models is created during the risk assessment phase, the use of observable and hidden drivers would generally be limited to the initial risk assessment, simply because they cannot assist in the evaluation of the impact of proposed loss reduction measures.
For instance, when dealing with terrorist risks, the hostility of potential terrorists cannot be measured. When dealing with operational risks, the training level and the workload of the employees certainly impact the probability of a mistake. However, this dependency is very difficult to assess. But should these drivers be ignored in risk reduction? Should a state ignore the potential impact of a sound diplomacy or communication to reduce terrorist exposure? Should a bank neglect to train its employees when striving to improve the quality of service and reduce the probability of errors?
Simply said, we must recognize that causal models of risks are partial. And, although using this type of models is a significant improvement when dealing with risk assessment, they should only be considered as a contribution when dealing with risk reduction.
2.1.5 Risk Quantification for Risk Financing
Risk financing is part of the overall medium- and long-term financing of any organization. Therefore, its main goal is derived from the goals of the finance department, i.e. maximizing return while avoiding bankruptcy, in terms of obtaining the maximum return on investments for the level of risk acceptable to the directors and stockholders. In economic terms, that means riding on the efficient frontier.
To reach this goal the organization can use a set of tools aimed at spreading through time and space the impact of the losses it may incur, and more generally taking care of the cash flows at risk. However, deciding whether it can retain or must transfer the financial impact of its risks cannot be based merely on a qualitative assessment of risks. A quantitative evaluation of risks is necessary to support the selection of the appropriate risk financing instruments, to negotiate a deal with an insurer or understand the cost of a complex financing process.
The question is to identify the benefits of building a model which quantifies the global cost of risks, thus providing the risk manager with a tool that allows him to test several financing scenarios: the benefits of quantification to enhance the process of selection of a risk financing solution. Financing is the third leg of risk management based on the initial diagnostic and after all reasonable efforts at reducing the risks have been selected. Risk financing, even more than risk diagnostic or reduction, requires an accurate knowledge of your risks. “How much will you transfer?” and “How much will you retain?” are questions about quantities, the answers to which obviously require fairly precise figures.
Insurance premiums are set on the basis of quantitative models developed by the actuaries of insurance and reinsurance companies. Thus, insurance companies presumably have an accurate evaluation of the cost of your (insurable) risks. The problem is to ensure a balanced approach at the negotiation table. It is not conceivable to have a strong position when negotiating your insurance premiums equipped with only a qualitative knowledge of your risks. You may try, but it will be difficult for you to convince an insurer.
A complex financing program is usually expensive to set up, and sometimes to maintain; therefore the organization must make sure that the risks to be transferred are worth the effort. As part of their governance duties, the board of directors will expect from the finance director a convincing justification of the proposed program both in terms of results and efforts.
Any decision concerning the evaluation or the selection of a financing tool must be based on a quantified knowledge of your risks. Defining the appropriate layers of risk to be retained, transferred, or shared involves a clear understanding of the distribution of potential losses. Deciding whether you are able to retain a €10 million loss requires that you at least know the probability of occurrence of such a loss.
Before developing any risk financing programs, the first decision concerns what risks must be financed. This issue should be addressed during the diagnostic step. Diagnostic has been extensively developed in a previous article. This step provides a model for each loss exposure and sometimes a global risk model. This model quantifies:
- The probability of occurrence of a given peril;
- The distribution of losses should the peril occur; and
- The distribution of the cumulated losses over a given period.
Developing and implementing a risk financing solution involves being able, at least, to measure beforehand the cost of retention and the cost of transfer and this is possible only by combining the risk model and a mathematical formalization of the financing tool cost.
2.1.6 Conclusion
Risk quantification is essential for risk diagnostic, risk control and risk financing. All steps of the risk management process involve indeed an accurate knowledge of the risks an organization has to face and of the levers it could use to control risks, and finally what remains to be financed.
However, under certain circumstances, an organization could still rely on qualitative assessment to identify and control its risks. For risk financing, qualitative assessment is definitely not adequate to deal with evaluating premiums, losses volatility, etc. An accurate quantification of risks is necessary for a rational risk financing.
Several motivations lead the risk manager to address the quantification of risks:
- Financial strategy: Any organization should know if its financing program is well suited for the threats it has to face, and the opportunities it may want to seize. Financing program features must be linked to the distribution of potential losses that have to be covered, and of the potential needs to finance new unexpected projects. Answers to these two questions cannot be based on qualitative assessment of risks. Quantitative risk models are the basic tools to run an efficient analysis of this issue.
- Insurance purchasing: When an organization has to negotiate with insurers or insurance brokers, it has to be aware of the risks it wants to transfer and more precisely of the distribution of the potential losses that could be transferred. If the insurers rely on internal quantitative models generally based on actuarial studies or on expert knowledge (especially for disaster scenarios), the organization should have a more accurate knowledge of its own risks, at least for exceptional events which would not be represented in insurance companies' databases. Therefore both insurers and organizations must share their knowledge to build an accurate model of risks.
- Program optimization: The optimization of an existing financing program or the design and selection of a new one require building quantitative models. In the first case, the quantitative model will help to identify the key financing features required to improve the organization coverage. In the second case, plugging the different financing alternatives with the risk model will give the organization a clear view of the risks it would have to retain and transfer.
However, modeling the risks may prove insufficient if we want to address the three challenges listed above. We also have to model the financing program. A general framework can be developed where any financing program can be considered as a set of elementary financing blocks and then used as a base model for the present financing program. This model should suffice for many of the classical financing tools – self-insurance and informal retention, first line insurance, excess insurance, retro-tariff insurance, captive insurer, cat bonds – but it should be adapted to take into account a complex financing set up.
But even if an organization did its best and built an accurate model of risks and financing tools and even if it is able to evaluate the theoretical premium it should pay, the market will decide the actual price the organization should pay to transfer its risks. This market may be unbalanced for some special risks. When the insurance offer is tight, actual premiums could differ from theoretical primes calculated by models. This does not invalidate the need for accurate quantification as, even if the final cost of transfer depends on the insurance market, the organization should be aware of that fact and assess the difference. Also, the liquidity of the insurance markets is likely to increase as they become connected with the capital markets. The efficiency of these markets leads us to expect that the price to be paid for risk transfer will tend to be the “right” one.
Reference
W. Heisenberg (1969), Der Teil und das Ganze. Munich: Piper. English: Physics and Beyond: Encounters and Conversations. A.J. Pomerans, trans. (New York: Harper & Row).
2.2 BRIEF OVERVIEW OF CINDYNICS
Georges-Yves Kervern
Formerly Ancien Élève de l'Ecole Polytechnique, and founder of Cindynics
Jean-Paul Louisot
Formerly Université Paris 1 Panthéon-Sorbonne, Directeur pédagogique du CARM Institute, Paris, France
One of the major difficulties for a risk manager is not only to identify and quantify the emerging risks, the known-unknowns, but also to imagine those that are not yet emerging, the unknown-unknowns. For that brainstorming exercise there is no relying on past events, on data bank and mathematical models that have no basis to be developed. Even systems safety approaches fall short of a total vision as they incorporate human elements as components of the system with their own rate of failure, but fail to really take account of what is now known as the “human factor”. The human element is part of the system, but he acts also to modify it for his benefit. Understanding everyone's motivation and point of view is essential to foresee what may contribute to future risks, opportunities and threats.
It is with this objective in view that some French scientists and executives, led by Georges-Yves Kervern, developed a new approach to foreseeing, rather than forecasting, future developments when they imagined the “hyperspace of danger” and founded what they called Cindynics.
Since the early 1990s, a group of practitioners gathered around Jean-Luc Wybo, a professor at the École Nationale Supérieure des Mines de Paris, to develop practical examples of using Cindynics to understand past complex events and project their findings for future action and decision making. Their application included “Explosion”, for example, the explosion at the AZF factory on September 22, 2001 in France; “Pollution”, like that on the beaches of Brittany, “Social Unrest” events, as occurred in the suburbs in France, to name but a few.
Some trace the first step in Cindynics6 to the earthquake in Lisbon. Science starts where beliefs fade. The earthquake in Lisbon in 1755 was the source of one of the most famous polemic battles between Voltaire and Jean-Jacques Rousseau. The main result was the affirmation that mankind was to refuse fate. This is reflected in Bernstein's7 comment “Risk is not a fate but a choice.”
In a way, the Lisbon episode may well be the first public manifestation of what is essential in managing risks: a clear refusal of passively accepting “fate”, a definite will to actively forge the future through domesticating probabilities, thus reducing the field of uncertainty.
However, since the financial crisis of 2008, black swans or fat tails represent a major challenge to all professionals in charge of the management of organization. Clearly, the traditional approaches to identifying and quantifying uncertainties based on probability or trend analysis are at a loss in a world that changes fast and may be subject to unexpected, and sometimes unsuspected ruptures.
As a matter of fact, these “dangerous or hazardous” situations can develop into opportunities or threats depending on how the leadership can anticipate them and exploit them for the benefit of their organization, and its growth in a resilient society.
Human factors are a key factor in the anticipation and development of such situations. Although it is essential that decision-makers learn to make decisions under uncertainty, it is far from sufficient to prepare for the black swans. Furthermore, system safety approaches that consider the human component as a physical element fall short of taking into account the fact that humans are part of a complex system that they influence and try to change to their benefit; and the system can be affected and modified even through a simple act of observation.
In such a volatile situation, the concepts developed as early as the late 1980s could prove very valuable if properly used and translated into practical tools, even though they may appear at first to be too conceptual for practical application. As a matter of fact the concepts of “Cindynic situation” and “hyperspace of danger” allow for the identification of divergences between groups of stakeholders in a given situation and thus allow for the anticipation of “major uncertainties” and to be able to work on them to reduce their likelihood and/or their negative consequences (threats) while enhancing the positive consequences (opportunities).
This scientific approach to perils and hazards was initiated in December 1987 when a conference was called at the UNESCO Palace. The name “Cindynics” was coined from the Greek word “kindunos”, meaning hazard. Many industrial sectors were in a state of shock after major catastrophes like Chernobyl, Bhopal, and Challenger. They offered an open field for experience and feedback looping. Since then, Cindynics continues to grow through teaching in many universities in France and abroad. The focal point is a conference organized every other year. Many efforts have been concentrated on axiology and attempts at objective measures. Before his death in December 2008, Professor Georges-Yves Kervern reviewed the presentation that follows (see bibliography) in the light of the most recent developments in Cindynics through the various Conferences, until September 2008.
2.2.1 Basic Concepts
The first concept, situation requires a formal definition. This in turn can be understood only in the light of what constitutes a peril and hazards study. According to the modern theory of description, a hazardous situation (Cindynic situation) can be defined only if:
The field of “hazards study” is clearly identified by
- Limits in time (life span).
- Limits in space (boundaries).
- Limits of the actors' networks involved.
The perspective of the observer studying the system. At this stage of the development of the sciences of hazards, the perspective can follow five main dimensions.
-
First dimension: Memory, history – Statistics (the space of statistics)
This consists of all the information contained in the data banks of the large institutions, feedback from experience (Electricity of France power plants, Air France flights incidents, forest fires monitored by the Sophia Antipolis Centre of the École des Mines de Paris, claims data gathered by insurers and reinsurers).
-
Second dimension: Representations and models drawn from facts – Epistemic (the space of models)
This is the scientific body of knowledge that allows for the computation of possible effects using physical and chemical principles, material resistance, propagation, contagion, explosion and geo-Cindynic principles (inundation, volcanic eruptions, earthquake, landslide, tornadoes and hurricane, for example).
-
Third dimension: Goals and objectives – Teleological (the space of goals)
This requires a precise definition by all the actors, and networks involved in the Cindynic situation of their reasons for living, acting and working.
In truth, it is an arduous and tiresome task to express clearly why we act as we act, what motivates us. However, it is only too easy to identify an organization that “went overboard” only because it lacked a clearly defined target. For example, there are two common objectives for risk management “survival” and “continuity of customer (public) service”. These two objectives lead to a fundamentally different Cindynic attitude. The organization, or its environment, will have to harmonize these two conflicting goals. It is what we call “social transaction”, which is hopefully democratically solved.
-
Fourth dimension: Norms, laws, rules, standards, deontology, compulsory or voluntary, controls, etc. – Deontological (the space of rules)
This includes all the normative sets of rules that make life possible in a given society. For example, the need for a highway code was felt as soon as there were too many automobiles to make it possible to rely on courtesy of each individual driver: the code is compulsory and makes driving on the road reasonably safe and predictable. The rules for behaving in society, like how to use a knife or a fork when eating, are aimed at reducing the risk of injuring one's neighbor as well as a way to identify social origins.
On the other hand, there are situations in which the codification is not yet clarified. For example, skiers on the same track may be of widely different expertise thus endangering each other. In addition some use equipment not necessarily compatible with the safety of others (cross country skis and snowboards, etc.). How to conduct a serious analysis of accidents on skiing domains? Should experience-drawn codes be enforced? How can rules be defined if objectives are not clearly defined beforehand? Should we promote personal safety or freedom of experimentation?
-
Fifth dimension: Value systems – Axiological (the space of values)
It is the set of fundamental objectives and values shared by a group of individuals or other collective actors involved in a Cindynic situation.
As an illustration, when the forefathers declared that “the motherland is in danger”, the word motherland, or “patria” (hence the word patriot), meant the shared heritage that, after scrutiny, can be best summarized in the fundamental values shared. The integrity of this set of values may lead the population to accept heavy sacrifices. When the media use the word apocalyptic or catastrophic, they often mean a situation in which our value system is at stake.

Figure 2.1 Hyperspace of Danger – the result of the look.
These five dimensions, or spaces, can be represented on a five-axis diagram and Figure 2.1 is a representation of the “hyperspace of danger”.
In combining these five dimensions in a different way – these five spaces – one can identify some traditional fields of study and research.
Combining facts (statistics) and models gives the feedback loop so crucial to most large corporations' risk managers.
Combining objectives, norms and values leads to practical ethics. Social workers have identified authority functions in this domain. These functions are funded on values that frame the objectives and define norms that they enforce hereafter. If there is no source of authority to enforce the norms, daily minor breaches will soon lead to major breaches and soon the land will dissolve into a primitive jungle.
This new extended framework provides a broader picture that allows visualizing the limitations of the actions too often conducted with a narrow scope. Any hazard study can be efficient only if complete, i.e. extended to all the actors and networks involved in the situation. Then, the analysis must cover all of the five dimensions identified above.
2.2.3 Dysfunctions
The first stage of a diagnostic to be established as described above consists in identifying the networks and their state in the five dimensions or spaces of the Cindynic model. The next step will be to recognize the incoherencies, or dissonances, between two or several networks of actors involved in a given situation.
These dissonances must be analyzed from the point of view of each of the actors. It is therefore necessary to analyze dissonances in each dimension and between the dimensions. In this framework, the risk control instrument we call prevention is aimed at reducing the level of hazard in any situation. In a social environment, for example, some actors may feel that an “explosion is bound to occur”. This is what is called the Cindynic potential. The potential increases with the dissonances existing between the various networks on the five spaces.
A prevention campaign will apply to the dissonances: an attempt at reducing them without trying to homogenize all five dimensions for all the actors. A less ambitious goal will be to attempt to develop for each dimension a “minimum platform” shared by all the actors' networks thus ensuring a common set of values as a starting point. In other words, it is essential to find:
- Figures, facts or data, accepted by the various actors as a statistical truth.
- Some models, as a common body of knowledge.
- Objectives, that can be shared by the various actors.
- Norms, rules or deontological principles that all may agree to abide by.
- Values, to which all may adhere, like solidarity, no exclusion, transparency and truthfulness.
The minimum foundation is to establish a list of points of agreement and points of disagreement. Developing a common list of points of disagreement is essential.
The definition of these minimum platforms is the result of:
- Lengthy negotiations between the various actors' networks; and, more often
- One particular network that acts as a catalyst or mediator. It is the coordinator of the prevention campaign for the entire situation.
The “defiance” between two networks, face to face, has been defined as a function of the dissonances between these two networks following the five dimensions. Establishing confidence, a trusting relationship, will require the reduction of the dissonances through negotiations, which will be the task of the prevention campaign. This process can be illustrated by three examples.
Family systematic therapy: Dr. Catherine Guitton8 focused her approach on dissonances between networks:
- The family requesting therapeutic help.
- The family reunited with the addition of two therapists.
When healing is reached on the patient pointed to by the family, the result was obtained thanks to work on the dissonances rather than a direct process on the patients themselves.
Adolescents and violence: Dr. M. Monroy's9 research demonstrates that violence typically found in the 15–24 age group is related to a tear, a disparity along the five dimensions. This system can be divided into two sub-systems between which a tremendous tension builds up.
- The traditional family with its set of facts, models, goals, norms and values.
- An antagonistic unit conceived by the adolescent, opposed, often diametrically and violently, to the “family tradition”.
These dissonances can lead the adolescent to a process of negotiation and aggression with violent phases in which he will play his trump card, his own life. From this may stem aggressions, accidents and even, sometimes, fatal solutions of this process of scission, specific to adolescence.
The case of the religious sects: It is during this process of scission that the success of some sects in attracting an adolescent following may be found. Their ability to conceal from the adolescents their potential dangers comes from the fact they sell them a ready-made “turn-key” hyperspace. The kit, involving all five dimensions, is provided when the adolescent is ripe. As a social dissident, any adolescent needs to develop his own set of references in each of the five dimensions.
Violence in the sects stems from the fact that the kit thus provided is sacred. The sacredness prevents any questioning of the kit. Any escape is a threat to the sacredness of the kit. Therefore, it must be repressed through violence, including brainwashing and/or physical abuse or destruction, as befits any totalitarian regimes that have become masters in large-scale violence.
In a recent book on the major psychological risk (see Bibliography) where the danger genesis in family is analyzed according to the Cindynic framework, Dr. M. Monroy tries to grasp all the issues by numbering all the actors involved in most of these situations.
| Network I | Family |
| Network II | Friends and peers |
| Network III | Schooling and professional environment |
| Network IV | Other risk takers or stakeholders (bike riders, drug users, delinquents) |
| Network V | Other networks embodying political and civilian society (Sources of norms, rules and values) |
| Network VI | Social workers and therapists |
This list of standard networks allows spotting the dissonances between them that build the Cindynic potential of the situation.
In the case of exposures confronting an organization, an analysis of the actors' networks according to the five dimensions facilitates the identification of the “deficits” specific to the situation. For example, the distances between what is and what should be provides an insight of what changes a prevention campaign should bring about. These deficits should be identified through a systemic approach of hazardous situations. It can be:
- Total absence of a dimension or even several (no data available).
- Inadequate content of a dimension (an objective such as “let us have fun”).
- Degeneration, most often a disorder, of a dimension (Mafia model in Russia).
- Blockade in a plan combining two dimensions:
- Blockade of feedback from experience (dimensions statistics and models).
- Ethical blockade of authority functions insuring that rules are respected in the social game (dimensions norms and values).
- Disarticulated hyperspace in the five dimensions creating isolation, lack of cohesiveness between the dimensions. (Fiefdoms splitting a corporation).
These deficits always appear in reports by commissions established to inquire on catastrophes. It is striking to realize how all these reports' conclusions narrow down to a few recurring explanations.
How do these situations change? Situations with their dissonances and their deficits “explode” naturally unless they change slowly under the leadership of a prevention campaign manager.
In the first case, non-intentional actors of change are involved. The catastrophic events taking place bring about a violent and sudden revision of the content of the five dimensions among the networks involved in the “accident”. Usually all five dimensions are modified: revised facts, new models, new goals, implicit or explicit, new rules, and new values.
In the second case, that all organizations should prefer, the transformer chooses to act as such. He is the coordinator of the negotiation process that involves all the various actors in the situation. Deficits and dissonances are reduced through “negotiation” and “mediation”. The Cindynic potential is diminished so that it is lower than the trigger point (critical point) inherent to the situation.
2.2.3 General principles and axioms
Exchanges between different industrial sectors, Cindynic conferences and the research on complexity by Professor Le Moigne10 (University of Aix en Provence, derived from the work of Nobel Prize winner, Herbert A. Simon11) have developed some general principles. The Cindynic axioms explain the emergence of dissonances and deficits.
- CYNDYNIC AXIOM 1 – RELATIVITY: The perception of danger varies according to each actor's situation. Therefore, there is no “objective” measure of danger. This principle is the basis for the concept of situation.
- CINDYNIC AXIOM 2 – CONVENTION: The measures of risk (traditionally measured by the vector Frequency – Severity) depend on convention between actors.
- CINDYNIC AXIOM 3 – GOALS DEPENDENCY: Goals are directly impacting the assessment of risks. The actors in the networks may have conflicting perceived objectives. It is essential to try to define and prioritize the goals of the various actors involved in the situation (insufficient clarification of goals is a current pitfall in complex systems).
- CINDYNIC AXIOM 4 – AMBIGUITY: This states that there is always a lack of clarity in the five dimensions. It is a major task of prevention to reduce these ambiguities.
-
CINDYNIC AXIOM 5 – AMBIGUITY REDUCTION: Accidents and catastrophes are accompanied by brutal transformations in the five dimensions. The reduction of the ambiguity (or contradictions) of the content of the five dimensions will happen when they are excessive. This reduction can be involuntary and brutal, resulting in an accident, or voluntary and progressive achieved through a prevention process.
The theories by Lorenz on chaos and Prigogine on bifurcations offer an essential contribution at this stage. It should be noted that this principle is in agreement with a broad definition of the field of risk management. It applies to any event generated or accompanied by a rupture in parameters and constraints essential to the management of the organization.
- CINDYNIC AXIOM 6 – CRISIS: This states that a crisis results from a tear in the social fabric. This means a dysfunction in the networks of actors involved in a given situation. Crisis management exists in an emergency reconstitution of the networks. It should be noted that this principle is in agreement with the definition of a crisis as included here above and the principle of crisis management stated.
- CINDYNIC AXIOM 7 – AGO-ANTAGONISTIC CONFLICT: Any therapy is inherently dangerous. Human actions, medications are accompanied with inherent dangers. There is always a curing aspect, reducing danger (cindynolitic), and an aggravating factor, creating new danger (cindynogenetic).
The main benefit of the use of these principles is to reduce the time lost in fruitless unending discussions on:
- The accuracy of the quantitative evaluations of catastrophes – Quantitative measures result from conventions, scales or unit of measures (axiom 2);
- Negative effects of proposed prevention measures – In any action positive and negative impacts are intertwined (axiom 7).
2.2.4 Perspectives
In a Cindynic approach, hazard can be characterized by:
- Various actors' networks facing hazardous situations.
- The way they approach the whole situation.
- The structuring of these approaches following the 5 dimensions (Statistics, models, objectives, norms and values).
- The identification of “dissonances” between the various actors' networks.
- The deficits that impact the dimensions.
Dissonances and deficits follow a limited number of “Cindynic principles” that can be broadly applied. They also offer fruitful insights to measures to control exposures that impact the roots of the situation rather than, as is too often the case, reduce only the superficial effects.
For more than a decade now, the approach has been applied with success to technical hazards, acts of God and more recently on psychological hazards in the family and in the city. It can surely be successfully extended to situations of violence (workplace, schools, neighborhoods, etc.). In some cases, it will be necessary to revisit the 7 principles to facilitate their use in some specific situations.
The objective is clear: Situations that could generate violence should be detected as early as possible, they should then be analyzed thoroughly, their criticality reduced and, if possible, eliminated.
Cindynics offer a scientific approach to anticipate risks, act and improve the management of risks. Thus, they offer a new perspective to the risk management professional, they dramatically enlarge the scope of his/her action in line with the trend towards holistic or strategic risk management while providing an enriched set of tools for a rational action at the roots of danger.
Bibliography
Kervern, G-Y. (1993) La Culture Réseau (Ethique et Ecologie de l'entreprise), Paris: Editions ESKA.
Kervern, G-Y. (1994) Latest Advances in Cindynics. Economica.
Kervern, G-Y. (1995) Éléments fondamentaux des cindyniques. Economica.
Kervern, G-Y. and Rubise, P. (1991) L'archipel du danger. Introduction aux cindyniques. Economica.
Kervern, G-Y. and Boulenger, P. (2008) CINDYNIQUES Concepts et mode d'emploi. Economica.
Kervern, G-Y. The Evil Genius in Front of the Risk Science: The Cindynics. Risque et génie civil. Colloque, Paris, France (08/11/2000).
Wybo, J-L. et al., Introduction aux Cindyniques. Paris (France): ESKA, 1998.
2.3 RISK ASSESSMENT OR EXPOSURE DIAGNOSTIC
Jean-Paul Louisot
Formerly Université Paris 1 Panthéon-Sorbonne, Directeur pédagogique du CARM Institute, Paris, France
2.3.1 Foreword
The purpose of this article is to zoom in on a subject not really addressed in the RM Standards published worldwide, including ISO 31000; it proposes a practical tool for identifying, analysing and prioritizing the portfolio of exposures, and opportunities, as well as threats that confront any organization that envisions its future.
The “space of exposure” will prove a powerful tool for all embarking in the ERM (Enterprise-wide journey) to help “lift the fog of uncertainties in decision making and implementing” to paraphrase a recurring theme in Felix Kloman's12 conferences and presentations.
2.3.2 Threats and Opportunities: How to deal with uncertainty in a changing world?
The future is never known with certainty, “Who knows what tomorrow will bring?” but managing organizations means making decisions, enlightened by information drawn from different methods that shed light on the future.
For a long time, men have tried to improve tomorrow by influencing the forces that guide the future, or by offering sacrifices to the gods. It was only at the end of the seventeenth century, that Pascal and Fermat and their successors, including Bernoulli, started developing ways to open the gates to the future by drawing from past and present experiences. Probability and trend analysis were the first approaches to see through the “cloud of unknowing”.13
During the last decade of the twentieth century, the development of risk management, resting on more elaborate forecasting models, seems to have focused on only the downside aspect of risk, the threats, and has slowly put aside the upside, usually called “opportunities”. Confronted with the uncertainties of the future, organizations are rediscovering that “threats” and “opportunities” – the yin and the yang of risk – represent two sides of the same coin.
It has never been more important that directors and officers, as well as investors, remember the basics of economic and financial theories. Risk is inherent to the undertaking of any human endeavor. Indeed, it is the acceptance of a significant level of risk that provides the type of return on investment that is expected by investors. The theory of finance defines the expected rate of return as the sum of two components:
Basic return, of the risk less investment (usually measured by the US treasury bond rate of similar maturity); and
The risk premium, i.e. an additional return that the investor deserves for having accepted a higher volatility of profit, to enhance some societal goal, like improved technology, a new drug, etc.
Of course, all volatilities are not “equal”. Traditionally, scientific authors distinguish between probabilistic future (risk) and non-probabilistic future (hazard).
Most of the time, deciders are in the first situation (risk) when they have enough reliable data to compute law of probability or draw a trend line for future events and can define confidence intervals, i.e. limits between the likely and the unlikely future. For example, in analysing past economic conditions, it should be possible to have a reasonable idea of the numbers of cars to be sold in the EU, in the US or in Australia. The booming and recent Chinese market may not lend itself easily to this type of reliable trending. While an automobile company can predict with a fair degree of precision its mature market, forecasts are far more volatile in emerging markets. Therefore, there is a higher risk to market cars in emerging markets, but the reward may be much higher in case of success.
On the other hand, when launching a new model, especially if some defects are revealed in the first year of sales, it is much more difficult to justify the investments if reliable forecasts can prove the existing models will be profitable. Banks have experienced a similar situation when they embarked on the management of operational risks to comply with the new Basel II14 requirements. When no data bank is at hand, experts' opinions will have to be formalized using a Bayesians network15 approach and scenarios.
As a matter of fact the above examples might be considered as incorrect for looking only at the negative side of risks. However, operational risks are also a significant opportunity for competitive advantage for the banks that invest more than others in this endeavor. Not only are banks likely to “save” on internal funds, they may even gain expertise that could benefit their clients in the longer term.
A current trend in risk-management is to minimize risk silos in order to reach a real global optimization of the management of risk, taking into account for each unit, each process, each project both threats and opportunities. The organization is analysed as a portfolio of risks with an upside and downside that must be optimized, much as an investor would optimize a personal portfolio of shares.
In practice, this integration of all risks is achieved more easily for the financial consequences at the risk financing level. More and more economic actors consider their risk financing exercise as part of their overall long-term financial strategy. However, it is possible to integrate risk assessment and loss control provided all in charge (at whatever level) are included in the risk management process. This integrated approach is now called ERM and within ERM the managers become “risk owners”. The globalization of risk management is ensured through the principle of subsidiarity: the directors and officers should deal only with the exposures that have impact on the strategy, assured that the risk management process implemented throughout the organization will take care of “minor” threats and seize “tactical” opportunities. That should sound familiar to many in Australia, as this is a fundamental tenet of management guidelines in the Australian/New Zealand Framework (companion to AS/NZ 4360 used in various versions since 1995 and finally replaced since 2009 by the adoption of ISO 31000 under the name AS/NZ 31000:2009).
What Do We Mean by Risk?
Risk management, risk mitigation and risk financing – indeed the word “risk” is used by all risk management professionals as well as by many others in their daily life. But do we really know what we mean by risk? The Australian RM standard states, “…the chance of something happening that will have an impact on objectives”, whereas ISO 31000 proposes an even wider definition: “the effect of uncertainties on objectives”. But this is not the final word because there are other common understandings of the word risk.
Risk (pure, speculative, hybrid)
This definition is most commonly used by specialists, which is compatible with the definition of risk in the ISO 31000:2009 standard, depending on the nature of the consequences involved.
Systematic and Unsystematic Risk
Systematic risk (i.e. non diversifiable) is the result of non-hazardous causes that may happen simultaneously. That means that it does not lend itself to diversification. As an example, all economic actors can be affected by a downturn in the economy or a rise in interest rates.
Unsystematic risk (i.e. diversifiable) is the result of hazardous causes and lends itself to probabilistic approaches. They are specific to each individual economic entity and offer the possibility to build a “balanced portfolio” of risk sharing. Therefore, insurance cover might be designed to cover them.
Insurable Risk
This is a more restrictive definition as it refers to an event for which there is an insurance market. Furthermore the work “risk” is used commonly by insurance specialists to refer to the entity at risk, the peril covered, the quality of the entity risk management practices (level of risk), and the overall assessment of a site (“good risk for its category”).
One must be cautious because this commonly used word may have totally different meanings for different individuals. This requires all involved to be aware of that diversity when communicating and consulting in the boardroom or with different stakeholders.
This reality must be kept in mind when communicating about risks, whatever the media or audience. Any “risk management” professional should be always aware of one of the main challenges and hazards of risk awareness and understanding: how risk is perceived by stakeholders and decision makers is more important than any “scientific” assessment of risk. Recommendation: Whenever possible avoid using such an uncertain word; another, less common, should be substituted: exposure, threat, opportunity, peril, impact, etc., are acceptable alternatives but there is a caveat here as well – the use of any term depends on which facet of “risk” is the subject of the discussion! Sometimes, a specifically crafted professional word needing some explanation may prove safer than a commonly used word that may be understood differently within a group. A common taxonomy of terms is vital not only for understanding but also in developing consistent data across the organization.
What is an Exposure?
The word “risk” has several meanings and can be misleading when used in a professional context, especially in the case of an organization communicating on risks with a broader audience. Therefore, practitioners and academics in risk management need to define a more precise concept. This is what George Head, who developed the Associate in Risk Management designation, attempted with the word “exposure” as early as 1975. However Head's definition considered only the downside of risks. A new definition more appropriate for today's global approach is required:
An exposure is characterized by the consequences on its objectives resulting from the occurrence of an unexpected (random) event that modify the resources of an organization.
This definition allows for an exposure to be clearly identified with three factors:
- Risk Object: The resource “at risk” that the organization needs to reach its goals and missions. We have defined 5 classes of resources: Human, Technical, Information, Partners and Finance as well as the expression “Free” for those taken from the environment without a payment (externalities)(these classes are reviewed below).
- Random Event (Peril): It is “what” may happen that would modify permanently or temporarily the level of the organizational resources resulting either in an opportunity (sudden increase in the level or quality of the resource) or a threat (sudden decrease in the level or quality of the resource). The likelihood of the event will lead to a measure of the “frequency”.
- Potential Impact (Severity): Most organizations strive to quantify the financial impact of the exposure identified through the resources “at risk” and random events. However, the goals and objectives of a given organization are not all necessarily translatable in financial terms. For example: ethics and corporate social responsibilities must be also taken into account. However, one should keep in mind that the “severity” is nearly always measured in financial terms.
However, it should be noted that not all consequences touch only the organization under
study; therefore, especially for the downside risk, it is essential to distinguish:
- Primary & Secondary damages: i.e. the impact on the organization itself and its resources through a loss of assets or potential loss of revenues.
- Tertiary damages: i.e. the impacts on all third parties and the environment. Special attention should be given to impacts on the organization's partners (both downstream, customers or clients, upstream, suppliers or subcontractors, and temporary for special projects). The analysis should extend to all consequences and not be limited to liabilities, as long-term consequences with no immediate legal implication can prove costly, specifically for reputation. On the other hand “tertiary damages” involving contractual, tort or penal liabilities will impact the organization's resources through its executives, employees, finances and even its “social licence to operate”.
- “Quaternary” damages: those long-term impacts on the trust and confidence of “stakeholders” that may eventually taint or destroy the organization's reputation, and its “social licence to operate”.
In a complete analysis, the upside risk should be included, as the threats to one organization may well create an opportunity for another organization!
Once the concept of “exposure” is clearly mastered, it provides a model to develop a systematic approach to managing risks. As a result, any organization will be seen as a portfolio of exposures, with a special attention to those that represent challenges to the optimal implementation of a strategy. The risk register suggested by the Australian standards appears as a list of “risk assets”. Therefore, the decision tools developed in finance for the management of investment portfolios – the portfolio theory – are pertinent towards implementing a rational decision making process in risk management that will ultimately lead to sound governance.
Once again, the concept of exposure constitutes a step towards the integration of risk management in an organization's strategic process by leveraging opportunities and mitigating threats, not only as they are anticipated at the development stage but also as they materialize along the path of the implementation towards achieving strategic goals.
What are the Resources at Risk?
Any organization can be defined as a dynamic combination of resources pulled together to reach its goals and objectives. Therefore, developing and communicating these objectives is at the heart of any risk management, indeed any management, exercise. This is the reason why, for risk management purposes, we have defined an organization as a portfolio of exposures, both threats and opportunities, to be managed in the most efficient manner to reach these goals and objectives under any circumstances. Within the context of a competitive economy, efficiency means either to reach the most ambitious objectives with the available resources or reach the assigned goals with as little resource as possible.
While many would agree on this simple approach, it must be determined how many classes of resources should be considered. The model proposed here is limited to a small number of classes, five, that will take into account practically all the resources involved in the management of an organization, which can be used to list the resources in a specific organization. This will permit a systematic and global identification because the classes of exposures will be directly linked to the classes of resources. Each of these classes calls for specific forms of loss control measures. Thus, the five classes of resources are as follows:
- H = Human: This includes all personnel linked to the organization through a labor or an executive contract. Their specific experiences and competencies are an asset for the organization although they are not always assessed and valued in the accounts. For this resource, elements like age, gender, and marital status that may have an impact on the actual capacities should be carefully monitored. In other words, the exposure associated with the human resources should be investigated both as key persons, and labor costs, or social liability (pensions and employee benefits). The main element to risk management is linked with what is now usually known under the term “knowledge management” and sometimes talent management. Therefore, it does not refer only to technical skills but also to social skills and attitude that are essential to embedding risk management throughout an organization.
- T = Technical: These are buildings, equipment and tools, i.e. all physical assets under the direct control of the organization. The legal status of those assets is of secondary importance; the organization may own, lease, rent them or simply keep them for a third party. What is essential is that the organization has complete responsibility for those items. Even if there are contractual terms over how to manage them, the organization is completely in charge of the management of risks to them and from them.
-
I = Information: All the information that flows throughout the organization, in whatever form (electronic, paper, and human brains). This may cover information concerning the organization itself, information regarding others (medical files for patients in a hospital) but also what others may want to try to know, and what the organization wants to know about others (economic intelligence of different forms). Also included are intangibles like goodwill, credit score, rating agency evaluation, and other financial or cross-discipline metrics.
Furthermore, the ability to do business depends on the trust established with others: the perception that all the stakeholders have of the organization is an essential “asset”, the risks to reputation have become an important item in boards' risk agendas.
- P = Partners (upstream and downstream): They are all the economic partners that the organization is intertwined with (and recognized by the World Economic Forum) and specifically upstream (suppliers, service providers and sub-contractors), and downstream (customers and distribution channels). Of those some are key, those without which the organization could not continue to operate, or operate efficiently, and they must be identified clearly if the dependencies on the supply chain are to be treated appropriately. It is an essential source of exposure in an economy where outsourcing has become so important. In some organizations they include volunteers contributing their time and talent, sometimes money, to the organization.
- F = Financial: This comprises all the financial streams that flow in and out of the organization, short-term (cash, liquid assets, short-term liabilities) and medium or long-term (capital and reserve, long-term debt, project financing, etc.). In other words, all the risks linked with the financial strategy of the organization and the balance between return and solvency.
- Free Resources = However, the analysis would fall short if the organization did not take into account its non-contractual exchanges with the environment, i.e. those resources that the organization does not pay directly for and yet that could prevent it from operating smoothly. In other terms, these “free resources” that do not appear in the organization accounting books and yet are essential: air quality, access to sites, social licence to operate, etc. Further investigation of those would be warranted.
2.3.3 How to Manage the Risks Derived From Partners' Resources?
Market globalization has generated ever more complex webs that link many organizations worldwide through the externalization process. The large conglomerate has become more and more focused on conception, marketing and assembling parts from all over the world. Many smaller or medium size organizations are only one cog in a very complex supply network.
In most situations, we are confronted with a network of partners rather than a chain, indeed a cloud when the frontiers are not completely defined. This is the reason why procurement risk management has become the backbone of most organizations producing goods and services, while their production relies on an ever-expanding number of outsourced tasks.
Therefore, what “partners' resources” encompass are raw materials, parts, equipment and services as well as distribution networks on which organizations depend on a daily basis for their own operations. These resources can be grouped in three distinct categories:
- Upstream resources: These are purchased by suppliers, service providers and sub-contractors, and delivered to production sites by transporters.
- Lateral resources: These are goods and services provided to clients and that are integrated in complex systems, projects and products, of which your own contribution is part. You may not know them and yet there is a de facto solidarity that links you together. As an illustration you may produce tires that match a given sort of wheel and when the manufacturer goes bankrupt, your client does not need your tires anymore.
- Downstream resources: These are customers or intermediaries, including distribution networks and the transporters that deliver the goods, and financial institutions that guarantee the successful conclusion of transactions.
It is essential to clearly identify all the elements of this class of resources while conducting a risk management assessment as the same principles apply but with a major difference that the three categories have in common: the organization is dependent for its own security on the actions and attitudes that it cannot monitor daily as is the case for the resources under its direct command. In other words, consciously or unconsciously, the organization has “transferred” to a third party an essential part of its risk management activity. Therefore, the crucial question in procurement risk management is to find ways to ensure the organization's overall resilience should one of the “partners' resources” fail to be delivered, in time and to the quality desired.
The basic rule of thumb is not to be too dependent on one given partner, be it a supplier or a customer. Basic common sense applies here: “Don't put all your eggs in the same basket.” Most recommend having at least two or three sources at all time. However, this is not always possible, especially when there is a very advanced technology, patents, or some very specific know-how that can only be obtained from one source. Furthermore, the multiple sources must be balanced against the cost of maintaining several suppliers, with the advantage of them entering a competition to retain the organization's business. Finally, there is increased risk of information leaks if the relationship involves sharing trade secrets of any sort.
Beyond, this basic principle, the same rule applies upstream and downstream, which could be called the “3 Cs” rule.
- Choose – You must choose carefully the partners you want to do business with. First, you must evaluate if the products or services offered meet your needs in quality, quantity and timely delivery. Then you must investigate their financial strength, because a partner that would fail rapidly would be of no use. Furthermore, it is essential to assess their “ethical compatibility” with your own values, specifically those you stress when exchanges with stakeholders take place (one must remember that a major sports good manufacturer went through a difficult period in 1998 during the Football World Cup when it was revealed in the media that a supplier of a supplier was using underpaid, underage children to produce the balls).
- Contract – The quality of risk management throughout the partner's operations must be contractually sealed. It is even more imperative because there is no universally accepted standard so far, contrary to quality. It must provide for your access to site and documentation to ensure that proper risk management is designed and implemented. Also, the contract should resolve ahead of their occurrence any potential conflicts so that the partnership can remain harmonious even through difficult times. For many organizations, too much time is devoted by lawyers to defining the products or services involved in a contract, too little to solving conflicts ahead of time.
- Control – It is essential that staff regularly meet with the organization's partners and be kept informed of developments to make sure they remain the reliable sources its leaders wish to deal with. You must be aware of major changes in their leadership, their ownership, their environment and their strategy.
As far as lateral resources are concerned, unless you are a project leader, which is rarely the case for small or medium size organizations, they are typically partners you have not chosen and you may have no contract with whereas each of them has a contract with the leader. Therefore, the only way to ensure the quality of the risk management is through your common partner, project leader, large firm, etc. In your dealings with the team leader, you should have access to the list of all those involved in the project you share.
Finally, remember that when you transfer risks, you are still socially responsible for the well-being of those who are stakeholders in the overall process. If a member of the team betrays their trust, all the members of the team will suffer. In other terms, risks to reputation are never transferred!
2.3.4 Are There Any “Free” Resources? Taking into Account Externalities
In our global economy, who would dare to claim that there are resources that we do not pay for? Clearly any organization needs both internal and external resources that have been detailed in a previous question. By external we mean those exchanged with the economic partners both up and down stream. These resources are paid for. However, there are also non-transactional exchanges with the environment that are essential for the organization's development, even its survival. These resources received from the environment without direct financial compensation are labeled “free resources” insofar as they do not appear on the organization's accounting documents. However, the term environment is too broad and in each situation should be investigated:
- Physical environment: Comprising air, water and earth.
- Political, legal and social environment: This requires looking at all of the aspects of life conditions and society organization, including cultural differences.
- Competitive environment: This entails looking at all aspects of the current competition, technological breakthrough, and shift in consumers' tastes, but also substitutes for the organization's products and services. Furthermore, one should always analyse the reason for the appeal of our offering; the notion of “magnet site” allows for the investigation of the circumstances outside of our management sphere that are key to our success.
These exchanges represent what economists call “externalities” that are not part of any contractual transaction with economic partners. Remember that these externalities can be positive (society receives a benefit from a private transaction, which is additional to the private transaction), or negative (society incurs a cost additional to the private transaction). It should be noted that the domain of these externalities may vary from country to country; in terms of pollution, the development of codes to protect the environment has forced the “internalization” of the costs of cleaning sites or restricting contaminant releases as private producers have seen some “social costs” transferred to their operation.
It is crucial for any organization planning to diversify or enter new markets in any locale to be aware of its needs for “free resources” as they may not be available in the prospective locations and/or countries involved. More precisely, a very successful SME might well be unaware of the specific circumstances that led to success in its original location that may not be found in the proposed sites, or lost in the case of fusion or acquisition.
The concept can be illustrated with some specific situations keeping in mind that these are only common cases and that each individual organization must conduct a systematic analysis of its circumstances:
- There are industrial processes that use substantial amounts of “cooling water”; the water is released downstream with no chemical or biological pollution, but at a higher temperature than the intake upstream. Have we imagined extreme winters (the river is frozen), summers (a temperature that is too high does not allow for a correct biological exchange or fish cannot survive at the release temperature for lack of oxygen)? In a new proposed location, is there upstream a chemical plant that could release toxics with potential damage to our installation, or a production interruption?
- Throughout the plant, the air must be of a quality compatible with human life and even satisfying local ordinances regarding “workplace conditions”. Is there a neighboring plant that could release a toxic cloud? On the other hand some production processes require the atmosphere to be totally cleaned of any dust. Is it possible that very fine particles would slip through our filters polluting our products (like optical lenses or medical devices)?
- A single historic bridge is the only direct route to a factory. After a minor earthquake, concerns are raised as to its long-term robustness. Local authorities decide to limit its access to trucks of less than 5 metric tonnes. It may be that the new route from a key supplier to the factory is so much longer that delays and costs increases make the plant “uneconomical” with no easy remedy.
- Production in a new country, with substantial gains on wages and salary costs: but is the country politically sound? Is there any threat of nationalization should an opposition party seize power? Will the “social and political” climate remain favorable to foreign investment?
- The precaution principle14 is now incorporated into the French constitution. It is not yet clear what the consequences will be for the corporation whose domicile or activities are in France. Could it be that innovative products sold in France will in the future come from foreign companies?
- Local cultures may have an impact on the way business is conducted, be it only working hours. When entering a new country, a new province, has the organization questioned its commercial and human resources practices to align them with local customs, even beyond mere compliance to local legislation?
- Do customers come to us because of the superior quality of our products or services or merely for convenience? A retailer in the commercial centre where a national brand hypermarket draws customers should ask himself such a question. But it could be also the case for a restaurant close to an industrial zone from which he draws most of his clientele; what would happen if the industrials chose to establish a restaurant for their workforce?
2.3.5 What Do We Mean by Peril or Hazard?
An organization has been defined as a portfolio of risks or exposures, i.e. threats and opportunities. Each exposure is defined by three dimensions – resource at risk, peril or hazard and impact. Thus the peril is the second of these parameters.
Some define a peril as that which gives rise to a loss whereas a hazard would be that which influences the operation of the peril, i.e. fire would be a peril, a house that could burn a hazard. For others the peril is commonly defined as the cause of loss, whereas the hazard is commonly defined as a condition that creates or increases the chance that a peril will occur.
Here for management purposes, a “peril” is an event that may or may not happen, the occurrence of which would change in a drastic manner the level of one of the organization's resources: for the downside, the resource would be destroyed partially or totally, permanently or temporarily, for the upside a sudden increase of the resource would become available. In most organizations, for risk management purposes, only the downside impact would be assessed.
The two dimension vector, resource/peril, identifies the exposure, and is the foundation for the analysis phase that investigates the impact, quantifying the financial or other consequences, without any consideration for reduction methods.
“Known” perils are qualified with a probability measured through experimental probability drawn from historical data and/or mathematical models. In other cases, the “known unknown”, only a qualitative approach will be possible for lack of reliable data as in the case of emerging risks and even more so for the “unknown unknown” fat tails or a black swan event. Under such circumstances a qualitative scale (exceptional, rare, infrequent, or frequent) could prove useful, provided the group in charge of evaluating the probabilities has a common definition for these terms (once a decade, once a year, twice a year, once a month, etc.).
Many phenomena follow normal distributions (bell-shaped curves) which are completely defined by two parameters:
- Mean or “average”, e.g. hurricanes will hit Florida 4 times a year on average.
- Standard deviation, which allows to define a confidence interval (i.e. the lower and higher level of a given phenomenon, if the standard deviation is 1, the confidence interval at 68% is that there will be between 3 and 5 hurricanes hitting Florida next year, 95% between 2 and 6, and more than 99% between 1 and 7).
For instance, from historical evidence, it is “practically” certain that Florida will be hit by at least one hurricane every year and no more than seven.
For phenomena more easily controlled than natural events, for example, the number of accidents per year in a given large fleet of vehicles, or the number of fires in plants of large multinational firms with over 2,000 sites worldwide, the occurrence of a number of events significantly outside of the confidence interval is valuable information for a long-term number of losses forecast. Depending on the sign of the deviation, improvement or deterioration, the situation will call for an explanation of this evaluation; a check on the deep-root causes.
When the peril lends itself to a quantitative probability distribution, the uncertain future is deemed “probabilistic”; in other cases it is called “non-probabilistic”. This distinction is essential as the tools available to make decisions for an uncertain future rely heavily on the quality and the risk diagnostic is aimed at improving information to make “sound” decisions.
In any case, the probability distribution of occurrence coupled with the probability distribution of impact or severity is the key to rational decision making as it allows for justifying the investments or recurring costs of proposed loss control measures as well as the premium quote by insurers.
It should be stressed that for extremely infrequent events, the average number of occurrences “in the long run” (law of large numbers), has not much meaning for the decider. In these situations, the decision will be based mostly on the impact level, the severity, and consists in reducing the probability of occurrence below a level that will be deemed acceptable by the major stakeholders. For example, when the officers in an organization managing nuclear power plants make a decision on “nuclear risks” they will assess the likelihood of a major accident occurring “tomorrow” rather than on the average cost in the long run, meaning 1 or 10 million years! They must take into account the level of probability above which the population would no longer be prepared to live close to one of their plants.
The nature of the peril will dictate the type of loss control measures that could be implemented. For instance, in the case of a vehicle fleet, if the peril is “drivers' skills”, the remedy will call for training the drivers to modify their attitude behind the wheel – i.e. defensive driving.
2.3.6 Is It Possible to Develop an Efficient Classification for Perils and Hazards?
There are many ways to classify the events that may occur to alter the state of affairs on which an organization formed its strategic decisions. Some would look at the causes, others at the consequences. An analogy that is useful to consider here is the knot of the bow tie rather than the two wings. The classification proposed has no scientific pretension; rather it focuses on providing the risk management professional with a first approach to what loss control instruments might prove appropriate to mitigate the exposure at hand. Perils and hazards are classified under two criteria:
Where the hazard or peril originates
- Endogenous: The origin is found within the organization itself, i.e. within the perimeter it controls (be it physical or procedural). For example, it can be a fire in the premises or an employee going around procedure to wire money to an offshore account. The solution must be found within the organization, and prevention will be often the best approach.
- Exogenous: The origin is found outside of the organization, i.e. outside the perimeter it controls (be it physical or procedural). For example: a strike in a nearby facility, with employees occupying the premises thus preventing access of own employees to the building; a long haul drivers' strike; water pollution due to a chemical spill preventing a brewery from continuing its production. The solution must be initiated by third parties if the probability is to be reduced. Internally, “Plan B” will be the key to loss control, from business continuity planning to disaster recovery and including strategic redeployment planning in the worst-case scenario.
1 THE NATURE OF THE HAZARD OR PERIL
- Economical: The event would be a dramatic change in an economic parameter in the organization's environment creating an unexpected opportunity or a substantial threat. It could be the bankruptcy of a major global competitor opening new markets, a change in the currency exchange rate affecting long-term prospects, a change in consumers' tastes …to name but a few. Clearly, forecasts and attentive global economy monitoring are keys to efficient reaction.
- Natural: It would typically take what some insurance policies call an “act of God”, for example, a hurricane, earthquake, flood or tsunami, not to speak of global warming: too vague a term to be split into its different consequences to be treated. Clearly, prevention is not an option as there is no way to “prevent” a volcano from erupting or a hurricane from forming. That does not mean that a study of data and some scientific evidence would not help in choosing more suited sites and better prepare for what might happen someday. Therefore, pre-event and post-event loss reduction measures are going to be the appropriate mitigation routes. One reminder with natural disaster: the key to choosing the proper investment can be found in a phrase that summarizes the sequence TAI or “Threat, Alert, Impact”. The longer the time elapse between the elevation of the degree of probability (Threat) and the actual strike (Impact) the easier it will be to prepare when the event becomes very likely, which means that investment on loss reduction measures can be channelled to high velocity risks where action prior to any development is essential (compare an earthquake with a flood near the mouth of a river).
- Industrial: These are all the events that result from the overall human economic activity, without the direct implication of human elements in the actual scenario. It could be fire, water damages (other than flood), machinery breakdown, etc. In other terms those are typically non-systematic risks for which the insurance industry is well equipped, both in terms of financial risk sharing and in loss control. Insurance companies have developed a robust experience in dealing with insurable risks like fire and explosion, machinery breakdown, etc. as they did it to protect their own interests as well as those of the insured in their portfolio. Therefore, insurers and reinsurers have developed elaborate competencies in this realm. They are also sometimes referred to as “accidental risks”.
- Human: These are the most common in frequency; it is rare when there is not a human element in the scenario leading to an accident, for example, like a fire in the premises where welding was conducted.
However, the human origin is not enough to understand the root cause of the phenomenon.
It must be further differentiated:
- The involuntary human peril results mainly from an error, an omission or negligence. It can induce the event immediately (a lighted cigarette thrown out on flammable material) or much later (the basement of a house in a flood area not being properly protected by a complete insulation). Finding the person responsible, pointing a finger to the “culprit” will not help. If important damages result from an “involuntary human act”, it is the system that must be reviewed and the procedures: human errors will occur and their consequences should be controlled. This is the obvious common responsibility of quality and risk management.
- The voluntary human peril results exclusively from a conscious and deliberate act from an individual or a team of individuals. However, all conscious acts are not aimed at doing harm to others; therefore we further contrast:
- The voluntary human peril: The “wise guy”, which is the unintended consequence of a legitimate action by some actors in a system. They embark on modifications aimed at improving performances and/or facilitating work. However, they do not document their modifications and the rest of the team, unaware of them, can create problems. An example provided by many organizations is the nightly inspiration of a computer specialist “improving” software but warning nobody of the changes. The cure for that resides clearly in procedures to channel the individuals' imagination and transmute it into useful opportunities. (A word of caution for those contemplating operations in France, French employees are particularly prone to the “wise guy” syndrome!).
-
The voluntary human peril: “Malicious acts” occur when an individual or a group of individuals embark on a mission to appropriate third parties' belongings or assets, be they tangible or intangible. Therefore, they are usually illegal acts, punishable in most countries where they would be performed, for instance, industrial spying, arson, forgery, assault, etc.
It is further essential to qualify the acts as to whether the individuals try to get wealthy (lucrative malice) or to further a political, religious, or ideological agenda (non-lucrative malice).
In the first case we are dealing with an enterprise, illegal but still governed by profit seeking. Therefore, these individuals make their decisions like legitimate entrepreneurs and they can be deterred by lowering the “return” on their investment (time, effort, and/or money). Strategies such as the following could work: increase the costs (prison terms, security efforts, etc.) or reduce the value (lower inventories, published information and know-how made public).
In the second case we are dealing with individuals who work for a cause (from vandals scratching cars in the wealthy section of the town to outright terrorism) and their motivations transcend economical issues. Their reasoning is much harder to crack, punish or “bring heaven to earth”. The tragic events in the USA on 9/11/2001 and also Madrid (2004) and London (2005) are all reminders of how difficult it is to fight terrorism within the framework of a democratic society.
In any case, “voluntary human perils” are always the most elusive to fight. It is important to recognize that we are confronting an intelligent mind that can and will adapt to whatever new form of loss control measure we will imagine and wait patiently to strike when our guard is lowered. One illustration would be information systems: new worms and viruses are created every day and firewalls and other protections are to be updated all the time. Furthermore, employees may become complacent if not always reminded of the uphill battle to be fought every day.
2 THE CONSEQUENCES OF THE HAZARD OR PERIL
-
The third dimension of an exposure is its impact or consequences on the organization's objectives and these consequences can be good, creating an opportunity, or bad, generating a threat. In principle, an unexpected high level of a resource would create an opportunity, and a sudden depletion a threat, but unexpected constraints could provide a path to higher efficiency whereas a sudden affluence of resources could be squandered without careful prior planning.
Therefore, the “impact” can be positive or negative and be seen at three levels as defined earlier:
- Primary and Secondary impact: These cover the change in the level of assets and of capacity of earning of the organization in the short term (up to 18–24 months).
-
Tertiary impact: This covers the impact on third parties, including economic partners and other stakeholders, society and other impacts on the environment.
When they are negative, they may engage the contractual, professional or other civil as well as penal bodies. If they are not involved in a transaction they represent an externality in the sense of economy and can be positive or negative.
- “Quaternary” impact: This covers the long-term effect when the trust and confidence of stakeholders is enhanced (opportunity) or tainted (threats). Thus the impact can have a long-term impact on the social licence to operate of the organization, in other words, its reputation.
Figure 2.2 summarizes the elements that are included in the exposure diagnostic, or risk assessment, to retain the expression used in the ISO 31000:2009 standard. The risk identification step means marking the first two dimensions that define any exposure (resource and event) whereas the third (impact quantification) will constitute the risk analysis step. The risk evaluation step consists in comparing the quantified impact under current circumstances to the risk criteria defined as acceptable by the leadership (risk appetite or risk tolerance).

Figure 2.2 Space of Exposures.
2.3.7 VoR or Velocity of Risk?16
Understand the probability of loss, adjusted for the severity of its impact, and you have a sure-fire method for measuring risk.
Sounds familiar and seems on point; but is it? This actuarial construct is useful and adds to our understanding of many types of risk. But if we had these estimates down pat, then how do we explain the financial crisis and its devastating results? The consequences of this failure have been overwhelming.
However, a new concept has developed to describe how quickly risks create loss events. “Velocity of risk” provides an additional insight into the concept of risk through an evaluation of “time to impact” that implies proactively assessing when the chain of events will actually strike. While it is still relatively new and not yet widely used, it is gaining momentum in professional circles, as it is a valuable concept to understand and more so to apply.
Whereas it is necessary to know how likely it is that a risk will manifest itself into a loss or a gain, and the impact of the manifestation, it is not enough to make the most of the opportunity, or limit the loss. Therefore a better way to generate a more comprehensive assessment of risk is to estimate how much time will be available to prepare a response or make some other risk treatment decision about an exposure when its occurrence becomes imminent. This allows you to prioritize more appropriately between exposures; those that require immediate preventive action and those that can be treated when the event is becoming imminent. An efficient allocation of limited resources is the key to robust risk management.
As a matter of fact, expending limited resources on identification and assessment really doesn't buy much more than awareness; and awareness, from a legal perspective and governance perspective, creates an additional risk, that could prove quite costly if reasonable action is not taken to reduce them in a timely manner. Not every exposure will result in this incremental risk, but a surprising number do.
Even five years into the crisis, there's a substantial number of actors in the financial services sector who wish they'd understood risk velocity and taken some form of prudent action that could have perhaps altered the course of loss events that triggered the situation in which the developed world has since been engulfed.
To better understand the velocity of risk there are several avenues to follow:
- At the operational level: Investigate how the circumstances of concern are impacting others who may have the same or similar exposure. Talk to risk owners who've already been affected and get insight and intelligence about how the event evolved for them. When did they first see evidence of its appearance? What horizon scanning methods did they use to see it coming?
- At the legal level: Consider where attorneys seem to be directing their attention and resources. Consult subject matter experts in your company who understand developments in the fields of technology, advertising or research. Find out what they're concerned about and understand why. These efforts, while typically limited in scope and rigor, can reveal much about the potential for new risks and the speed at which they may emerge, influenced heavily by product development goals and pressures.
- At the intermediate management level: A group of managers who have some accountability for strategy and tactics should be interviewed to get their inputs on where they're going and what factors are driving their plans.
Collectively, these efforts can provide a few of the many data points that can help in piecing together a picture of emerging risks and give some context around the speed with which they could develop and cause loss.
The more of these elements can be assessed, the more opportunity will be offered to develop and implement loss prevention plans that could lead to the avoidance of the loss altogether. Between efforts at prevention and protection, it may prove possible to avoid or mitigate the next crisis, an experience any organization would be better off not going through.
2.3.8 What About Business Impact Analysis?
There is a growing trend to consider BIA (Business Impact Analysis) as a new discipline that consultants promote heavily in the wake of the huge contingent loss of profit experienced by many organizations as a consequence of the various natural disasters that hit Asia in 2011.
However, if we refer to ISO 31000, clearly a growing reference worldwide, the risk assessment part of the risk management process calls for a longer view of the impact of a given event or change in situation. It would be a very poor practice to envision only the immediate consequences at the site of the event. Furthermore, risk should be reassessed as soon as there are significant changes in the organization, its internal and external context, and/or its missions or strategic goals. I trust that encompasses the entire scope of the BIA, which appears only as a tool in the risk assessment process and a reminder to look beyond the immediate and local effect.
Back quickly on the assessment/impact issue: personally I prefer the word “diagnostic” and the analysis/evaluation stage of this process clearly must encompass all of the potential impacts: primary damages, secondary damages (loss of profit), tertiary damages (to third party and society), and “quaternary”, i.e. impact on reputation or “social license to operate”.
It seems to me that the “invention” of impact analysis is linked to insufficient attention to a thorough risk analysis (unless it provides a consultant with a competitive advantage and the actuaries a legitimacy to invade the RM field!).
2.3.9 Why Must Risk-Management Objectives Be Clearly Defined?
Within the ERM framework, as per the ISO 31000:2009 standard, risk management objectives can only be derived from the organization's strategic objectives that they are meant to serve with a major focus on pulling through difficult situations.
Clearly, the mission is to plan for all the resources that will be needed to achieve the organization's goals whatever the circumstances may be, more specifically when it is hit by a severe event. Among the resources vital to the organization are the cash flows needed to compensate for the losses whatever their origin may be. This will be the role of risk financing that will remain a corporate function, part of the overall finance strategy, no matter how decentralized risk management may be to the operational risk owners.
Even when approached from both the perspective of threats and opportunities, the essence of risk management is to plan for situations of high volatility; otherwise it would interfere directly with the cost control mission of any manager. The essential volatility of risk management performance has driven the professionals to contrast clearly two sets of objectives that some call “pre-loss” and “post-loss” objectives. However in a global approach, it would be better to call them “pre-” and “post-” event, thus not pre-judging the nature of the impact of the event, which also could be positive.
It is necessary therefore to set the objectives prior to any unexpected event but with a clear understanding of the different timing with regards to major events occurring.
Post-Event Objectives (continuity of operations)
In any case, the first objective is the organization's survival, which could be achieved if there is enough cash at hand when the demands from the event are due. But there is a continuum of objectives depending on how resilient the organization should be. If we look at it from the perspective of the resources at risk:
- Technical, information and partners Continuity of operation is the key. However, the question is rarely that of an absolute continuity but rather how long an interruption the organization and its partners can pull through and continue to strive. The longer the acceptable downtime can be, the lesser the investment necessary in “continuity measures” to mitigate the threat. However, when public service is at stake, the acceptable may be very limited: birth and death certificates must be issued daily; schools should open every day to educate children, not to mention the utility in a hospital where surgery theatre and intensive care units need electricity without a break.
-
Financial Even when there is enough cash to survive, that may not prove enough for the investors' community, which may require proof of the executives' foresight whatever the circumstances:
- “Maintain a profitable situation” even in the year when a disaster occurs.
- “Maintain the expected level of profit” (the median over the past three years for example).
- “Maintain the growth rate” (of earnings per share).
Financial markets do not take lightly to a publicly traded company showing erratic results. In such a case the share price may sink, providing takeover specialists with a tempting target, which is a risk for the independence of the organization and the security of the “executive team”!
- Human and social This is the social responsibility of the firm. The question is how to limit the impact on its environment, employees, up and down stream economic partners, and the society at large, both now and in the future: in other words the impact on the “social licence to operate” and its reputation.
Pre-Event Objectives
These are the objectives that, like any other department in any organization, risk management is expected to be efficient and deliver service to the organization while consuming as little resource as feasible, i.e. contain ongoing costs as much as possible. However, the level of desirable post-event objectives will govern the level of resources to be allocated to risk management.
Other Possible Secondary Objectives
- Contain uncertainty: i.e. the volatility of the organization's financial result, to a level acceptable to the executive (risk appetite).
- Compliance with legal and regulatory requirements: It may seem self-evident but when an organization operates globally then the question may become: what legal framework (?), where (?), should it state its own standards beyond local legal requirements (?), etc.
- Society's expectations: In fact the alignment of the organization's goals and objectives with citizens' expectations should be ensured through the:
- Laws enacted in the land that the legislative branch should vote in accordance with their popular mandate.
- Ethical behaviors that should guide any executive and he should therefore act for the common good in the interests of all stakeholders.
2.3.10 Managing Risks or Containing the Cost of Risk, Is It the Same Objective?
The core mission of risk management in any organization is to maintain some degree of activity through any type of turbulence in order to allow it to reach its strategic objectives, no matter what happens. The risk manager's core job is to make sure that the vital resources needed to achieve this will be available to reach the level of post-event objectives set by the board.
However, this mission must also be fulfiled with as little resource as possible. To reach the optimal level of economic efficiency, the risk-management operations must be measured against some objective yardstick. Minimizing the long-term cost of risk represents such a standard. However, what is the “cost of risk” in a given organization?
Traditionally, the cost of risk has been broken into these four components:
- Administration costs: These are the expenses directly linked with the implementation of the risk management process throughout the organization. They include the salaries, office expenses, and travel and communication expenses for the personnel in the risk management office as well as the costs of outsourced services for risk assessment or other purposes. These costs are relatively easy to track. However, it is essential to include the additional costs of the time and efforts devoted to risk management in the operational units and other executive branches, and these are far less easy to evaluate properly and objectively.
- Loss control costs: Including not only the annual depreciation of loss control investments but also recurring costs linked to risk mitigation efforts. For instance, when dealing with automatic systems for detecting and extinguishing fire (sprinkler) the initial investment is substantial but the system must be maintained regularly and receive major overhauls over the twenty years of its lifetime. For individual protection, there may be the cost of purchasing the adequate equipment, and replacing it regularly, but sometimes “control” is achieved through modifying processes that may increase the production times, and hence costs. These are not always easy to identify and measure precisely.
- Transfer risk financing costs: For the most part these represent the insurance premiums paid to insurers or reinsurers (through a captive company). These costs are quite easy to track and consolidate, as they should appear as such in the accounting documents. However, with the new ART (Alternative Risk Transfer) instruments, some of which are implemented through financial markets or banks, the organization should be careful to include every element of the cost of transfer, especially in a large global conglomerate. Furthermore, the cost of risk contractual transfer for risk financing to non-insurance partners is extremely difficult to “price” as it is part of an overall deal.
-
Retention risk financing costs: These represent all the claims and fractions of losses that remain in the books of the organizations. Clearly that includes those that are not insured or not insurable but also the deductible, self-insured retention, and/or the portion above policy limits, especially in the liability area. For the losses outside the realm of insurance, retention risk financing costs will be reported only if the RM accounting practices provide for their tracking.
However this breakdown of the “cost of risk” concentrates on the downside, the threats, and does not take into account the upside of risk, the opportunities. A “fifth” component should be added:
- The cost of investments deemed “too risky”, made possible thanks to a robust risk management process: It is extremely difficult to assess the potential opportunities that are passed up. However, this impact should always be kept in mind when running any investment analysis.
In all organizations, executives are always tempted to benchmark, with competitors as well as partners. A typical question would be “Is our cost of risk in line with the competition?” This is a very difficult game to play as no two organizations have the same risk profile (each has its own specific portfolio of exposures) and no two executives' teams have the same risk appetite.
Once again it should be stressed that if the organization excludes the high frequency losses that should be treated as quality failures, in the short run, an organization with no risk management in place might seem more efficient as it incurs little “cost of risk”. This will last until a catastrophic event happens that kills it off, for it has no means to rebound. Therefore the cost of risk should always be assessed taking into consideration the company's resilience.
2.3.11 Why Is the Concept of Resilience Becoming So Popular With Board Members?
The underlying objective of any risk management program is the survival of the organization under whatever stress level, but it has to include within its scope the very important concept of sustainable development, not only in terms of preserving the natural resources for future generations but also as a way to provide the investors with a reasonable long-term return on investment. This may call for measures far beyond available sources of cash to pay for the damages that would ensure survival in the aftermath of a major claim.
However, even this minimum objective may prove elusive should some extraordinary circumstance take place; of course this may be the case essentially for liability and environment exposures, e.g., the cost of Exxon Valdez and the BP Gulf oil rig disaster which for smaller firms would have threatened their survival. For extremely catastrophic events, it may be necessary to engage with the stakeholders to find an acceptable compromise where the perception of risk is not excessive, in order to grant the organization its “licence to operate” in view of the positive societal advantages: the opportunities it brings to all.
On the other hand, this “survival” approach to risk management may fall short of stakeholders' expectations especially in the “moderate risk class”, i.e. those scenarios that are due to happen with a good degree of certainty over a 5–10 year horizon, but whose annual impact may fluctuate significantly. The objective of survival would not treat situations that take the financial results of a company through a true rollercoaster that would not please the investor community. Furthermore, employees and managers, as well as customers and suppliers, might question the long-term viability of the organization and seek employment and/or partnership elsewhere to protect their own interests. In the same way, the government, the local authorities and the citizen consumers might well be impatient when confronted with what they would perceive at best as short-sighted management.
It is under these circumstances, and with the capital “reputation” in mind, that both the directors and the executives might well consider a higher level of post-event objectives to assign to the risk management operations in the organization, like limiting service or production interruptions to a level compatible with the partners' interests, or imposing a minimum level of profits and/or growth even in the case of unexpectedly large losses. Clearly, they will expect the organization to rebound faster and higher than mere survival would allow, even after a serious loss.
Without undue developments, it is all too clear that these higher post-event objectives are going to require investing more resources, financial in particular, into the risk management process than “absolutely” necessary. This “additional investment” is in conflict with the pre-event objectives of economic efficiency, which call for containing the cost of risk.
Once again, risk management efficiency has to be assessed in the long term. However, long term must be defined. For a CEO whose tenure is going to be anything from three to six years, this is long term; for a government it should be the well-being of this and at least the next generation of human beings (and not the next election); for an environment specialist is a millennium enough (think nuclear waste)? Pension funds that are such an important player in the financial market should look at 20–40 years' horizon for the benefit of their “investors”, not just the next three quarters, which may represent the best interest of their funds managers.
Therefore, if purely financial returns do not provide a clear view on the long-term sustainability of the firm, a new concept, a new measure, is needed to provide a comparison tool. Resilience for an organization was forged as a social concept by analogy with the quality of a metal that regains its quality after a stress. It is often used in modern risk management literature, not always with a clear understanding of its underlying meaning. It was used for the first time in an audit context by the Canadian Auditors Association, too happy to find a word that is the same in English and in French. The definition can be summarized as follows: “The capacity of an organization to rebound even after the most severe stress and still maintain its strategic objectives in the interest of its main stakeholders.”
Therefore the resilience must be assessed by each stakeholder in view of the preservation of its stakes or interests in the organization. As an illustration, the expectations of the organization from the points of view of different groups are:
- Society: Fulfil its obligation.
- Employees: Maintain employment.
- Partners: Insure security of orders/delivery.
- Stockholders: Provide long-term dividends.
2.3.12 How to Conduct an Exposure Diagnostic?
Establishing a diagnostic of the exposures for a given organization is the first step in the risk management process. It can be split into three different phases: identification, analysis and assessment.
One of the problems of the emerging risk management science is that, in spite of the definitions offered in the ISO Guide 73 vocabulary for risk management, so many concepts remain ill defined. Let us therefore state that here we mean by “identification” the recognition that some undesirable event may occur; “analysis” means quantifying the consequences for the organization and hence also its stakeholders, without any consideration of the control measures in place; while “evaluation” takes into account the best possible outcome if all current control measures operate at full capacity, i.e. an analogy with the insurance concepts of MPL (maximum possible loss) and ERL (expected reasonable loss). It should be noted that what we call exposures diagnostic is also referred to in ISO 31000 as “risk assessment”.
It is obvious that the good risk manager envisions the probability of the event occurring, the frequency, the importance of the impacts, and the severity of potential losses. However, this would fall short of an understanding of the phenomenon without giving due consideration to a measure of the uncertainty of the consequences, i.e. the dispersion of the consequences. At the end of the day, what the risk management professional should be concerned with are the consequences on the ability of the organization to achieve its goals and missions, no matter what, i.e. what we have called its level of resilience.
The diagnosis is the cornerstone of the risk management process: our decisions are only as good as the information we base them on; if a risk is not identified, the opportunity will be missed or the threat will not be curbed. On the other hand, when a risk is identified and properly quantified, the risk management treatment may just pop out for the experienced risk manager. Later in the book we will come back to how the diagnosis is transformed in an ongoing process of risk mapping through the feedback loop.
A single event may impact a number of organizations. For example, a used tire facility burns in the vicinity of a populated town. Toxic fumes from the fire are blown by the wind in the direction of a nearby industrial and commercial park. The impact of this event must be analysed from different perspectives, but first of all from the company who owns the inventory and manages the site. The analysis will cover property and equipment damages, loss of personnel, and loss of net revenues. Of course the consequences for all economic partners should be assessed, if only to analyse the potential contractual liability losses. However, each of the partners should also conduct their own evaluation of the consequences. If the context has been defined accurately, then the eventuality of this exogenous event should be included in the exposure diagnosis of each of them as an “external” hazard. Finally, for the tire owner the impact on reputation and image should not be forgotten as economic partners may also suffer. Nevertheless, the impacted organizations may also experience reputation loss even if “innocent”, especially if they cannot demonstrate a proper preparedness for such a “foreseeable” event!
But this analysis in a semi-open system, i.e. a system that is not totally self-sufficient, is not enough as many other stakeholders, some of whom the organization has no contractual ties with may be impacted, e.g. the neighbors, the city and surrounding communities, as well as regional and national authorities, and even other private entities. Therefore, an investigation on the potential impacts on all stakeholders will have to be conducted at the organization level to further assess tort and criminal liabilities that the fire might induce. This is after all an endogenous hazard that may have consequences on an extended environment.
Furthermore, the risk manager of a healthcare organization located within a mile radius should have identified the “tire inventory operation” as a potential hazard as part of its community wellness program, especially in the context of its pulmonary patients, children, and other at-risk persons.
To summarize, the exposure diagnosis consists of a recurring exercise to keep an updated register of the exposures confronting the organization, as exhaustive and current as possible.
The second phase develops a quantified evaluation of the impacts on the organization's resources and objectives, as far as possible. This can be achieved through the use of probability and trend analysis for the “frequency risks” for which there is a data bank. Other quantification methods such as expert advice and Bayesian networks can be used for the median risk category, and scenario analysis is appropriate for “catastrophic” events, especially when many stakeholders could be impacted.
It is a “no brainer” that the more open the system, the more delicate the diagnosis process. Such is the case of malls, healthcare establishments and local authorities where most of the stakeholders have no direct subordination or contractual links with the organization. It is clearly easier to manage risk within the limit of a manufacturing plant where most actors can be trained and educated to recognize risks and act responsibly to limit their consequences.
Finally, there is the case of managing the risks in a project. Projects usually involve different partners that may have not necessarily entirely convergent goals and objectives, indeed even sometimes divergent interests. Project risk management in such a case will require a common approach to managing the risks in the most efficient way while satisfying the needs of all participants.
2.3.13 How to Analyze and Evaluate Risks?
The realm of possibilities that may arise in a situation of uncertainty for a given organization is practically without borders. And even if risk management tends to look principally at downside risk when referring to risk diagnostic, it is essential to have a broad perspective on their potential impact, if only to prioritize risk control efforts.
Too often the risk impact evaluation is limited to the two traditional variables used by the insurance industry to calculate an expected value of the claims:
- The probability, also called frequency, as claims do occur even in a well-balanced portfolio (law of large numbers).
- The severity, or the financial impact, usually measured within the scope of the insurance cover granted to the insured in the contract.
As a matter of fact, if the portfolio is large enough and underwritten cautiously, the multiplication of the frequency by the severity, or expected value, is indeed what the insurer can expect to pay in claims on his portfolio in the long run.
However, when applied to a single organization, large as it may be, the formula will not give insight into the adverse conditions that it may be faced with, except for the very limited and frequent claims like physical damages to a fleet of vehicles. A major variable is missing, that could be summarized in the volatility of the annual losses and the negative cash flows that stem from the realization of the hazardous events. An example drawn from the nuclear industry will illustrate. If any nuclear power plant has a probability of 1 in 10,000 million of suffering a major catastrophe with a $2,000 billion loss, then the long-term annual “cost of risk” for Electricité de France (EDF) that operates less than 100 sites is less than $20,000 a year. That is a quite acceptable burden for EDF; however, does this answer the question for the public: “Is the nuclear industry in France safe enough to ensure both permanent supply of electricity and safety for those living close to one of the power plants?” Who cares if the annual long-term cost over 10 million years is negligible? At the end of the day the question is linked with sustainable development, not expected value of cost. In other words, any exposure assessment will have to take into account the dispersion of the force of the impact, be it in financial terms or in human or environmental evaluation.
For the high frequency risk, the “non risk” exposures in terms of financial implications like health cover for a large population or vehicle fleets, the historical data will provide a good start to forecast the future losses provided trend variables are properly inserted in the model. Furthermore, the “expected value” of annual cost may even prove a reasonable base for a budget exercise, as it will be relatively non-volatile.
For exceptional exposures on the other hand, it is more the severity and the spread of consequences that will guide in the decisions of risk treatment, even to the ultimate option of discontinuing or not engaging an activity deemed too risky. In those situations, what is essential is to determine the stakeholders' appetite for risk. To summarize, the parameters should not be multiplied; it is the three dimensions vector (F, S, and σ)17 that must be assessed: “At a given level of confidence, are the consequences socially and economically acceptable?”
Some authors have recently advocated looking at the worst case scenario and defined for financial institutions the “value at risk” and for non-financial the “cash flow at risk” as a measure of the stress that the system, the organization, can endure without permanent damage or impairment. Now, recent authors place it in the QBRM (quantile-based risk measures) and argue that it is fundamentally flawed and does not represent a coherent risk measure. It is not within the scope of this book to fully address the debate, which will be left to the FRM (financial risk management) specialist and the actuaries. Suffice to know that it is a fast developing field that the risk management professionals must be aware of.
In any event, assessing severity requires developing an “extreme scenario” according to Murphy's Law (everything that can go wrong, will go wrong). Clearly, from the organization's point of view, recognizing all the negative (and positive?) impact is essential. The worst-case scenario will have to address the question of the stakeholders' confidence and the loss of reputation.
Finally, when dealing with risk assessment, one must exercise caution as some consequences are not readily measurable in monetary terms (long-term impact on the environment) and cannot always be positioned in the financial model of the firm even with the long-term view of value creation for the stockholders. Other objectives have to be taken into account such as whether they are true missions or merely constraints; it is for each board of directors to answer, but they include sustainable development, assistance to distressed persons, etc. It is probably necessary to broaden the assessment tools to include other variables than the three mentioned here.
One final piece of advice: as all is not quantifiable in monetary terms, all that can be must be, with utter care and application, be it only to limit the residual uncertainty!
2.3.14 Risk Centres and How to Use Them for Risk Assessment
The “risk centre” method for assessing risks, exposure diagnostic, is founded on the model that describes an organization as a dynamic combination of five classes of resources (Human, Technical, Information, Partners, and Financial).
The crux of the method is to split the organization defined as a “complex system”, i.e. a system of systems surrounded by environments, into as many sub-systems as needed to make the smaller entities “user-friendly”. Then the sub-system is analyzed as a combination of the same resources.
This identification of sub-systems within an organization is totally compatible within the system safety approach. It must stop when the level of “elementary sub-system” or “micro firm” is reached. It is still a living cell with a manager aware of the missions he/she is to fulfil with the help of the necessary resources in the five classes. It is then possible to identify, analyze and mitigate the risk at the risk centre level, which is a “micro-organization” that can be defined as a set of resources, combining to reach an identified sub-goal, contributing to the organization's overall goals and missions.
The boundaries of the risk centre and the forces of its environment should be apprehensible by the risk centre manager who should have the initiative to manage this “micro enterprise” and navigate at best within the threats and opportunities identified. This is precisely the “risk owner” often referred to in all ERM (Enterprise-wide Risk Management) presentations.
We have already listed and explained the seven risk identification tools; however, once the risk centres have been identified, the main tool to use is the questionnaire, or preferably, the interview of the identified risk-owners. The information gathered during the interview will be the material used for the workshop organized henceforth with the management team to appropriate the risks and agree on priorities and actions.
The interview should be conducted according to the main points listed in the box below:
- Question 1: Aims at understanding the activity of the risk centre and testing the manager's grasp of his missions and position within the organization.
- Questions 2 to 6: Aim at identifying the resources currently used by the centre, including the “free resources” and the interaction with other actors, within and outside the organization.
- Questions 7 & 8: Aim at questioning the manager's comfort so that he/she can accept that potential destabilizing events may occur and envision how he/she would cope in an emergency. Through the absence of staff, on the one hand, and the loss of all equipment on the other, the manager is led to consider which among his/her resources are really “vital” for the continuation of the operation. Furthermore, through the wish list of what to do now, and what to do in the case of a disruption, the manager initiates the process of scenario identification that will help the staff workshop to lead to a robust mitigation plan at his/her level, i.e. to the definition of BCP, the quantification of the need for “exceptional financial resources” to implement it, and the “sentinel event” that should prompt top management attention.
- Questions 9 & 10: Aim at developing a preliminary BCP, the conditions for its successful implementation as well as early detection of the development that may lead to a crisis through media attention and public implication in the consequences of the “undesirable event”. Those situations might develop into crises that are likely to require headquarters input and assistance. Early warning may make all the difference between an aborted crisis and full-blown havoc!
2.3.15 Risk Map or Risk Matrix: What for?
The desired output of the diagnosis exercise is a list of exposures, as exhaustive as possible and a classification by order of priority. It is customary to assess a priority on the basis of the “long-term economic impact” measured by the two variables: frequency and severity.
The risk matrix, that some consultants still insist on calling a “risk-map”, is a two-axis table: on one axis the probability of the event taking place (or frequency) and on the other the potential impact (usually in monetary terms). This matrix does not have the permanency of a physical geography map: it is merely transitory help to decision makers, whose decisions will immediately alter the risk profile of the organization, not to mention the evolution in the external and internal context. However, this function as an information tool for managers and executives must provide them with some insight into the risk; therefore the classes of risks thus described must be in measures that make sense to them in the light of the decision to be made:
- On the probability axis, for example: once a week, once a month, once a year, once a decade, possibly once a century, once a millennium; and
- On the impact axis: for low or middle severities, a reference to the annual profit should be enlightening (less than 1 per mil, 1 percent, 10 percent, etc.); and for catastrophic risks a reference to the company's net worth may prove more appropriate (20%, 50%, and possibly 1000%, or ten times, etc.).
Combining frequency and severity provides the long-term weight of the risk, but judgment must be exercised, especially where improbable catastrophic events are concerned. At this stage the traditional green, yellow and red zones depending on the acceptability of risk level dictated by the deciders' or stakeholders' risk appetite. If an event whose potential impact is 1 per mil of the profit would only happen once a year, it can be ignored. If the same event could occur once a week, the situation will call for treatment. On the other hand, a millenary flood, even potentially catastrophic, may be left untreated.
Clearly the key to efficient risk management is an in-depth understanding of all the exposures to which an organization is confronted, their characteristics and root causes to infer their potential economic impact. The risk matrix clearly provides an appropriate tool for classifying the risks.
Risk Matrix, a Permanent Process
However, more than the transitory output, the risk matrix, essential in the diagnosis exercise, is the permanent process that facilitates the appropriation of their risks by each risk owner in the organization. The approach that we describe here is a mirror of any project management exercise and will engage all operational managers (be they local risk owners or chief risk officer). It is a three-stage process:
- Collecting data – All the elements pertinent to the management of risks must be collected and analysed in the light of their potential impact on the organization's strategic objectives. Therefore, constituting and keeping updated the risk data bank is at the heart of the risk management culture and the tool for it is the RMIS (Risk Management Information System). The data bank is also enhanced through direct interview of the risk centre's manager to uncover local potential threats and opportunities that could not be seen from documents.
- Self-evaluation workshop – On the basis of the elements in the RMIS and the subsequent interview of the manager, this is a meeting of the team in charge of the risk centre (operational unit). Each member is asked to provide an assessment for each of the exposures. The difficulty in this type of exercise is to really obtain a consensus with each team member initially expressing his/her own opinion, notwithstanding the hierarchy. This is where “voting pads” become handy. Each member is equipped with one and a computer program will provide a consolidated visualization of all the answers. The graph is intended to provide a starting point for a discussion where both assessment and possible treatment can be openly discussed to reach a fruitful consensus.
- Feedback loop – At the end of the self-evaluation workshop all exposures that are deemed strategic, i.e. those that impact the timely achievement of the organization's strategic goals and missions, must be taken into account in the “business continuity plans” developed by the group. However, they may require to be passed on to a higher level in the hierarchy to have a broader perspective on their global impact on the organization, including external stakeholders. It is at this stage in the assessment process that a Cindynic analysis may prove indispensable to extend the root cause analysis beyond mechanical failure and focus on the social, cultural and human components of the system. Defining the situation at risk in terms of space, actor, networks, and time will require a good understanding of the ins and outs of the organization as well as an outsider's “eye” to avoid too much a “business as usual” approach. The final report to be consolidated in a bottom-up movement will be only the starting point of the next iteration when the executive team and/or the risk committee of the board has reviewed the results and made the necessary arbitrage to initiate the iterative improvement program.
2.3.16 Why Does It Make Sense to Invest in a System to Gather and Transform Information?
During the course of the last decade, risk management has clearly become a system to gather, process and communicate information as is clearly illustrated by the developments of analytics and “big data”. At each step of the process, from the diagnosis or risk assessment to the audit of the program, there is a constant need of communication (to obtain the necessary information) to manage information (gather and explain), and communicate again (to present the results and draw practical consequences). This is precisely why installing a risk management information system (RMIS), i.e. a set of hardware and software to gather and treat all relevant data for making and implementing decisions, is an essential tool to manage efficiently risks in any organization. Its main attributes are:
Assistance to Decision Making
The decisions made with and all along the risk management process are based on systems that efficiently link data and people. The following are illustrations of what can yield a RMIS:
- Exposures identification, analysis and assessment: Collecting data on production sites, properties and equipment, loss histories, values and localization of assets, etc.
- Investigation of the risk treatment options: Looking at past claims, including values and cash-flows at risk to integrate trends in the investigation of the potential impacts of control and financial measures under consideration to mitigate risks, etc.
- Development and approval of the risk management programs: Using investigation tools and models to quantify the measures matrix and thus select those bringing the maximum expected value (enhancing opportunities and/or curbing threats).
- Implementation of the risk management programs: Bringing risk-owners up to speed with their targets and ways to reach them, whatever happens. Providing insurance underwriters with quality information to come up with best cover conditions, and provide data needed for an efficient management of retention programs.
- Audit of the risk management programs: Producing timely and accurate reports for top management to monitor organization-wide risk management efforts (activity standards) and achievements (results standards), thus enabling them to decide on necessary corrections if and when needed.
Reducing Uncertainties
One of the most difficult challenges for any risk management professional is to narrow down the range of possible outcomes in any decision-making circumstance, i.e. limit the uncertainties at a level that the “stakeholders can live with”. However, there remains the daunting question of defining and measuring uncertainty. One definition could be: “The doubt concerning the capacity to forecast future events.” In financial terms, most models take the standard deviation of the probability distribution of potential outcomes as a measure of the risk/uncertainty. Clearly improving the quality of information is transferred in a reduced standard deviation; avenues of possible futures are drawn through “the cloud of the unknown.” Enhancing the decision processes within the organization is probably the main contribution of an efficient RMIS.
Improving Management Efficiency
In addition to improving the decision process, the RMIS impacts other aspects of risk management. Among others, it improves productivity and plays a key role in the swift and efficient implementation of the risk treatment programs in the following:
- Collecting data on individual large claims or a series of smaller claims, on exposures and insurance covers enables a swift and equitable compensation, especially in the case of multiple or basket coverage.
- Selecting appropriate information to help management with a clear picture of risk financing solutions, specifically insurance cover, and ensuring that proper insurance certificates are issued.
- Keeping track of the transactions processes and settlements reached in the case of retention programs, printing relevant letters and reassessing reserve levels.
- Documenting proper information for future reference, like notes on claims history and historical covers, including trial-proof evidence, should it be needed.
- Keeping a written track of important events; planning “flags” to make sure of the progression of a file, close claim files in due course, etc.
Enhancing Communication
Analysis and reporting functions can be used to inform both staff and management on the progress of risk management within the organization, the major trends and individual department contribution to risk management. The RMIS system should be linked to the information system capabilities of the organization to facilitate interaction and edit clear and synthetic documentation to illustrate the impact of risk management on all the activities of the organization.
The visibility of risk management is greatly improved where operations receive accurate information on risks together with other information on management. This puts risk management on an equal footing with other sources of controllable costs within the organization, and managers can take it as seriously as other disciplines.
At the foundation of Enterprise-wide Risk Management, the RMIS plays a key role to instil a risk-management culture throughout the organization and with its main partners.
Beyond RMIS, the BIS
In reality, nowadays the question of a separate system for managing information regarding risks is superseded by the need for top management to be able to have a complete view of the information flows within and outside the organization breaking the silos of specific applications for individual functions or departments. This overall strategic information system is often referred to as the Business Information System involving the collection of information throughout the organization and includes intelligence gathered, so that both the inside-out and the outside-in perspective are available to make or revise strategic, tactical and operational decisions in a coherent “risk intelligence”.
2.4 MANAGING THE COLLECTION OF RELEVANT DATA FOR AN ERM PROGRAM: THE IMPORTANCE OF EFFICIENT AND NEUTRAL QUESTIONNAIRES
Sophie Gaultier-Gaillard
Assistant Professor, Université Paris 1 Panthéon-Sorbonne, Paris
An ERM program's path to maturity rests heavily on the adhesion of both internal and external stakeholders that some call “instilling a risk management culture”. Furthermore, the ISO 31000:2009 standard recognizes the importance of stakeholders' trust and confidence by stressing in its proposed risk-management process the “communication and consultation with stakeholders”.
On the other hand, if we agree with Felix Kloman's view of risk management as “lifting somewhat the fog of uncertainties about the future” to enhance the decision process at all stages, collecting relevant data and transforming it into information is key to any risk management program.
Behind the development of efficient data banks, many different tools can be used to evaluate the stakeholders' perception of risk and measure their trust and confidence in the organization to optimize risk-taking by enhancing opportunities and curbing threats.
However, in many situations, building and administering questionnaires will prove to be the only efficient way to gather or develop these data, both to assess the current situation, and model possible outcomes depending on the course of action chosen, taking into account the potential evolution of the internal and external context in which the organization operates. There is a systematic approach to developing and implementing questionnaires that will help ensure optimal data gathering. Creating an efficient questionnaire is not as simple as it may appear. Many designers were disappointed by the results of their enquiries, only because they did not devote enough time and energy to a preliminary thought process.
A questionnaire developing process is split into four stages: conception, construction, administration and analysis. However, the two first stages should represent two-thirds of the time devoted to the whole process. Administration and treatment require rigor essentially, but should not prove very time consuming, somewhat less than a third of the total duration of the study.
2.4.1 Conception Stage
Before writing any question it is essential to define the study/project objectives and the issue on which the survey is to shed light. This stage will allow the development of questions that will lead to answers that will effectively address the study's scope and produce the types of results desired, which is the key to a successful questionnaire administration.
While there are many ways to survey people, and many will be touched upon in the analysis, this paper will explore the in-person interview in more depth as a way of gathering data from stakeholders in a risk management context. Interviewees can be employees, management, the board, key shareholders, customers, regulators and others. The nature of the interview and the persons interviewed are directly related to the goals and objectives of the survey.
Initial Thought
This first step, like for any IT program, is essential for success as the questionnaire will provide information as good as the specifications that have been developed:
Survey Objectives
One way to define clear survey objectives is to conduct a feasibility study to explore, describe, explain and predict what is being pursued. The feasibility study aims at understanding the context of the situation without attempting to validate the results. The current lack of hard evidence or data is the reason that the survey is to be conducted in order to produce enough information for the decision makers to make qualified decisions. A feasibility study helps to better define the information required for the survey to gather. In the three other situations (describing, explaining and predicting) it is possible to refine the questions and answers format to obtain a more granular analysis.
Questionnaire Issue(s)
To better formalize the issues the questionnaire will address write down 4 or 5 questions that the survey should answer, in no more than 4 or 5 sentences.
Targeting Interviewees
All survey participants have to be carefully chosen according to criteria that depend on the aim of the survey. They have to be targeted to specific characteristics studied by the questionnaire. The main socio-economic characteristics of the target interviewees (organization, position in the organization, seniority in the position, geographic location, age, education level, etc.) should be calibrated to provide exploitable answers for the survey objectives. This means that the participants must represent a credible sample of the targeted population so that the results are not biased. This specific targeting will help to match participants' profiles to the objectives and ultimately the results of the questionnaire.
Nature of Data/Information to be Collected
Information to be collected may be qualitative or quantitative. This initial choice is essential as these categories require significantly different statistical treatments and question format. Most often we use verbal data. It has to be thought about how the data will be analyzed at the time that the questions are being formulated. There are several methods that can be used depending on the level of directivity sought in the administering of these questionnaires.
- A non-directive interview will use open questions, meaning that it allows an infinite number of possible responses, providing the interviewee with an opportunity to respond without any interruption by the interviewer, once the scope of the survey has been clearly explained, such as asking people what they think about a specific brand reputation. The range of possible answers is not suggested in the question and the interviewee can respond with his own words. The upside of this approach is that it can possibly provide new ways of thinking or insight on the topic of the survey. The downside is the risk that the interviewee might provide superficial answers, or provide information, outside of the scope, resulting in unusable answers, because he might have misunderstood the scope of the survey or reinterpreted it. A lexical analysis is required to obtain satisfactory information. It analyses the frequency of the main concept in the responses and provides statistical results from verbal data. However, if the interviewer is skilled and understands the subject matter of the interview, the interviewer may be able to overcome superficiality with more detailed questions that drill down to more valuable answers.
- A directive interview implies that the questionnaire contains only closed questions, which can be, for example, answered by “yes” or “no”, or by giving a precise number such as age, or the number of activities done in a month, and calling anyway for short answers.
- A semi-directive interview is a balanced approach tapping on the two preceding methods and is based on semi-closed (or semi-open) questions, most often pre-coded questions, meaning that it allows a finite number of possible answers. A semi-directive interview is particularly suited for studies on individual perceptions and/or representations.
Level of Details Expected in the Answers of Closed and Semi-Closed Questions
Depending on the level of precision expected for the results, question formats may differ. For exploratory studies, it is recommended to adopt a binary format (yes/no). The type of results expected is then “for or against” the survey subject. If more detailed information is needed then more answers should be offered through the use of a multi-level scale. It can be a numeric scale (i.e. boxes marked 1 to 4, in increasing preference order), or a qualitative scale (i.e. four boxes like “never”, “ rarely”, “sometimes”, “often”). The scale may be comprised of “2” to “10” graduations or boxes, “2” is the minimum to allow comparing, “10” the maximum number of items that an individual can order mentally. Between these two limits, the choice will be dictated by the level of detail expected from the answers:
- A “2 points” scale allows only a binary approach, and therefore only a very general appreciation on the study subject.
- A “4 points” scale will provide more precision like “rather in favor” or “rather against” the study subject, but does not allow for more precision to be able to explain the considered individual choice.
- A “5 points” scale represents an odd number of choices and like any odd scale it allows for a median position, used when a large number of interviewees is likely to have no opinion. These individuals, that can be tempted not to answer the questionnaire, can choose a median position. The advantage of this intermediate box is to collect an answer for the specified question, as any not fully filled questionnaire should not be considered in the statistical results.
- A “6, 7 points” scale opens the door to inferential statistical analysis, like “probit” or “tobit”, econometric tools, to be able to determine a specific profile of the individual for each studied topic. The “7 points” scale, developed by the psychologist Rensis Lickert, is the most commonly used as it allows for a satisfactory level of detail giving the interviewee a more nuanced level of answers.
- All the questions of a given questionnaire must be identically formatted so that the interviewee mental framework is not disrupted. The questions should have the same scale, in the same increasing or decreasing order, and should all be written in a positive or negative approach. This simple point would help the interviewee to better answer the questions as he/she doesn't have to reevaluate the levels of the scale with each new question.
Pragmatism
A major flaw in survey technique is impatience. Those who want data want it now and sloppy question writing is often the result, leading to misleading or even unusable data and frustration at all levels. For example, if interviewees are asking, “why are you asking ME this” you know there is a disconnection between the interviewee and the content of the survey.
Type of Treatment Envisioned
Treatment is dictated by the way the interview is conducted and how the questions are formatted. If the interviewer, or his/her statistical team, has limited statistical competency, it is advisable to limit the format to 3 to 4 points scale relying only on descriptive statistics. If the interviewer, or his/her statistical team, is more statistics-savvy then more extended scales can be used.
Type of Collection Envisioned
It is quite essential that the individuals selected to conduct the interviews (when the questionnaire is administered by direct interviews) be quite aware of the importance of their mission, i.e. that the quality of the conclusions drawn from the process relies heavily on their accomplishing their mission with integrity and professionalism. Questionnaire protocol must spell out specifically what the interviewer can and cannot do. For example: absolutely refrain from faking interviews and filling out the questionnaires themselves. They must understand the importance of providing adequate time so that the interviewees can structure their answers. In most instances, some training will be needed to make interviewers aware of their responsibilities and of the ultimate importance of the quality of data collection.
The conceptual stage of the questionnaire process will allow the study manager to ensure that all interviewers will collect all the necessary data for the successful completion of the study through appropriate implementation and treatment.
2.4.2 Construction Stage
Reassure the Interviewee
At the beginning of the questionnaire the interviewee must be confident that the sponsoring group is only interested in his/her opinion. It will require explaining to the interviewee that this is not a test, and interviewers must be trained to build trust in the interviewee. A sentence specifying that there are no good or bad answers may prove useful in all cases. All interviewees should be offered the opportunity to review a summary of the survey's results. These two measures will help to put the interviewee at ease and should enable the interviewee to provide more thoughtful answers.
The Context
The person in charge of writing the questionnaire is confronted with an alternative as he/she has the option of:
- Explaining in detail the scope of the study, which can induce an anchoring or framing bias, that would tend to overestimate systematically the risk being tested. The decision process of the interviewee is influenced by the context of the questions or by specific words contained in it. For example, if you ask students how much they are going to earn after their degree, you'll get a quite different answer if you explain, before asking them this specific question, that their colleagues from the past year earned around three thousand per month. Even explaining that the scope of the study has to do with income potential after college could introduce some bias as students may have a preconceived idea about what the media has had to say about what students can expect to earn after college. The alternative is keeping the scope of the study secret.
- Keeping secret the scope of the study, while eliminating the bias described above, this second choice can increase the volatility of the answers. The scope of the results is going to be wider. As the respondent does not know the risk involved he/she can imagine a situation far different from the one being tested. This will require analyzing the answers as a variation from an initial benchmark, corresponding to the initial choice of the individual. The respondent just has to analyze if he's going to have a gain or a loss comparing to that benchmark, then decides how to act.
If the interviewer is experienced in developing questionnaires, and if he/she is convinced that through the conduct of the questions he/she can guide the interviewee to answer the question being asked, then he/she can afford not to describe the context at the beginning. Otherwise, if the context is presented to the interviewee, it should be kept in mind that the value of the results is overestimated. In fact, in such a case, the interviewee has become aware of a risk that might have been ignored, and this awareness usually makes him/her more afraid of that risk, and this explains the overestimation of the results.
The Questions
Several points have to be considered when it comes to managing the questions. It is advisable to:
- Couple systematically semi-closed questions with one open question like: “What other …”, “Could you be more specific?” or even “Can you comment?” This approach will give the interviewee an opportunity to expand his/her answer so that responses are clearer and more specific which will allow the interview to capture strategic information that could have been lost otherwise. However, the interviewer skill will be essential in limiting the scope of the answer. It must answer the appropriate question or the subject matter at hand.
- Preserve a balance between the number of questions and the number of interviewees. Should the number of questions be too large compared to the number of individuals being tested, the information collected is likely to be so diverse that the study results will be less satisfactory and weak. If a statistical analysis is to be performed, the recommendation is that the number of individuals be three times larger than the number of questions. For example, if the questionnaire contains twenty questions, sixty individuals, at least, should be interviewed.
- Limit the number of questions so as not to reach the exhaustion level of the interviewee and thus a lowering of the quality of the answers. The rule of thumb is not to exceed 4 pages, if possible, and never go beyond 6 pages, which represents approximately around eight to ten questions per page. The attention of the interviewee could soon wear out if the questionnaire is too long. The maximum recommended time for administering a questionnaire is 20 minutes. Only open question questionnaires can override this rule. Even then it may be advisable to pre-test open question surveys to determine whether interviewee fatigue sets in. If an open question survey proves too long it should be redesigned, some open questions could be changed into closed questions where appropriate for the sake of timing.
- Ask simple questions, understandable by all target audience, that are unambiguous, meaning that everyone understands it the same way. This point can only be verified through a pre-testing with volunteers. A small group (3 to 5 individuals) should be selected to test the quality of the questionnaire; this includes asking questions when they feel they encounter ambiguous phrasing, and provide comment to improve the questionnaire. However, these volunteers will be excluded from the final panel.
- Avoid to the extent it is feasible, any anchoring or framing bias in the questions. If a negatively constructed question is asked the individual will tend to provide a pessimistic answer, and the reverse is true for a positively constructed question. The connotation of some terms influences individuals considerably. Negative questions influence people to answer in a pessimistic way. Positive questions influence people to answer in an optimistic way. All questions, in the survey, have to be constructed to be either all positive or all negative, depending on the chosen context, either positive questions to obtain more optimistic answers, or negative questions to obtain pessimistic answers. Every single word in the question must be selected carefully so that it does not induce a specific answer or an answer biased because of the way the question is constructed. The ordering of the questions must be given full attention too. A previous question shouldn't influence the following one. However, it would be illusory to believe all biases can be eliminated. The person writing the questions should have a solid understanding of behavioral science, and has to weigh each word carefully. Experience and scientific honesty are recommended. A few years of psychometric or behavioral studies is recommended, otherwise it might be better to outsource the writing of the survey to professionals in order to minimize all possible biases.
- Insert socio-demographic questions at the beginning of the questionnaire, such as male/female, job, and experience in the job …but locate personal questions, such as income for instance, at the end of the questionnaire so that they do not block the individual. Also a solid understanding of the interviewees' perception is necessary to position these questions most effectively. The writer has to get information of the targeted population, of their social environment, in order to use appropriate vocabulary to be better understood.
2.4.3 Administration Stage
Whatever the technique chosen to administer the questionnaire, the administrator must provide the interviewee with a brief presentation of himself/herself and the organization, in order to demonstrate his/her legitimate right to conduct the survey. The interviewer should try to engage the interviewee to explain that he/she should take the time to provide answers. It must always be kept in mind that the interviewee may have been asked many times to participate in surveys and must prioritize attention and time. This is especially true when surveying executives or individuals in positions of power who are a frequent target for surveys. A letter or a short presentation limited to a few minutes may capture the attention of the selected target respondents and raise their trust level which will help improve the quality of the result. Emphasizing the importance of the survey may also assist in getting the attention of busy executives and employees.
Individual or Face-to-Face Interview
Individual interviews may take place at the workplace of the interviewee, in the risk manager's office, or consultant's offices or even on the street. In any case, the key to the validity of the findings is to ensure the professional integrity and the reliability of the interviewer who must vouch for compliance with the rules for administering the questionnaire. This can be both a strength, as the interviewer is in a position to help individuals better understand the questionnaire, and a weakness as the interviewer might influence their answers.
Focus Group
The facilitator that took part in the development of the questionnaire must conduct the group interviews so that he/she can lead the discussion in the right direction to fulfil the objectives of the study. Typically the groups will gather a minimum of 10 participants. The leader may need to focus the interviewees on the subject at hand and not hesitate to add open questions if the group gets off track or provides inadequate information. In most instances group interviews will be recorded and this needs to be explained to the group up front. Group answers may prove difficult to analyze as they tend to be more extreme, and sometimes emotional, than individual interviewee answers; participants may be more optimistic, or more pessimistic depending on the presence in their midst of a leader, or not. The upside to focus groups is that they can open debates and exchanges where very different points of view are confronted. The downside is that the results tend to be multiple and complex and require careful analysis. The interviewer may also need to address directly to individuals that are shy in the group, especially when there are some dominant participants that might monopolize the conversation. The leader of the focus group should, in this specific case, interrupt the dominating voice and give the right to answer to the other members of the group.
Mail in Questionnaire
This method is often used in the case of panels to be followed over several months. Its use is rare as they are expensive (costs of sending and returning the questionnaire by mail) and response rate tends to be low. The upside is that each individual has ample time to answer the questions. The downside is that the respondent may not answer the questions in the order they appear on the questionnaire, and this may influence answers to questions answered out of the intended order. The participant may also review the questionnaire later in the day or the day after to finish up, or even days later if it has not been sent yet or a reminder is sent.
Mailing/Internet
This technique is gaining momentum, as the cost is very low once the proper names database has been built. The upside is a swift collection of data; an easy exploitation of data. Sending reminders is facilitated when potential interviewees have not responded. The downside is that the increase of such solicitations tends to lower the rate of answers by individuals who feel harassed. Also many organizations may filter these out as spam. Other organizations may have strict guidelines about whether employees can provide answers to such questionnaires whether related to the organization or not.
Telephone Survey
This technique allows for contact with individuals who may be geographically dispersed. However it supposes that the questionnaires are simple and short as the time that respondents are ready to invest to answer telephone questionnaires is much more limited than in the case of individual meetings. In the United States the “Do Not Call” statute prohibits solicitation by for-profit entities (including surveys) if the phone number has been entered into the Do Not Call database.
2.4.4 Analysis Stage
Data treatment must take into account the competencies of the developers and consultants involved in the study.
Caveat
This section provides only a brief overview of some of the categories of analytic tools available to the researcher. In most cases, proper statistical analytic techniques may require professional competencies to apply the appropriate technique to produce quality results. It may also be necessary to hire such talent during the preliminary stages of questionnaire development and delivery to test subjects to facilitate discovering and fixing early in the process potential problems that might lead to problematic or even invalid results.
Descriptive Statistics
Whatever the level of detail sought in the study, this step is essential as it provides a precise description of what has been studied. It will therefore improve the understanding of the results further derived from most questionnaires. Descriptive statistics lends itself to graphic presentations such as histograms, sectorial diagrams, or pie charts.
Data Analysis
This step allows for the sorting of data and the cleaning of data that may be vague, inadequate, or misleading. The proper use of data analysis techniques is important at this stage. Data analysis techniques consider each answer as a potential explanatory variable. If there are “n” answers there will be “n” spaces, but an individual is not able to think in more than a three-dimensional space. For that reason, the technique consists in representing these “n” spaces in a two-dimensional space, to make them more readable, and allow for comparing. Then, after this spatial projection, each space corresponds to an axis, also called vector, more or less explanatory of the subject studied. The developer may then choose the quantity of information he wishes to see explained by the variable retained and thus determines the number of explanatory variables to be used in the follow-up analyses.
Inferential Statistics and/or Econometric Analysis
Thanks to the econometric analysis and depending on the data selected before, the developer may determine which type of individual (age, sex, occupation, income level, etc.) is more likely, for example in a risk-taking survey, to take risks related to the subject of the study, or uncover which variables influence risk taking. Inferential statistics lead to testing the significance on series determined before, or test cohesiveness or homogeneity. This step is to be done by a statistician.
When these first four stages of the process have been completed, the final step consists in developing and writing the results in a language and tone that the target audience will understand (board of directors, management, staff, economic partners, and any other internal or external stakeholders when dealing with risks). Graphic presentations may help visualize statistical results. It is often essential that interviewees themselves be forwarded the results, maybe in the form of an “executive summary”, especially if they wished to be informed and might need to be interviewed for further studies. This is particularly true in studies concerning an organization's risk management practices as all interviewees are likely to be stakeholders and monitoring their perception through time is essential to manage the risk management efforts, let alone in terms of risk to reputation. (However there are situations where the organization may not want to disseminate results too widely because they could help competitors and create a competitive disadvantage; also the media may make an inadequate use of the information for the organization's sake.)
Appendix A: Questionnaire on Corporate Reputation
Implementation of the Process in the Case of Risks to Reputation
The model to manage risk to reputation (see Section 3.1 on risk to reputation in this book), stresses the importance of consulting stakeholders to define a reputation index that can be monitored. As an illustration of the process a risk to reputation questionnaire has been developed. To better illustrate the process we have selected one specific driver and one specific stakeholder, chosen among the list provided in the previous article. This questionnaire presents a common model for a study, in the pole “action”, of the perception of risks to reputation of the staff (stakeholder) through a “leadership/governance” approach (driver). It might be written the following way:
In Your Opinion:
- Is reputation a key factor in reaching your company's strategic objectives?
EssentialVery
importantModerately
important
No impact - Have you formalized any metrics to measure your company's reputation?
YES NO DON'T KNOW - How do you measure your company's reputation?
a. Specific field evaluation b. Informal observation c. Financial results d. Media coverage e. Published ranking f. Others - What are the key drivers for your company's reputation? (check/tick the “key” for you)
DRIVERS KEY (?) a. Ability to attract and retain best talents b. Quality of management c. Corporate social responsibility (community) d. Sustainable development (environment and future generations) e. Innovation f. Cover extensions and quality g. Claims handling and insured satisfaction h. Efficient use of corporate assets i. Financial soundness j. Long-term investment value k. Effectiveness in doing business globally - Could you rank from 1 to 11 (1 – key to 11 – little or no impact) the same “key drivers”
DRIVERS RANK a. Ability to attract and retain best talents b. Quality of management c. Corporate social responsibility (community) d. Sustainable development (environment and future generations) e. Innovation f. Cover extensions and quality g. Claims handling and insured satisfaction h. Efficient use of corporate assets i. Financial soundness j. Long-term investment value k. Effectiveness in doing business globally - What impact level do the following factors have on your company's reputation?
Factor Essential Very important Moderately important No impact Clients Employees CEO's reputation Stockholders Public Officials Media – press Media – Radio & TV Media – social media Financial Analyst Activity Analyst Trade Union Internet Plaintiff Attorneys - When selecting the present CEO's successor, how important will his/her potential impact on the company's reputation be?
Essential Very important Moderately important No impact - How important is Internet for your company's reputation, through …?
Question Essential Very important Moderately important No impact Internet strategy management Control negative information on Internet Internet monitoring (blog and forum) - What would be your definition of corporate reputation?

- Finally, do you have any further comment on your perspective on corporate reputation in the insurance and reinsurance industry (including the pertinence of the questions above)?

PLEASE RETURN COMPLETED QUESTIONNAIRE BY EMAIL, MAIL or FAX
BY precise deadline
2.5 ENTERPRISE RISK ANALYTICS SYSTEMS
Richard Connelly, Ph.D.
Founder and Director, Business Intelligence International
Jean-Paul Louisot
Formerly Université Paris 1 Panthéon-Sorbonne, Directeur pédagogique du CARM Institute, Paris, France
“Risk doesn't mean danger – it just means not knowing what the future holds.” (Peter L. Bernstein)
This quote is at the heart of what risk management should be for any organization, whether when managing the potential downside of an investment or putting a value on the option of waiting when making irreversible decisions. The ISO 31000:2009 RM standard points to the needs for applying sound enterprise business intelligence analysis to risk management programs through the alignment of the GRC – Governance/Risk Management/Compliance Triangle.
Long before “analytics” came to be known as the reference for the compilation of decision information within and outside an organization, Howard Dresner in 1989 proposed a definition of “business intelligence” as an umbrella term to describe “concepts and methods to improve business decision making by using fact-based support systems” (Dresner, 2009).
Enterprise-wide risk management maturity means auditors' assertions can state that decision making is based on reliable data management processes that comply with governance requirements and legal matters management controls. This can be achieved only through maintaining documented assurance that international standards for evaluating performance accountability, reporting transparency and audit integrity are embedded in the roots of organizational culture.
The value of an investment in enterprise risk management information, as requested in the ISO 31000 standard, may be assessed by the depth of risk factors disclosure information reported to stakeholders and credit analysts. Credit agencies need “reasonable assurance” that the risk assessment data is reliable and consistent throughout the organization. Technical advances in enterprise information technology provide the means to connect management's performance guidance statements to predictive analytics that correlate financial results with asset–liability reserves and risk mitigation response plans. These are the key elements that investors, underwriters and regulators are assessing when stress testing economic forecasts and applying valuation models to capital liquidity analysis.
2.5.1 Enterprise Risk Management Analysis Information Orchestration
ERM – Enterprise wide risk management – is a global and integrated approach to risk management program implementation:
- Global means that ERM programs take into account all risks, upside as well as downside, across all legal entities and work functions to ensure optimum risk taking through proper management of risks, i.e. curbing threats and enhancing opportunities. An organization can confirm whether its risk management decision-making process is effectively orchestrated by documenting how the transaction data in its information assets is connected to key decision makers, who have IT access privileges into relevant risk monitoring information systems.
- Integrated means that all the organizations' functions and processes are involved, as risk owners who are responsible for the risks they control and accountable for their proper management. It supposes that a risk management culture is grafted on the existing organizational culture. It applies audit practices that monitor how specific workflow controls are applied to risk management documentation that impacts upside and downside results.
Enterprise risk management and loss control programs are efficient only if they are based on consistent, complete and reliable risk management documentation. This is why every organization can improve risk management decision making at all levels, from strategic to tactical, by applying business intelligence analytics to generate risk exposure insights from their information system assets.
Enterprise risk analytics (ERA) systems integrate enterprise-wide data flows for management reporting, business planning, internal controls testing, and credit evaluation. The evidence of ERA systems use helps to fulfil regulatory oversight needs for transparent reporting. Data management logs that show IT Governance practices are orchestrated across risk management collaboration groups support enterprise corporate governance objectives for performance reporting accountability, regulatory compliance fulfilment, and audit assertions integrity.
The processing capacity of enterprise information architecture has expanded to accommodate “big data” transaction file sizes and “in memory processing” of complex calculations. The business intelligence technical reference to ETL (extraction, transformation and loading into functional data marts) has been supplanted by the computational capability to do direct analytic calculations against transaction files. This reduces storage requirements, processing time and applies risk detection to more immediate notifications across a broad monitoring array of operational and financial system mappings.
Enterprise business intelligence analytics systems ensure that there are consistent definitions and calculations in the data management foundations of business reporting and analysis. These are the primary business intelligence functions that apply to documenting enterprise-wide risk management decision analysis practices:
- Performance management scorecards show risk evaluation in change monitoring metrics.
- Organization reports profile job role performance responsibilities and accountability management metrics.
- Data mining programs are applied to operational processes for data quality assurance, detective controls and risk mitigation role responsibilities.
- Data security administration logs show IT Governance oversight is applied to risk management collaboration networks and role-based access to key documentation.
- Risk notification logs show risk alerts communicated to risk management collaboration group members.
- Master data management practices documentation fulfils IT governance auditing standards for audit test design benchmarking.
Risk management culture auditing is reflected in assessing how information that passes IT governance standards is used by directors and officers to confirm there is enterprise-wide oversight of risk management performance roles delegation. The chief executive officer (CEO) and chief financial officer (CFO) of public corporations have fiduciary oversight responsibility to certify the integrity of internal risk controls. The application of enterprise risk analytics information to specific ISO quality standards illustrates to stakeholders that risk management culture principles originate at the top of the business's hierarchy. ISO implementation status reviews set the “tone at the top” that reinforces the organization's commitment to managing risk enterprise-wide through each person's job activities.
The consolidated documentation of how enterprise analytics systems, IT governance and risk monitoring outputs are orchestrated by senior management forms the basis of enterprise risk factor case reviews; these confirm organization roles' decision-making accountability for achieving risk management culture goals.
Management agendas for enterprise risk analytics reviews are set by prioritizing specific risk factors that may rise to the strategic impact level. The ERA review process covers all issues that may have a material impact on financial results. Each risk factor is associated with programs or projects where managers are assigned to assess upside opportunities and downside loss exposures.
The ERA agenda always includes core topics such as Cyber Risk Exposures, Stage 1 Disaster Recovery Plans, Business Continuity Risk Mitigation Plans and Systemic Investment Market Risk Exposure Response Plans. The chief risk officer (CRO) also puts significant Insurance Coverage/Catastrophic Loss potential/Risk Retention decisions on the agenda for active discussion of financial and operational risk treatment plans.
Enterprise risk analytics systems' information can solve the problem of connecting risk management program plan objectives across organization departmental silos and external supplier/vendor networks. Outcomes from enterprise risk analytics reviews provide assurance that risk management plans fulfil fiduciary oversight of six key risk management orchestration factors:
Financial and Credit Reporting
- Risk factor disclosure information is linked to the correct legal entities, financial statements and general ledger financial account balances.
- Financial statement accuracy is validated by systematic tests of GAAP, IFRS and statutory accounting standards reconciliation.
- Risk exposure analysis detail reports fulfil disclosure information frameworks proscribed by credit rating agencies, banking relationships and insurance underwriters.
Legal Matter Management
- Insurance coverage analysis is assessed for enterprise coordination of coverage across insurance policies with primary, excess and reinsurance underwriters.
- Supplier/vendor and customer contracts are analyzed for ISO Standards alignment and risk factor exposures impact.
- Legal case status analysis calculations are aligned with loss development forecast reports and financial reserve account balance statement updates.
Audit Programs Synchronization
- Tax liability analysis preparation reconciles with federal, state and local authorities' reporting schedules and accounting reconciliation programs.
- Regulatory reporting analysis confirms the systems of record and workflow controls for aligning compliance standards documentation.
- Regulatory compliance metrics are benchmarked to synchronize audit test plans and examination processes.
IT Governance
- Risk management documentation access privileges are aligned with risk management collaboration group members' roles.
- Data security administration practices fulfil professional standards for privacy management controls over financial and operational information.
Risk Exposure Analytics
- Claims experience trends are monitored systematically.
- Risk root-cause event analysis identifies the physical locations of potential losses.
- Risk management program leaders are able to assess the factors that impact loss development forecasts.
Risk Management Programs
- Loss controls planning documentation is updated systematically to reflect changes in loss experience and risk mitigation success.
- Risk treatment plans are associated with insurance coverage and risk retention analysis.
- Risk management skills training is provided to key roles participating in risk management programs.
Chief risk officers and other staff members who prepare enterprise risk analysis cases for senior management reviews maintain enterprise-wide oversight of the organization decision making roles that contribute to evaluating resource time and expense budget line items. These oversight steps are critical to confirm risk management programs are operationally viable.
Risk management program implementation plans include ongoing assessment of enterprise risk management indices. The index includes inherent risk assessments of potential maximum loss severity events that address catastrophic risk planning. The residual risk assessment will show how COSO (Committee for Sponsoring Organizations) standards for mitigation controls maturity are applied to calculating loss frequency and severity probabilities. The active use of enterprise risk analytics distinguishes legal entities that are able to link risk management program decision owners to the specific risk assessments and risk mitigation plans for his/her areas of job role responsibilities.
2.5.2 Making the Case for Enterprise Analytics Systems to the Board
Insurance, reinsurance companies and banks have regulatory guidelines in place to frame ERM programs goals for managing business process risks in the wake of Solvency 2 and Basel banking standards enforcement. Responsible board members in all companies need to understand how the use of enterprise risk analytics systems relate to assessing decisions that strengthen management capabilities to predict opportunities for growth and prevent potential losses.
ERM or enterprise-wide risk management topics are now high on the boardroom agendas of financial committees, human resources/compensation committees, and risk committees. Whatever board committee structure is in place, board consensus on both upside opportunities, and downside threats, are clearly the cornerstone of directors' fiduciary monitoring responsibility for the GRC triangle's principles that connect governance, risk and compliance oversight standards.
Managing risk uncertainty is essential to develop and execute enterprise performance strategies that can adapt to the unexpected – and still deliver company value expectations to all stakeholders. The main driver is to target the application of enterprise risk analytics systems from directors' understanding of the complexities in enterprise risk case prioritization decisions, whether the subject may be maintaining desired credit rating documentation or applying risk analysis information to business continuity contingency planning.
Directors and officers recognize that each entity must develop its own risk management program plans. They must assess whether internal resources that do not have access to risk analysis systems have adequate capacity to maintain reporting programs accountability and their risk mitigation treatment plan responsibilities. As risk information reporting requests from regulators and business contract counterparties expands, the need increases to monitor fulfilment of risk management-related reporting responsibilities for the organization's goals and strategic performance management missions.
Regulatory changes in global financial risk information reporting from “systemically important financial institutions” provide test cases for all directors and officers to assess how they are adjusting banking and insurance information exchange practices with “SIFIs” that may be “too big to fail.”
US regulators are linking the systemically important financial institutions' (SIFIs) capital adequacy calculations with bankruptcy stress testing analysis reports. SIFIs are required to file corporate living wills (CLWs) documentation that shows how their simulations of global asset value meltdowns are linked to risk mitigations plans and ultimately to bankruptcy trustee filings. SIFIs' CLW reports provide inputs for all company treasurers to assess how their bank's and investor's stress test scenarios affect Treasury management contingency plans.
Intraday credit monitoring regulatory changes are now in place to reduce the threats of how asset liquidity meltdowns can freeze global banking relationships. Over-the-counter derivative instruments now require three-way settlement reconciliation with clearing banks to assure adequate margins are on deposit to match derivatives transactions. Investor cash balance adequacy assurance now requires the enterprise total collateral valuation reports support financial guarantees. Portfolio securities price value aging must be disclosed to investors. Companies that are near credit cap requirements must prioritize daily securities trades in advance of a common (US East Coast) afternoon settlement time. Maintaining securities settlement fiduciary documentation simply requires risk analytics mastery to exchange information and risk notifications with investment counterparties.
The case for enterprise analytics systems starts at the top of the organization with assessment of the largest risk exposures. The following box provides a partial explanation of enterprise risk analytics systems benefits that are relevant across all organization levels.
All US 10 KQ filing companies are on an XBRL detailed reporting implementation timetable to apply disclosure analytics to financial statement account line balances and footnotes. The filings are used by investors and regulators for industry peer group performance analysis. (XBRL is a global data tagging standard for exchanging information through accounting taxonomyschemas and linked databases that are tested for financial reporting validation checks.) The XBRL Analytics tagging framework has also been extended to cover all investment securities' corporate actions events that relate to changes in the valuation of capital and equity.
Should your company not have had the ERM discussion in the boardroom yet, it will happen soon. Obtaining the board's support is necessary but not sufficient for successful ERM program implementation.
Table 2.1 shows a set of enterprise risk analysis cases that have risen to the strategic review level in many companies. Case review issues and functional leadership highlight topics covered and organization participants who are typically involved in risk management analysis and risk treatment program planning. All companies will add a priority rating and risk readiness evaluation to the specific issues that apply to their legal entities.
Table 2.1 Enterprise risk analysis case issues
| Risk Management Programs | Case Review Issues | Functional Leadership |
| Cyber Risk Treatment Plans |
|
|
| Property – Environment Treatment Plans |
|
|
| Accident and Safety Treatment Plans |
|
|
| Health & Wellness Treatment Plans |
|
|
| Pension & Savings Programs Treatment Plans |
|
|
| Investment Market Risk Plans |
|
|
| Country Risk Recovery |
|
|
Risk treatment plan leaders use risk analysis metrics dashboards to plan and control risk management programs. Table 2.2 shows examples of organizational job roles that maintain key information that goes into risk analysis decisions and implementation activities for specific programs.
Table 2.2 Risk analysis metrics dashboard
| Enterprise Risk Analysis Metrics | Metric Type | Risk Management Collaboration Group Roles |
| Inherent Risk Financial Impact | Currency Value |
|
| Risk Factors Impact – Stakeholder Reporting Footnotes | Count # |
|
| Relevant Insurance Coverage Policies/Premiums – Financial Guaranty Contracts/Amount | Count # Currency Value |
|
| Claims Pending/Paid/Reserves | Count # Currency Value |
|
| Loss Adjustment Services Providers/Expense | Count # Currency Value |
|
| Related Legal Matter Documents/ Legal Matter Expense | Count # Currency Value |
|
| Residual Risk Control Tests/Audit Documents/Business Process Maturity (COSO) Assessments | Count # Assessment Score |
|
| Regulatory Authority Filings/ Regulatory Filing Documents/ Regulatory Penalties | Count # Currency Value |
|
| Risk Management Collaboration Group Members | Count # |
|
| Risk Documents Access Privileges | Count # |
|
Risk management action plan preparedness metrics provide the keys to assessing the difference between paper-based programs and executable action that reduce ultimate losses. Experience shows that success is correlated with how risk owners are empowered and trained for their enterprise risk analysis roles in ERM programs (Table 2.3).
Table 2.3 Risk management action plan
| Enterprise Risk Analysis Metrics | Metric Type | Risk Management Collaboration Group Roles |
| Risk Response Resources | Full Time Equivalent Staff (FTE) Commitment |
|
| Risk Response First Stage Recovery Budget Expense Estimate | Currency Value |
|
| Risk Treatment Plan Workshops | Count # |
|
| Risk Treatment Plan Workshop Participants | Count # |
|
Higher analytics system user percentages of all company managers leads to measureable success in loss experience ratings that lower the cost of risk and increase performance goal forecasting accuracy. The information in the Enterprise Risk Analysis Case Issues and the Enterprise Risk Analysis Metrics Dashboard examples provide baselines to evaluate how well current IT Assets support risk management planning and control. Understanding Risk Information Cycle Management “gaps” between current risk decision information reliability and desired risk analytics mastery targets is the foundation of risk management planning leadership.
Reference
Dresner, H. (2009) Profiles in Performance: Business Intelligence Journeys and the Roadmap for Change. New York: John Wiley & Sons.
2.6 EMERGING ENTERPRISE RISKS FACING THE US HEALTHCARE INDUSTRY
Robert L. Snyder, BA, JD, ARM
Professional risk advisor and a member of the Texas Bar. and has served as Adjunct Lecturer in the College of Business at the University of Houston – Downtown
Healthcare delivery is one of the most complex industries in modern American society. Taken as an “enterprise”, healthcare is comprised of a diverse set of service providers and stakeholders, ranging from direct healthcare providers represented by physicians, nurses, therapists and an array of other clinicians and allied health professionals. There are institutional care facilities such as hospitals, long-term care facilities (e.g. nursing homes, assisted living facilities, senior living communities), rehabilitation centers, ambulatory surgery centers, diagnostic imaging centers, and other facilities. On the supply side there are pharmaceutical and medical device manufacturers, and medical research facilities. On the business end there are private and institutional investors and shareholders in many of these businesses. Finally, there are the payers for services, including governmental programs, such as Medicare and Medicaid, health insurance companies and self-insured employers.
Healthcare is an enterprise that touches every individual throughout life in material and profound ways that other industries do not. There are many products and services one might elect to purchase or not purchase in the course of a lifetime (a house, an automobile, a personal computer, a vacation, a college education – all “elective” purchasing decisions). However, it is virtually 100% certain every person will need healthcare within the delivery structure that exists for providing it at a given point in time during his or her life.
The business, technological, political and societal influences on healthcare are also complex and interrelated. “Healthcare reform” efforts undertaken in the United States in the late twentieth and early twenty-first centuries (to be addressed further below) have revealed many challenges in identifying and addressing “risks” associated with healthcare.
Enterprise level risks, broadly stated, apply within the healthcare industry as they do in a host of other settings, along the following lines:
- Financial risks.
- Hazard risks.
- Operational risks.
- Strategic risks.
Financial risks can be generally defined as risks affecting profitability, and/or economic efficiency in the case of not-for-profit institutions. Financial risks include those that impact the enterprise's cash position, access to capital or favorable financial ratings, business relationships with other parties, such as suppliers, and the timing of recognition of revenues and expenses.
With respect to healthcare, while the “system” overall is comprised of an amalgamation of both for-profit and not-for-profit sectors, “profitability” applies to both. In for-profit endeavors, it is easy enough to understand that investors seek a return on their capital that is at risk in the enterprise. Although much healthcare is provided through not-for-profit institutions, these entities likewise must normally earn a financial margin (a surplus that is akin to profit) to be sustainable. For instance, a common motto among faith-based, not-for-profit healthcare organizations is, “no margin, no mission.”
The government at various levels has a major and increasing role in delivering and managing healthcare. Arguably the government does not seek to, and need not be concerned about, operating at a “profit.” However, if entities under governmental control accumulate large deficits over time, the burden falls on the taxpayers, which has significant political consequences, including the continuation (or not) of certain programs.
Hazard Risks, generally speaking, are risks resulting in loss or damage to physical assets of the business, or injury or property damage to other parties, including customers, patients, employees, business trading partners or other third parties, arising from the actions or alleged negligence of the business. Hazard risks are sometimes thought of as “insurable risks,” in that they are comprised of the types of damage or injury for which most businesses can readily purchase insurance. Examples in the healthcare setting include medical malpractice and product liability lawsuits, and natural disasters (e.g. hurricanes, tornadoes, floods) causing damage to facilities such as hospitals or nursing homes.
Operational Risks refer to risks to the ongoing conduct of the business that result from changes in business practices, allocation of entity resources, effects of external regulations or requirements, inadequate or failed internal processes, people or systems. Operational risk is sometimes referred to as the risk associated with “doing the (strategic) thing right.”
Strategic Risks are risks that impact the organization's ability to achieve its broader goals and objectives, such as risks to market position or reputation, or the risk that a business plan to which major resources and effort are committed will ultimately not be successful due to lack of acceptance in the marketplace. Strategic risk is sometimes referred to as the risk associated with “doing the right thing.”
In fact, it is important to understand strategic risk management, in particular as a critical component ultimately driving “enterprise” risk management. “Strategic risk” is associated with adopting or not adopting the correct strategy for the organization in the first place, or, once adopted, not adapting the chosen strategy in response to competition or other forces. Strategic risk management contemplates the integration of strategic planning, the setting of organizational objectives and the identification of “risk” with the organization's enterprise risk management program.
Enterprise risk management addresses risks to strategy at its core. ERM significantly looks for critical risks (and, as noted below, opportunities) associated with the defined strategy. In the context of healthcare reform (to be discussed further), for instance, an important strategic shift for both providers and payers is the realignment from “fee for service” medicine (i.e. the more services and procedures provided the more revenue generated) to “global” type payments that will generate rewards, presumably for all parties, including patients, through wellness and quality metrics associated with managing the health of certain defined populations, especially including population groups characterized by common chronic conditions, such as hypertension, obesity and diabetes.
It is further important to note that “risk” does not merely denote the likelihood of failure. Risk also represents opportunity, and in fact, from a business perspective in healthcare, or other industries, any opportunity worth pursuing is likely to entail risk. A chairman of Lloyd's of London phrased it this way:
But risk management is not simply about preparing for the worst. It's also about realizing your full potential. With a clear understanding of the risks they face, businesses can maximize their performance and drive forward their competitive advantage.17
Further, it will be obvious that while the “four quadrants” represent a convenient manner for broadly categorizing risks, risks within each quadrant do not exist in isolation from the risks in other quadrants. There is significant overlap, and an area of convergence, where particular risks may be regarded concurrently as financial, strategic, operational or hazard risks in various combinations. “Enterprise-wide” risk management essentially focuses on the overlapping risks. These risks might be thought of by the managers or leaders of the enterprise in the form of the question, “What keeps you up at night?”
To illustrate within a specific segment of healthcare, consider for a moment the risks associated with a Managed Care Organization (MCO). The MCO is typically a third-party payer for medical or other healthcare services, such as a health insurance company or Healthcare Maintenance Organization (HMO). These are licensed, regulated entities, business enterprises generally subject to a specific set of laws and regulations promulgated on a state-by-state basis. Within the context of “managed care,” not only do these entities negotiate contracts to pay healthcare providers, typically on behalf of employer-funded health insurance programs, they establish the parameters for coverage, such as which tests and procedures will be covered, what treatments will be accepted, based on a particular diagnosis, and what preventive services will be offered.
Examples of risks within each of the “quadrants” appear within Figure 2.3. For many MCOs these risks (or some subset thereof) have been the focus of attention for quite a long time. In the current environment, where new or significantly modified risks will arise under recently enacted federal and state laws, consider how the illustrated risks might change.
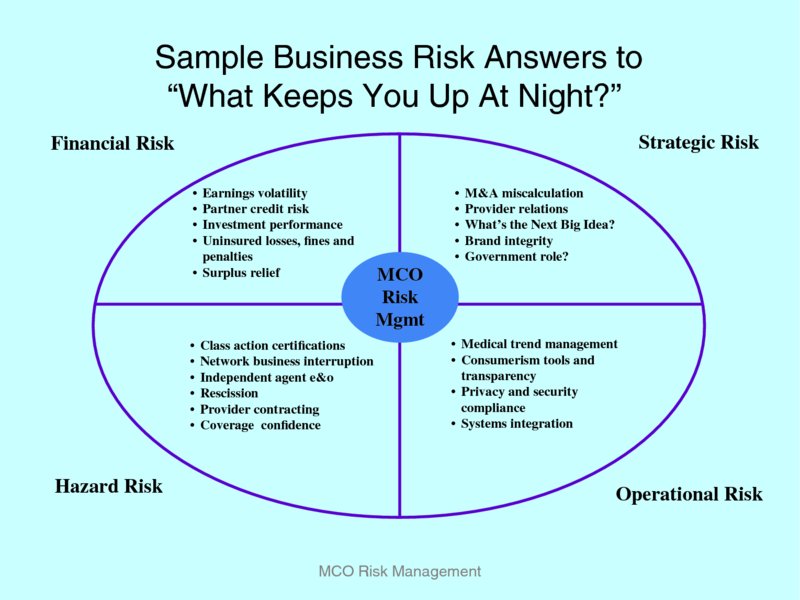
Figure 2.3 “What keeps you up at night?”
Similar matrices can be created for other business sectors, which collectively represent the sweep of entities comprising the healthcare industry.
One overriding factor impacting enterprise risk in the healthcare industry has been the evolving healthcare reform. During the past generation the first serious reform at the federal level was the effort actively promoted during the first term of the Clinton administration in the early 1990s. “Reform” objectives had long been debated both in society and in Congress. Generally, these objectives related to proposed measures for increasing access to healthcare by a large and growing segment of the population lacking health insurance, coupled with measures designed to control costs and improve outcomes for those receiving healthcare. For many years, influenced by many factors, medical cost inflation had outstripped inflation in the general economy. At the same time, despite an ever-growing proportion of the United States' gross domestic product consumed by the cost of healthcare, the country actually began to lag behind other developed economies in a number of quality indicators.
Ultimately, the healthcare reform effort of the 1990s did not succeed, but the nation's attention was focused on the issue in a way that it had not been in many years. Coming into the 21st century, the effort was rekindled after the election of Barack Obama as president in 2008. Although there was great political and public debate, in 2010 Congress passed the Patient Protection and Affordable Care Act (PPACA), the most sweeping set of reform measures relating to healthcare in many years. The new law was challenged in federal court, ultimately leading to the 2012 decision by the U.S. Supreme Court18 upholding the major provisions of the law.
The Supreme Court decision, coupled with the re-election of President Obama to a second term in November, 2012, have made it clear healthcare reform is here to stay for the foreseeable future. Profound implications are created at the enterprise level for entities and providers involved in the delivery of healthcare.
Thus, enterprise risk management stands to be a topic of increasing importance in healthcare. It remains to be seen exactly what risks will emerge and how they will be managed, but the following are suggested as major risk drivers, which will impact different sectors of healthcare:
Accountable Care Organizations (ACOs)
PPACA provides for the formation and licensing at the federal level of “umbrella” entities within geographic areas that will contract with healthcare providers and manage the delivery of care to designated population groups participating in governmentally funded programs, particularly Medicare (primarily focused on the elderly) and Medicaid (primarily focused on the poor). ACOs will be financially incentivized by the government to contain costs and improved quality through a shared savings program and a set of metrics relating to health outcomes of the population served. ACOs are required to be independent legal entities and may be not-for-profit or investor owned. Health systems, for instance, will be being challenged to determine whether there is a particular competitive advantage (or disadvantage) to them in ACO development or participation.
Health Insurance Exchanges
PPACA also directs the creation of state run health insurance “exchanges,” which will serve to provide insurance to segments of the population that might otherwise be unable to obtain it. States are incentivized within the law to participate in the exchange program on an optional basis through enhanced funding from the federal government to support the Medicaid program, which has long been administered at the state level. For states that reject the option and refuse to establish exchanges, the federal government is authorized to set up the exchanges.
Population Health Management
An important aspect of healthcare transformation will be the management of care within specific “populations” in ways not previously utilized. This might include, for instance new collaborations among providers targeting specific chronic diseases, such as high blood pressure or diabetes, affecting a certain population segment. Care will require coordination among specialists, which may or may not be formalized by specific contractual agreements allocating legal and financial liabilities. Revenue sharing among collaborating providers will have to be agreed. Population health management is likely to transcend medical care and also involve “quality of life” assistance from home aides, for instance, running errands or assisting with household needs.
Decreases in Reimbursements to Providers
Over a period of years the federal government will substantially decrease the level of reimbursements for many healthcare services provided primarily by physicians and hospitals. Presumably, the providers will have access to a larger insured population and thus the reduced reimbursements will be offset by greater volume generating additional revenue for the providers, as opposed to them having to “write off” a certain proportion of uncompensated care provided to an indigent population.
Physician Employment and Contracting
The complexities associated with complying with the new law, and the need to be part of provider networks, are likely to have the practical effect of forcing many physicians out of their traditional independent practitioner roles and into either direct employment by hospitals or health systems, or into various contractual relationships that will result in a high degree of control over their practices. This trend is well underway in many parts of the country. The acquisition of physician practices and the negotiation of physician employment contracts are both complex undertakings.
Electronic Medical Records and Patient Privacy Considerations
Going beyond the 1996 HIPAA act, the new law effectively mandates that healthcare providers adopt and implement systems for electronic medical records, in order to facilitate the timely and accurate exchange of patient information among an array of providers, such as primary care physicians, specialists and hospitals. The federal government has allocated “stimulus” funds available to providers to encourage their adoption of EMR systems. At the same time, providers are subject to strict constraints and penalties under a prior federal law, the Health Insurance Portability and Accountability Act of 1996 (HIPAA), for security breaches resulting in the intentional or unintentional disclosure of “personal health information.”
Implications for Medical Technology Companies
Both pharmaceutical companies and medical device manufacturers stand to be impacted by material changes in the healthcare business environment. Pharmaceutical companies will be under pressure to document the effectiveness of medications in producing positive clinical outcomes at acceptable cost for various populations under medical management. Insurers may refuse to include medications falling outside certain parameters on their approved formularies. Funding for development of new therapies may become more difficult to generate. With respect to device manufacturers, they are impacted by a new 2.3% excise tax called for by the Accountable Care Act as of January 1, 2013. Small start-ups, in particular, which represent a material proportion of all medical device development may be disproportionately impacted and placed at a competitive disadvantage.
Industry Consolidation
As the impact of many aspects of the healthcare reform law at the federal level, and various counterparts at the state level, takes hold the financial viability of many healthcare entities will become tenuous. In a competitive environment inevitably there will be consolidation and contraction in various forms, such as through mergers and acquisitions. This activity logically will increase the probability that investors, such as shareholders, and other stakeholders will find themselves financially disadvantaged and will seek legal redress.
All of these risks, as well as others undefined, can be seen as emerging “enterprise” risks for healthcare organizations. Enterprise risk management, therefore, stands to serve a major role in development of business strategies for the healthcare industry in the years to come.