
2
Key performance indicators in assessing new technology for electricity transmission and distribution networks
Abstract
The chapter presents a scientific analysis of how much modern products and systems from the electricity industry contribute to the European Union's efforts to mitigate climate change. A methodology is proposed to quantify the possible environmental benefits in terms of efficiency increase, CO2 reduction, and a wider use of renewable energy resources as well as of power quality improvement provided by a renewal of the European T&D infrastructures.
Such methodology is based both on the identification of suitable technical KPIs (key performance indicators) to be used to rank the benefits brought by the different grid upgrading measures and on the definition of suitable “test networks,” which can be employed as benchmarks for performing the numerical evaluation of the introduced KPIs.
Keywords
Emissions reductions; Energy efficiency; EU policies; Key performance indicators2.1. Introduction
The European Union (EU) climate and energy policy has established targets for efficiency, CO2 reduction, and increase of renewable energy by 2020 (Delfino et al., 2010; EU's Climate and Energy Policy, 2008; Gellings, 2008; Negri, 2009). The energy supply system represents a powerful element that can help in achieving such environmental targets.
The efficiency of the transmission and distribution (T&D) infrastructure can be easily increased as a consequence of the deployment of a renewal process using state-of-the-art technologies made available by the electricity industry. In addition, the improvement of T&D grid efficiency can also benefit the production side: indeed, considering the same power demand on the grid, it could allow a decrease of the power generated by fossil fuel plants, thus resulting in a reduced environmental impact. This task is currently faced by researchers, industry technicians, and field specialists in all the Member Countries. Many studies have been carried out by universities and research centers, as well as electrical companies and international workgroups or task forces, on energy saving topics. As an example, a general simulation tool, called PRIMES, was recently proposed to assess the impact of the new EU policies in the power system sector (Capros, 2006). In this context, it is necessary to identify suitable key performance indicators (KPIs) (Bonfiglio et al., 2011) that can be used to rank the benefits attained by the different grid upgrading measures.
On this subject, the European Electricity Grid Initiative (EEGI) is one of the European Industrial Initiatives under the Strategic Energy Technology Plan (SET-PLAN) that proposes a 9-year European Research, Development, and Demonstration (RD&D) program to accelerate innovation and development of electricity networks of the future in Europe. The program focuses on system and technology innovation, and addresses the challenge of integrating new technologies under real-life working conditions (EEGI, 2010).
The SET-PLAN aims at coordinating efforts at the national and EU levels through joint strategic planning and effective implementation mechanisms. European Industrial Initiatives are industry-driven strategic technology alliances to address low-carbon energy technologies (Investing in the development, 2009).
Following the guidelines provided by the European Union, the aim of the present chapter is to propose a methodology for defining and evaluating environmentally oriented KPIs that will be directly related to the 2020 EU targets. Some results relative to simulations performed on both transmission and distribution benchmark networks are presented to achieve the following goals:
1. To verify that the single KPI definition is well posed, i.e., it is able both to identify the key point one is focusing on and to represent a useful tool for ranking the different interventions on the grid;
2. To verify that the KPI can be easily calculated (by means of simulation tools) or directly measured in the field after the intervention to which it refers;
3. To provide a tool which could be helpful in optimizing a “smarting action” on the electric network. For instance, if a project is mainly focused on the installation of a single device or a complete system, the methodology here presented could be adopted to find out the best configuration in terms of number of devices to be installed, their location, and mode of operation.
Furthermore, a set of possible benchmark interventions on the grid are discussed with reference to the following three different areas:
• New power and/or ICT components, in terms of both replacement and additional installations;
• New control strategies of production units;
• New network operation strategies.
2.2. Key performance indicators to assess the environmental impact of transmission and distribution networks
The electric T&D infrastructure represents a complex interconnection between different players that interact at different levels. From the KPIs point of view, it can be useful for summarizing such players and their correlations as described in Figure 2.1.
The electric grid infrastructure accounts for multiple operators that own and manage their grid share; the electric transmission grid is in charge of the national Transmission System Operators (TSOs), each one receiving generation (A) and feeding significant customers (B), as well as transferring most of their flows toward the distribution grids (D). Neighboring TSOs account for mutual support (C) in normal and/or emergency operations.
The electric distribution grid is in charge of several distribution system operators (DSOs), each one feeding a large amount of customers (B), receiving at the same time a large number of dispersed generation injections (A), as well as interacting with the transmission level of the grid (D). Currently, DSOs do not account for support from neighboring DSOs (C), but this could happen in the near future moving toward the new paradigm of smart distribution grids (El-Hawary & Christensen, 1979; Kothari, 2006; Lee & Yang, 2004).
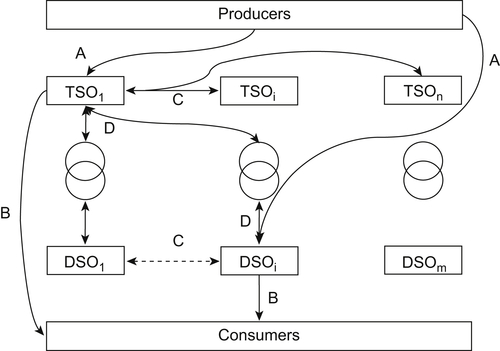
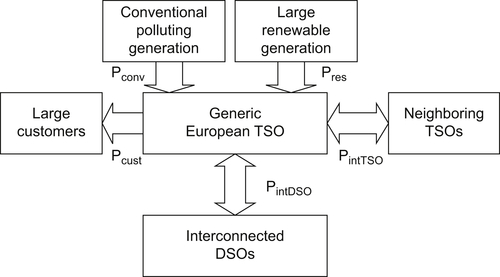
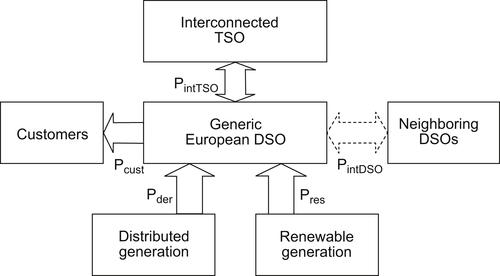
Such architecture for the power system can lead to two possible schemes (Figures 2.2 and 2.3) of interaction in terms of power exchanges between generic TSO and DSO; dotted arrows in Figure 2.3 denote represent absence of physical interconnections among bordering DSOs. Both schemes are useful for a better understanding of the KPIs definition.
In light of this scenario, the KPIs can be defined in several forms. The first is a short-term (instantaneous) approach, expressed in technical merit, which evaluates the benefits of the introduction of T&D state-of-the-art (modern) technologies mainly in terms of energy per time units, which is power, or electrical aggregated flag quantities. The second can be considered as an integral approach (energy), to be computed on a specified time frame, which can be converted into an economical merit, such as simple payback time. This approach includes accurate estimation of investment costs for any additional device to be proposed. The third approach also embraces probabilistic concepts, particularly useful for rating dynamic performance indices. A complete evaluation should be based on all three approaches; despite this, first one is chosen, since it is the most straightforward and does not require the collection of a large amount of data.
2.2.1. Index for efficiency
Energy efficiency should be concerned with the whole process of energy assessment from power plant conversion to final user exploitation. The concept of efficiency, in the broadest sense, is significantly linked to the availability and localization of primary resources, as well as to their being low cost and/or renewable. If the focus is centered on the electrical segment of the energy transferring process, we should therefore account for specific efficiency in Generation (introducing highly efficient generators); Utilization (profiting from highly efficient motors and drives); and Energy conveying (usually proposed in terms of loss reduction, but extendable to power quality).
As far as Energy conveying is concerned, efficiency implies CO2 emission reduction, since loss containment at a constant load profile requires less generation amount. At the same time, renewables connected to distribution grids as Distributed Energy Resources (DER) contribute to decrease current circulations and therefore enable reducing Joule losses and improving energy efficiency. Again, renewables adoption results in CO2 decrease, since the same load is satisfied by less polluting sources.
The proposed index for efficiency is related to the goal of electrical grid loss containment: efficiency and loss containment coincide if a constant load profile is assumed. A steady-state model for each branch connection is therefore necessary, and a comprehensive analytical evaluation of complex losses is required; at the same time, steady-state models for specific present state-of-the-art technologies are available and/or ready to reelaborate from the literature, just to assess their effect on component efficiency.
It should be noted that different approaches must be followed in dealing with transmission and distribution grids: in the former, state-of-the-art technologies redistribute flows and losses but require a new production profile (dispatching scenario) from all committed power plants. Conversely, in the latter infrastructure, redistribution of flows and losses does not include the modification of a generation profile, since DER does not usually request a load following service, but interconnection to the EHV/HV transmission grid acts a power balance compensation system (slack bus).
State-of-the-art technologies could otherwise affect the DER penetration level by relaxing constraints or improving margins, therefore modifying the overall generation mix. On the basis of such considerations, the performance index for energy efficiency can be thus defined as “Network losses normalized to total load request.”
The computation of grid total complex losses can be carried out according to Kron-Early loss formulas (CIGRÉ, 2004; Mutale & Strbac, 1992), which are easy to implement within classical optimal power flow (OPF) formulations.
2.2.2. Index for CO2 reduction
The problem of environmental compatibility of electric power infrastructures is mainly related to the emissions associated with the energy conversion process at the generation stage. Correct management of the interconnection facilities may result in a more environmental friendly scenario, since it could enable commitment of units characterized by reduced CO2 emission or pushing these units to their maximum possible production capability.
The same steady-state model used in Section 2.2.1 for any state-of-the-art technologies becomes useful also for rating their effect on the amount of network complex losses, since efficiency in conveying energy implies CO2 reduction. The possible performance index for CO2 emission can therefore be the “Total grid CO2 emissions normalized to total load demand.”
This is the computation of an optimal generation profile which minimizes a greenhouse pollution profile, having previously determined a reliable analytical dependence of emissions on produced power. These optimization procedures enable an accounting for grid total losses via Kron-Early loss formulas (CIGRÉ, 2004; Mutale & Strbac, 1992) and for generating unit and grid constraint by means of Kuhn-Tucker conditions (Bracco, Delfino, Pampararo, Robba, & Rossi, 2013), which act as penalty factors. From a conceptual point of view, it is a widely adopted energy management procedure. This time extended from minimization of fuel costs to the maximum containment of greenhouse emissions potential of the generation set.
2.2.3. Index for renewables penetration
Conveying energy from sites of renewable production to final users is currently an arduous task facing the modernizing process of the electrical power infrastructure. A time-varying generation profile, as well as the development of renewable power in-feed, poses significant challenges in electrical network configuration and management: it sometimes occurs that the infrastructure itself, or its control and protection features, is not ready to completely host renewables access, requiring reconfiguration at several levels.
To define an index for renewables penetration, again a steady-state model for specific T&D state-of-the-art technologies is required to rate the effect of renewable DER on complex losses. Efficiency in conveying energy is indeed affected by renewables, but state-of-the-art technologies could contribute to an improvement of the percentage of renewables with respect to the total admissible generation set. The proposal for an index for renewable penetration is then the “Total generation from renewables normalized to total load request.”
This index requires the use of optimization techniques, either at unit commitment or at the generation scheduling level, where cost–production functions are needed for all the installed generation and with the renewable ones equal to zero. State-of-the-art technologies affect both grid total losses (again computed via loss formulas) and branch constraints (again expressed via Kuhn-Tucker conditions and reported in terms of penalty factors).
2.2.4. Index for steady-state quality in transmission and distribution grids
The electric power infrastructure satisfactorily fulfills its tasks if operated under normal conditions, where components and devices are typically characterized by their rated values, fixed by manufacturers to meet the best use and duration targets. Any deviation from such a profile is paid in terms of a performance reduction. Therefore, it is of common interest to limit discrepancies from an ideal working scenario, basically related to node voltages and branch currents.
As a preliminary proposal for a steady-state quality index, attention is mainly focused on voltage, according to the present operating practice proposed by utilities all around the world. Tolerance in component correct working allows maximum voltage magnitude deviations of 5% under steady-state conditions, thus limiting narrower than corresponding (minimum and maximum voltage) protection settings.
The evaluation of voltage grid profile requires a steady-state analysis of the electrical system, usually performed via the so-called power flow computation. The steady-state models for specific T&D state-of-the-art technologies are again useful for inclusion in the power flow simulation, providing a good chance of detecting the relevant modified voltage profile.
Investigation on this point reveals that the concept of system adequacy, that is, the assessment of a robust operating condition with respect to credible perturbations, must be extended to other flag quantities, for example, branch currents. Current magnitude must not exceed an overload limit, after which a control center operator intervention is required.
Most of the commercial simulations tools consider node voltage and branch current limits in the final violation report, without affecting the calculation process. Probably, an improved version of power flow analysis could include such additional constraints in the solution procedure.
In light of these considerations, the proposal for a steady-state quality index is the “Total mismatch from ideal uniform node voltage and branch rated current profile.” This requires the computation of an adapted OPF, where the function to be minimized is the sum of node voltage and/or branch current deviations from the ideal working scenario.
2.2.5. Index for distribution of harmonic power quality
Voltage and current waveforms must respect quality standards to avoid malfunctioning of end user sensible apparatuses. Time-varying, nonlinear and discontinuous working components often represent a threat in preserving ideal behavior at the so-called points of common coupling, meaning nodes where specific quality constraints are set for contractual reasons. Both converters and unsymmetrical components negatively affect voltages and currents especially at the distribution level, imposing the use of mitigating devices to contain harmonic pollution.
As a first proposal for an index for distribution of harmonic power quality, one can consider the Harmonic Distortion Factors (HDFs), linked to node voltages and branch currents, in terms of indicators of the distance between actual and ideal waveforms. The basic idea considers the definition of harmonic distortion limits, according to residential and industrial contexts, followed by the use of the harmonic power flow to evaluate HDF in every node and branch. The role played by specific T&D state-of-the-art technologies requires the formulation of their harmonic model and the computation of harmonic distortion in the modified distribution system.
The current proposal for an harmonic power quality index is therefore: the “Network total harmonic (node voltage, branch current) distortion factor average or variance.” It includes the computation of a conventional harmonic power flow and the evaluation of the sum of all node HDFV and of all branch HDFI normalized, respectively, to the n nodes and the b branches inside the distribution grid.
2.2.6. Index for transmission dynamic quality
Quality of service is often referred to in its steady-state meaning, whereas it becomes difficult to uniquely express a satisfactory transient performance of the electrical power infrastructure. Probably, the most reliable quantity for evaluation should be the system energy, but its definition and computation are far from being elementary and shared. Here, we propose a comparison of the dynamic evolution of the grid under investigation with the intervention characteristics of the protection devices operating at the transmission level, so that cascading phenomena due to a single event are considered as the main problems to overcome.
According to such an approach, a first proposal for the transmission dynamic quality could be related to the comparison between the system time behavior and the intervention curves of the installed protection devices. To do this, grid component dynamic models are required, and the installed control loops as well. Also, credible contingencies must be defined and it is necessary to identify also the protection set to be considered within this analysis. Then, transient stability simulations can be proposed for assessing grid dynamics and capability to recover a correctly operating working point. Dynamic and control models are expected for specific state-of-the-art technologies, so as to include them in the transient stability simulation and evaluate their impact on the system evolution.
Being aware of the quantities able to express unacceptable dynamic conditions at the transmission stage, which essentially consists of voltage and current magnitudes, frequency deviations, and angle displacements, the index for transmission dynamic quality can therefore be defined as the “Network cumulative proximity to starting thresholds of line distance relays (voltage, current, and angle phenomena) and load shedding relays (frequency phenomena).” This requires the computation of transient stability and the following monitoring of trajectories in terms of impedances at every transmission line ends and of frequency at every transmission bus bars.
2.2.7. Index for distribution dynamic quality
Distribution system dynamics is usually related to instantaneous deviations of voltage waveforms at each point of supply, again a typical contractual clause to be met to avoid penalties. At the present penetration level of distributed generation, electromechanical dynamics is of minor concern, even if liable to become increasingly interesting in the future. Voltage dips, sags, swells, and interruptions are detectable as typical phenomena in a short-term time frame and represent a frequent cause of economical and physical damage for the final user.
With regard to the just outlined occurrences, the first proposal for a distribution dynamic quality index is centered on the compatibility of the system time behavior with grid protection intervention curves, basically linked to overcurrents and undervoltages. Such an approach requires the collection of network components dynamic models, associated with the available control modes, as well as the definition of credible contingencies and protection systems operating at the distribution level. Then, a computation of electromagnetic transient and short circuit simulations is expected, to either validate the actual system design or identify its evident weaknesses. Dynamic and control models for specific state-of-the-art technologies are subsequently necessary, to assess their impact on the dynamic profile of the distribution grid. According to these considerations, the proposal for distribution dynamic quality index becomes the “Network cumulative proximity to ideal voltage and current waveforms (in case of dips, sags, swells),” and the “Network cumulative unsupplied energy (in case of interruptions).”
This requires the computation of electromagnetic transients and the relevant monitoring of voltage and current waveforms for generic disturbances, while an additional time computation, starting from outage instants at customer supply point, in case of interruptions is required. Table 2.1 summarizes the proposed KPIs for each considered objective.
Table 2.1
| Target | KPIs |
| Efficiency | Network losses normalized to total load demand |
| CO2 reduction | Total grid CO2 emissions normalized to total load demand |
| Renewables rate of penetration | Total generation via renewables normalized to total load demand |
| Steady-state quality in transmission and distribution grids | Total mismatch from ideal uniform node voltage and branch rated current profile |
| Distribution harmonic power quality | Network total harmonic (node voltage, branch current) distortion factor average or variance |
| Transmission dynamic quality | Network cumulative proximity to starting thresholds of line distance relays (voltage, current, and angle phenomena) and load shedding relays (frequency phenomena) |
| Distribution dynamic quality | Network cumulative proximity to ideal voltage and current waveforms (dips, sags, swells) Network cumulative unsupplied energy (interruptions) |
2.3. Test networks
All the main components of a typical grid must be modeled in the test network to represent, their impact on the system performance and also the interaction with other components, such as large generators, DER, renewables, distribution transformers, large, concentrated, industrial loads, or residential “distributed” loads.
Several test systems can be found in the literature with reference to different specific topics under investigation. In Bracco, Delfino, Pampararo, Robba, and Rossi (2012b), a benchmark network for simulation of FACTS devices in load flow control is presented. In Bracco, Delfino, Pampararo, Robba, and Rossi (2012a, 2014), a part of a 20 kV distribution network in a rural area is represented as a “micro-grid.” This system has been used in a pilot project to establish how a network can be operated with a large amount of nondispatched power sources.
A scheme of a test network potentially useful for the analysis of the previously defined indices is depicted in Figure 2.4.
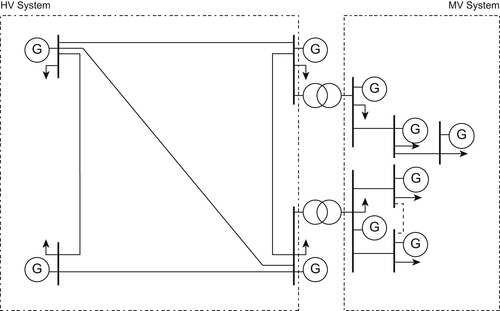
The main characteristic of the system are:
• Minimum number of nodes;
• Division into two subsystems at two main voltage levels;
• Availability of HV-MV transformer;
• Availability of both meshed and radial topology;
• Availability of generation sources at different locations;
• Availability of load at different locations.
Here, we decided to identify all T&D systems and components by resorting to suitable generalized circuital representations, able to describe different technologies and solutions, according to the parameters choice. In the steady-state domain, a proposed generalized model is sketched in Figure 2.5.
The insertion of new branches is covered by the triple of arrowed internal passive components, which also account for any replacement/refurbishment performed on existing branches. Series voltages and shunt current contributions, including Δ (variation) to intend them as modifications of the existing morphology, accomplish all possible contributions of compensating devices, and innovative transmission and/or distribution systems. Correspondence to specific state-of-the-art technologies is ensured by functional relationships of mutual dependence between the indicated voltage and the current incremental generators.
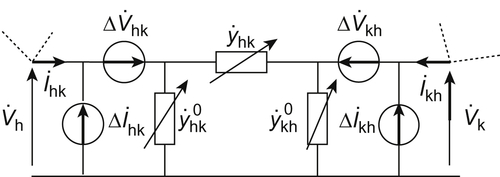
Harmonic models for components replacement or refurbishment simply ask for modification of parameters within available or predefined harmonic models. The use of advanced compensations or transmission/distribution innovative forms, whenever converters are committed, requires a general harmonic modeling including multifrequency voltage and/or current generators.
In the end, as far as dynamic models are concerned, if attention is focused on rapid electromagnetic transients, a general set of algebraic differential equations is required to represent both extremely detailed components and fast, dedicated control loops. Conversely, when electromechanical analyses are performed, still a general set of algebraic differential equations is required, this time less devoted to component modeling dynamics (apart for mechanical state variables) and widely concerning control loops at each hierarchical level (with extensive use of transfer functions and nonlinearity, whenever present).
2.4. A methodology for evaluating KPIs
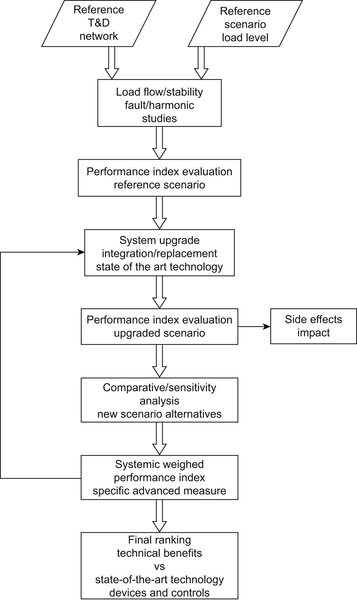
In this section, the performance indices, the modeling techniques, and the network structures previously outlined are employed for assessing the benefits and possible troubles related to the use of state-of-the-art technologies in T&D grids. With some guidelines for a technical approach for evaluating both direct and indirect benefits on T&D systems, together with side effects and mitigation, due to state-of-the-art technologies, it is possible to conceive a comparative, selective, and flexible procedure. The fundamental operating steps of the developed procedure are reported in Figure 2.6.
It should be noted that a sensitivity analysis must be developed to define the optimal setup. Modified scenarios for analysis should be chosen in such a way to explore a limited, but at the same time, meaningful set of possibilities covering applications of actual interest. Depending on the specific measure, either analytical or simulation-based approaches may be followed for the analysis; in general a refining optimization process could be adopted to ensure the best measures to grid fitting.
The evaluation of KPIs with and without state-of-the-art technology devices or control functions makes available evidence of the quantitative impact, together with its sensitivity, of the selected measure. From a general point of view, a mixed set of indices (positive and negative values) could result from the comparison, thus denoting that a specific advanced provision may, at the same time, favor some operating aspects and worsen some others.
Consequently, a weighted average index should be defined, to definitively link an advanced measure to the performance index overall set. Finally, a ranking process can be proposed to provide a merit list of the different state-of-the-art advanced solutions on T&D system performance.
2.5. Results
Once the methodology has been defined, the successive step is calculating the KPIs for each family of T&D state-of-the-art technology in standardized model grids. This is a hard task and should be split into multiple parallel subtasks, faced by different and specialized research teams.
Regardless, an indication on the kind of impact (direct or indirect) provided by the single improving measure on T&D infrastructures can be identified without resorting to any calculations (see Table 2.2). An equivalent, but more explicit, presentation of the expected results of the study is hereafter proposed by means of “spider diagrams,” which are seen in Figures 2.7–2.12. These figures depict the effects of each introduced action on the seven targets described in Sections 2.2.1–2.2.7.
..................Content has been hidden....................
You can't read the all page of ebook, please click here login for view all page.