
11
Condition monitoring and fault diagnosis in wind energy systems
Abstract
Wind energy is one of the fastest growing sources of power production in the world today, and there is a constant need to reduce the costs of operating and maintaining them. Condition monitoring (CM) is used for the early detection of faults/failures of wind turbines. CM leads to minimizing the downtime and maximizing productivity. This chapter provides a review of the state of the art in CM for wind turbines, describing the different maintenance strategies and the main CM techniques.
Keywords
Condition monitoring; Wind turbines11.1. Introduction
Wind energy is a reliable and renewable energy source. This energy produces no emissions or waste (excluding manufacturing equipment and gear oil) and slows the depletion of fossil fuels, helping to prevent climate change. The environmental benefits will improve by increasing the share of energy produced from renewables. The availability of installed wind turbines (WTs) must be improved to enhance productivity and environmental benefits.
In 2011, worldwide wind energy capacity was 237 GW, more than doubling every 3 years; one forecast by the World Wing Energy Association (Gsänger & Pitteloud, 2012) is for world wind energy capacity to increase to at least 1000 GW by 2020. World wind energy capacity has been increasing year by year and is expected to continue. To make wind power competitive with other sources of energy, however, availability, reliability and the life of turbines all need to be improved. As the wind energy sector grows, business economics will demand increasingly careful management of costs. For a 20-year life, the operations and maintenance (O & M) costs of 750-kW turbines might account for about 25–30% of the overall energy generation costs (Milborrow, 2006) or 75–90% of the investment costs (Vachon, 2002).
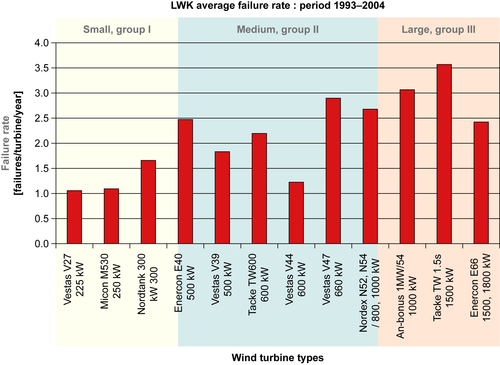
Furthermore, one projection in 2002 was that the O&M costs for 2-MW turbines (which, together with 2.5- and 3-MW turbines, have since become the workhorses of the wind power industry) ‘might be 12% less than an equivalent project of 750 kW machines’ (Walford, 2006). But new wind farms typically have higher capacity and comprise more machines. The turbine data in Figure 11.1 (Tavner, Spinato, van Bussel, & Koutoulakos, 2008) suggest that larger turbines fail more frequently and therefore require more maintenance. Reducing inspection and maintenance costs has thus become increasingly important as WT size and numbers have continued to increase.
Some WT components fail earlier than expected, and because unscheduled downtime can be costly (Anonymous, 2005), condition monitoring systems (CMSs) are used to ‘improve WT availability and reduce the O&M costs’ (Yang, Tavner, Crabtree, & Wilkinson, 2010). There is, however, a degree of uncertainty about the appropriateness of applying specific maintenance policies to WT components. This chapter discusses the applicability of various maintenance strategies to WT condition monitoring and reviews the available techniques described in the literature.
11.2. Wind turbines
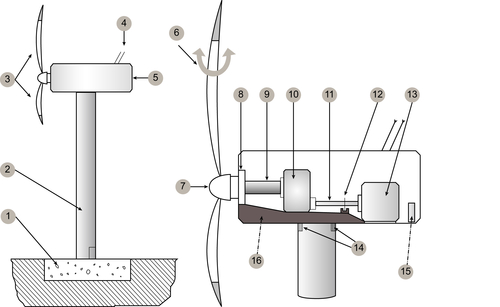
Most WT machines are three-blade units comprising the major components illustrated in Figure 11.2 (de Novaes Pires et al., 2010). Driven by the wind, the blades and rotor transmit energy via the main shaft through the gearbox to the generator; the main shaft is supported by the bearings and the gearbox is such that the generator speed is as near as possible to optimal for the generation of electricity. Alignment with the direction of the wind is controlled by a yaw system, and the housing (or ‘nacelle’) is mounted at the top of a tower.
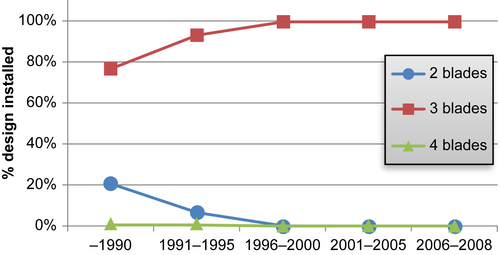
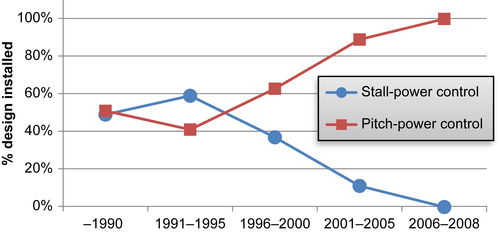
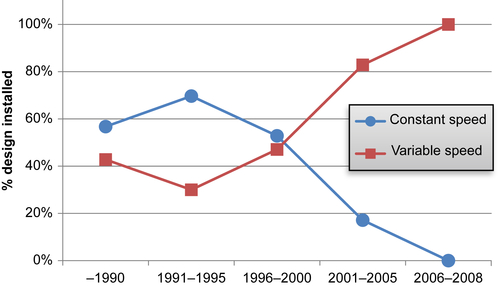
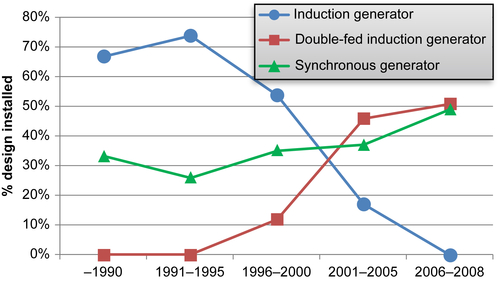
Different configurations of WTs with innovative technology for increasing power have been developed during the past few decades. The most common configuration is the horizontal axis WT with three blades, for which different combinations of rotational speed, power control, drive train configuration and generator can be used. Figures 11.3–11.6 show how the numbers and configurations of onshore installations have changed over time to increase the power generated in Germany (IWES, 2012), where WTs are now being installed with horizontal rotors and three blades rather than two (see Figure 11.3). Stall control with a constant speed was the main configuration earlier, but pitch control and variable speed configurations recently became the most-used configuration (see Figures 11.4 and 11.5). Figure 11.6 shows that double-fed induction generators and synchronous generators are used more than induction generators. The trend of installed WTs is three blades, power controlled by a pitch system and variable rotational speed configuration.
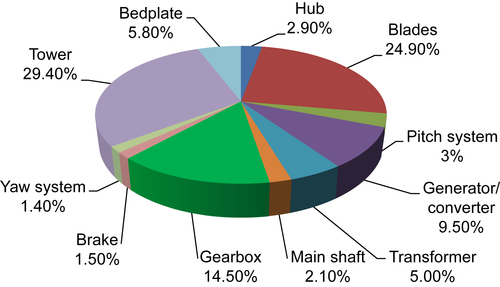
The costs of all these components in different types and sizes of WTs vary. For example, the costs of both converters and generators differ depending on the configuration, and some WTs do not have a gearbox at all. Figure 11.7 shows the component cost distribution for a typical 2-MW WT (PROTEST, 2009).
Some defects such as leaking and corrosion can be detected by visual inspection; discolouration of component surfaces may indicate slight temperature variations or deteriorating condition, and the sound coming from the bearings can also indicate physical condition (Igarashi & Hamada, 1982; Igarashi & Yabe, 1983). However, many of the most typical failures such as cracking and roughness on the surfaces of the blades, electric short circuits in the generator and overheating of the gearbox all demand a more sophisticated approach to maintenance.
11.3. Maintenance theory
Maintenance is required to make sure that the components continue to perform the functions for which they were designed. The basic objectives of maintenance activity are to deploy the minimum resources required to ensure that components properly perform their intended functions, ensure system reliability and recover from breakdowns (Knezevic, 1993).
11.3.1. Corrective, scheduled and condition-based maintenance
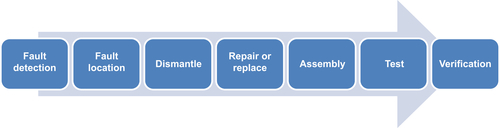
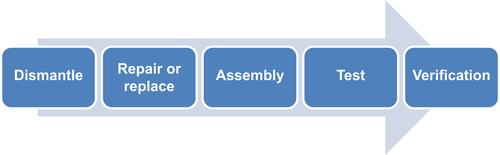
The main maintenance policies are corrective or preventive. Corrective maintenance (also known as unscheduled or failure-based maintenance) is carried out when turbines break down and when faults are detected or failures occur in any of the components. Immediate refurbishment or replacement of parts may be necessary and unscheduled downtime will occur (Ben-Daya & Duffuaa, 2009). Corrective maintenance is therefore the most expensive of strategies, and wind farm operators hope to resort to it as little as possible. The stages of corrective maintenance are shown in Figure 11.8.
The objective behind preventive maintenance is to either repair or replace components before they fail (Ben-Daya & Duffuaa, 2009), as shown in Figure 11.9. This has most straightforwardly been achieved by scheduled maintenance, also known as time-based (or planned) maintenance, which involves repair or replacement at regular time intervals as recommended by the supplier and regardless of condition. Scheduled maintenance activities in WTs include changing oil and filters and tightening and torquing bolts.
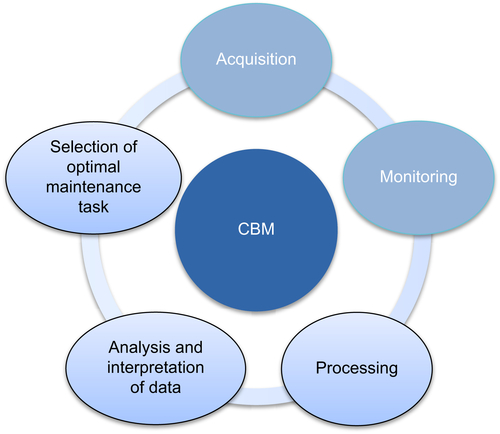
But reducing failures in this way comes at the cost of completing maintenance tasks more frequently than absolutely necessary and not exhausting the full life of the various components already in service. An alternative is to mitigate major component failure and system breakdown with condition-based maintenance (CBM), in which continuous monitoring and inspection techniques are used to detect incipient faults early and to determine any necessary maintenance tasks before failure (Pedregal, Garcia Marquez, & Roberts, 2009). This involves acquisition, monitoring, processing, analysis and interpretation of data and selection of optimal maintenance actions (Campbell & Jardine, 2001) and is achieved using CMS (Garcia Marquez, Pedregal, & Roberts, 2010) (see Figure 11.10). CBM has been shown to minimize the costs of maintenance, improve operational safety and reduce the quantity and severity of in-service system failures. Byon and Ding (2010) demonstrated the applicability of CBM to WTs, and McMillan and Ault (2008) used the Monte Carlo simulation to evaluate the cost effectiveness of CMB when applied to WTs. CBM is now the most widely used strategy in the WT industry.
11.3.2. Reliability-centred maintenance
In the WT industry, the state-of-the-art way of deciding on a maintenance strategy is reliability-centred maintenance (RCM), which has been formally defined as ‘a process used to determine what must be done to ensure that any physical asset continues to do whatever its users want it to do in its present operating context’ (Moubray, 1997). It involves maintaining system functions, identifying failure modes, prioritizing functions, identifying preventive maintenance requirements and selecting the most appropriate maintenance tasks (Smith, 1993), with the objective of effectively managing risk of system failure (Garcia Marquez & Pedregal, 2007). Operational and maintenance policies are optimized such that the overall maintenance is reduced (Ben-Daya & Duffuaa, 2009). RCM has been recognized and accepted in many industrial fields, such as steel plants (Deshpande & Modak, 2002a), railway networks (Garcia Marquez, Schmid, & Collado, 2003a, 2003b), ship maintenance and other industries (Deshpande & Modak, 2002b). RCM in the WT industry is addressed by Andrawus, Watson, Kishk, and Adam (2009).
11.4. Condition monitoring of WTs
On the basis that a ‘significant change is indicative of a developing failure’ (Wiggelinkhuizen et al., 2007), CMS comprises combinations of sensors and signal processing equipment that provide continuous indications of component (and hence WT) condition based on techniques including vibration analysis, acoustics, oil analysis, strain measurement and thermography (Knezevic, 1993). CMS are used in WTs to monitor the status of critical major operating components such as the blades, gearbox, generator, main bearings and tower. Monitoring may be online (hence providing instantaneous feedback of the condition) or offline (data are collected at regular time intervals using measurement systems that are not integrated with the equipment) (Scarf, 2007).
With good data acquisition and appropriate signal processing, faults can thus be detected while components are operational, and appropriate actions can be planned in time to prevent damage to or failure of components. Maintenance tasks can be planned and scheduled more efficiently, resulting in increased reliability, availability, maintainability and safety while reducing downtime, maintenance and operational costs (Yang et al., 2010). CM techniques thus are used throughout the industry (Cozens & Watson, 2003), and benefits are ‘especially shown for offshore wind farm(s)’ (Nilsson & Bertling, 2007) because of not only the high costs of O&M at sea but also the typically larger turbines. Several techniques are available, including vibration analysis, acoustic emission, ultrasonic testing, oil analysis, strain measurement, electrical effects, shock pulse method, process parameters, performance monitoring, radiographic inspection and thermography.
11.4.1. Vibration analysis
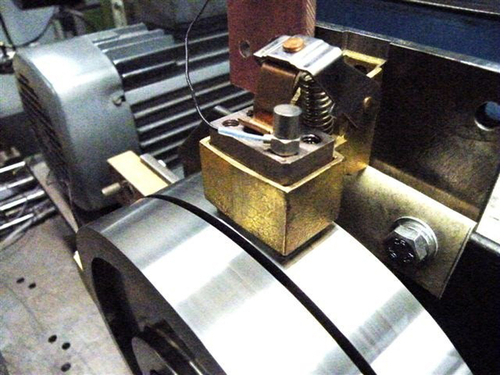
Vibration analysis continues to be ‘the most popular technology employed in WT, especially for rotating equipment’ (Hameed, Hong, Choa, Ahn, & Song, 2009) (see Figure 11.11). Different sensors are required for different frequencies: ‘position transducers are used for the low frequency range, velocity sensors in the middle frequency area, accelerometers in the high frequency range and spectral emitted energy sensors for very high frequencies’ (Verbruggen, 2003).
As for applications, vibration analysis is appropriate for monitoring the gearbox (Caselitz & Giebhardt, 2003), the bearings (Dyer & Stewart, 1978) and other selected WT elements; the sensor configuration in a nacelle is illustrated by Caselitz and Giebhardt (2003). Furthermore, Tandon and Nakra (1992a) presented a detailed review of different vibration and acoustic methods for CM of rolling bearings, such as vibration measurements in the time and frequency domains, sound measurements, the shock pulse method and the acoustic emission technique (Tandon & Choudhury, 1999).
11.4.2. Acoustic emission
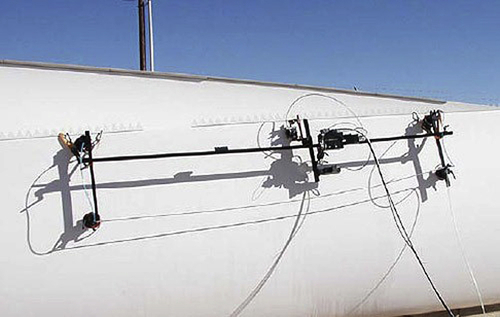
Rapid release of strain energy takes place and elastic waves are generated when the structure of a metal is altered, and this can be analysed by acoustic emissions (AEs). The primary sources of AEs in WTs are the generation and propagation of cracks (Yoshioka & Takeda, 1994), and the AE technique has been found to detect some faults earlier than other techniques such as vibration analysis (Tandon, Yadava, & Ramakrishna, 2007) (see Figure 11.12). The measurement and interpretation of AE parameters for fault detection in radially loaded ball bearings at different speed ranges has been demonstrated by Tandon and Nakra (1990). In addition, the application of AEs for the detection of bearing failures has been presented by Tan (1990). Acoustic monitoring has some similarities with vibration monitoring, but ‘vibration sensors are mounted on the component involved’ (Verbruggen, 2003), for example, to detect movement, acoustic sensors are attached with flexible glue with low attenuation and record sound directly. AE sensors have been used successfully in monitoring bearings and gearboxes and for detecting damage in blades of a WT (Wei & McCarty, 1993) (see Figure 11.13). Application of AEs is also possible in an in-service WT for a real-time rotating blade (Blanch & Dutton, 2003; Giebel, Oliver, Malcolm, & Kaj, 2006). Non-destructive testing techniques using acoustic waves to improve the safety of WT blades are presented by Jungert (2008) and techniques enabling the assessment of the damage criticality for blades of small WTs are based on AE data from publications by Anastassopoulos et al. (2002) and Joosse et al. (2002). The use of AEs for both CM of rotating WT components as well as blades is gradually growing.
11.4.3. Ultrasonic testing techniques
Ultrasonic testing (UT) techniques are used extensively by the wind energy industry for the structural evaluation of WT towers and blades (see Figure 11.14). UT is generally used for the detection and qualitative assessment of surface and subsurface structural defects (Knezevic, 1993; Deshpande & Modak, 2002a). Ultrasonic wave propagation characteristics allow the location and type of defect detected to be estimated, thus providing a reliable method of determining the material properties of the principal turbine components. Signal-processing algorithms including time frequency techniques and wavelet transforms can be used to extract more information (Tsai, Hsieh, & Huang, 2006). An ultrasound technique to visualize the inner structure of WT blades is presented by Juengert and Grosse (2009); the deployment of UT techniques for inspecting the whole multi-layered structure of the WT blade and finding defects such as delaminations and lack of glue is illustrated by Raišutis, Jasiūnienė, and Žukauskas (2008); and the ultrasonic air-coupled technique has been used to research internal defects in wind turbine blades (Jasiūnienė, Raišutis, Šliteris, Voleišis, & Jakas, 2008). Ultrasonically obtained images make it possible to recognize the geometry of defects and to estimate their approximate dimensions. Jasiuniene et al. (2009) adapted an air-coupled ultrasonic technique for better identification of the shape and size of defects in a WT blade. A review of other methods has been provided by Raišutis, Jasiūnienė, Šliteris, and Vladišauskas (2008).

11.4.4. Oil analysis
Whether for the ultimate purpose of guaranteeing oil quality or the condition of the various moving parts, ‘oil analysis is mostly executed off-line by taking samples’ (Hameed et al., 2009) despite online sensors for monitoring oil temperature, contamination and moisture (Yin, Wang, Yan, Xiao, & Wang, 2003) having (for years) been ‘available at an acceptable price level’ (Verbruggen, 2003) (see Figure 11.15). Little or no vibration may be evident while faults are developing, but analysis of the oil can provide early warnings; a case study of a WT gearbox is described by Leske and Kitaljevich (2006). In the ‘case of excessive filter pollution, oil contamination or change in component properties, characterization of the particulates can give an indication of excessive wear’ (Verbruggen, 2003). Such approaches are particularly effective in avoiding catastrophic failures and are cost-efficient (Toms, 1998). Online oil analysis is gradually becoming more important, with several ongoing pilot projects.
11.4.5. Strain measurement
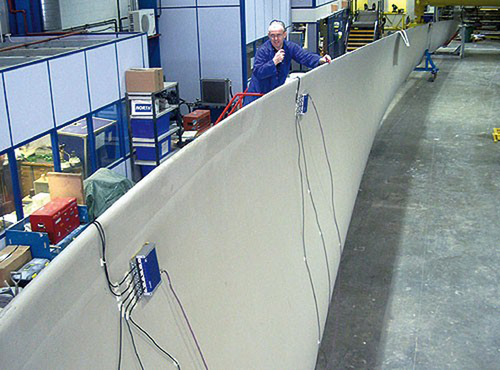
Strain measurement using strain gauges can be very useful for forecasting the lifetime of a component and protecting against high stress levels, especially in the blades (see Figure 11.16). An assessment of the interpretation of signals from strain gauge sensors installed on blades has been performed to adjust calibration practices and sensor selection (Morfiadakis, Papadopoulos, & Philippidis, 2000). Optical fibre sensors are still very expensive (Hameed et al., 2009), but cost-effective systems based on fibre optics are being developed. Giebel et al. (2006) illustrate how load monitoring can be performed using strain sensors in the rotor blades. Strain measurement can be expected to grow in importance as an input to CM.
11.4.6. Electrical effects
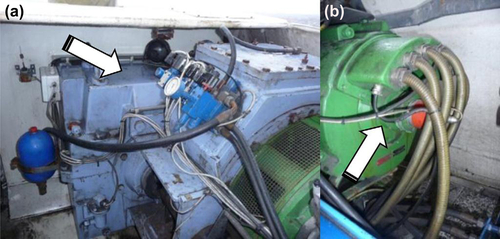
CM of electrical equipment such as motors, generators and accumulators is typically performed using voltage and current analysis (see Figure 11.17). Discharge measurements are used for medium- and high-voltage grids. A spectral analysis of the stator current (Schoen, Lin, Habetler, Schlag, & Farag, 1995) in the generator can be used for detecting isolation faults in the cabling without influencing WT operation.
Electrical resistance can also be used for the structural evaluation of certain WT components. Electrical resistance varies with stiffness, and abrupt changes can be used to detect cracks, delaminations and fatigue. Hence, the technique can be applied to in-service WTs. Seo and Lee (1999) demonstrate how the resistance principle is useful for detecting fatigue damage in particular. These techniques are currently confined to research-related activities, but there is significant potential for applying them successfully in the field.
11.4.7. Shock pulse method
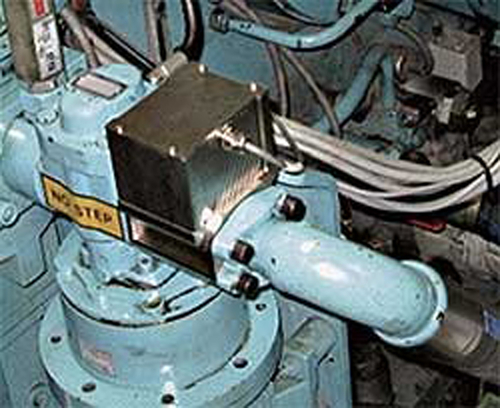
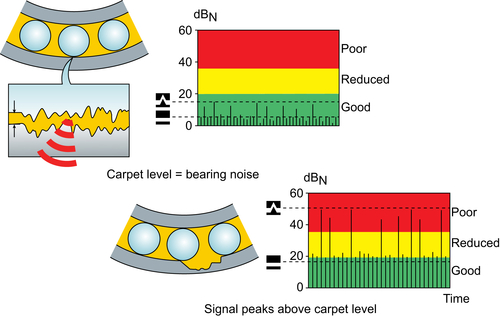
The shock pulse method has been used as a quantitative method for CM of bearings and works by detecting the mechanical shocks that are generated ‘when a ball or roller in a bearing comes in contact with a damaged area of raceway or with debris’ (Butler, 1973) (see Figure 11.18). Signals are picked up by transducers, and analysis (e.g. using a normalized shock value (Zhen, Zhengjia, Yanyang, & Xuefeng, 2008)) gives an indication of system condition (Tandon & Nakra, 1992b). Low-frequency signals of vibration collected in the nacelle and caused by other sources can easily be filtered electronically. A case study of the shock pulse method with a piezoelectric transducer is described by Morando (1988). The method is occasionally used by the industry to support vibration measurements.

11.4.8. Process parameters
Maintenance based on process parameters and the detection of signals exceeding predefined control limits is common practice in WTs; control systems are becoming increasingly sophisticated and diagnostic capabilities ever better. Transient and oscillatory stability were analysed with different wind scenarios for electricity generation process by Müller, Pöller, Basteck, Tilscher, and Pfister (2006). Zaher and McArthur (2007) provide an explanation of the use of signals and trending for fault detection based on parameter estimation.
11.4.9. Performance monitoring
The relationship between parameters such as power, wind speed, blade angle and rotor speed can also be used to assess WT condition and to detect faults early (Sorensen et al., 2002). Previous work includes power and voltage flicker analysis with variable wind speed and turbulence (Müller et al., 2006). ‘Similar to estimation of process parameter(s), more sophisticated methods, including trending, are not often used’ (Verbruggen, 2003). The torque and power generated with wind time series taken in the field as measured by an anemometer is considered by Dale, Dolan, and Lehn (2005).
11.4.10. Radiographic inspection
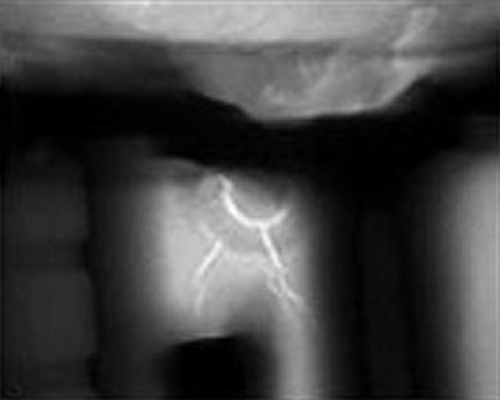
Radiographic imaging of critical structural turbine components using X-rays is only rarely used, although it does provide useful information regarding the structural condition of the component being inspected. Radiographic imaging depends ‘on the different level of absorption of X-ray photons as they pass through a material’. ‘To detect tight delaminations or cracks, having gaps less than 50 μm, the backscatter X-ray imaging technique’ (Raišutis, Jasiūnienė, Šliteris, et al., 2008) is used. X-ray imaging is useful to locate the internal defects of the WT, and the main advantage of X-ray inspection is its accuracy (Peters, 1998). A transportable radiographic system for WT blades has been recently demonstrated as ‘a solution to find defects and reduce the cost of inspection’ (Fantidis, Potolias, & Bandekas, 2011). Figure 11.19 shows the X-ray inspections of a blade.
11.4.11. Thermography
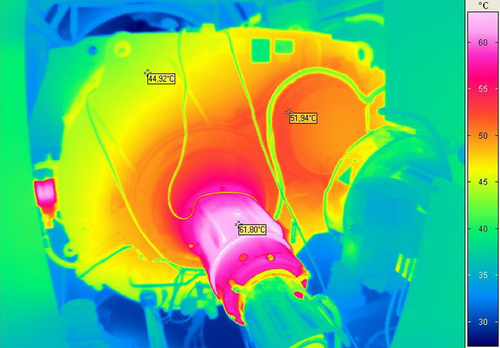
Thermography often is used for monitoring electronic and electric components and identifying failure (Smith, 1978). The technique is only applied off-line and often involves visual interpretation of hot spots that arise because of bad contact or a system fault. At present, the technique is not particularly well established for online CM, but cameras and diagnostic software that are suitable for online process monitoring are starting to become available. Infrared cameras have been used to visualize variations in blade surface temperature (Rumsey & Musial, 2001) and can ‘effectively indicate cracks as well as places threatened by damage’ (Doliński & Krawczuk, 2009). In the longer term, this might be applicable to WT generators and power electronics as well (see Figure 11.20).
Pulsed thermography can be used for the structural evaluation of blades, but because of the bulky equipment involved, this is not a standard methodology among WT operators. Early investigations of thermographic measurements of in-service blades using helicopters to deploy the infrared cameras has not yet been proven satisfactory and faces serious difficulties in implementation.
11.5. Sensory signals and signal processing methods
Regardless of the technique, the capability of a CMS relies on two basic elements: the number and type of sensors and the associated signal processing and simplification methods used to extract important information from the various signals. An electronic measurement system acquires the data and then processes and distributes them to an observer or other technical control system.
Data acquisition involves measuring the required variables (e.g. current, voltage, temperature, speed) and turning them into electronic signals. To do so effectively involves judicious choice and placement of the right type and number of sensors; conditioning (performing basic operations including amplification, filtering, linearization and, finally, modulation/demodulation) may be necessary to reduce the susceptibility of the signals to interference. Optimization techniques may then be used (Levitin, 2006) in the processing of the signals by a digital signal processor, involving not only the processing itself but also sorting and manipulation, as necessary. The signals are subsequently distributed to either a screen, computer, storage device or other system. There are several options, including Ethernet networks with transmission control/Internet protocol together with a wireless local area network, for a WT communicating with either a farm server or a supervisory command and data acquisition system. The latter is a particular computer-based system that allows local and remote control of the functions of a WT, gathering data from the wind farm and analysing them to report operational performance and hence ensure efficient operation. A supervisory command and data acquisition system uses various signal processing methods; following are the most relevant to WT:
• Statistical methods
• Trend analysis
• Filtering methods
• Time-domain analysis
• Cepstrum analysis
• Time synchronous averaging
• Fast-Fourier transform
• Amplitude de-modulation
• Order analysis
• Wavelet transforms
• Hidden Markov models
• Novel techniques.
11.6. Conclusions
The primary focus of this chapter about CM is on WT gearboxes and bearings, rotors and blades, generators and power electronics, rather than system-wide turbine diagnosis. An inventory of the available CM techniques has been provided. Different techniques can be used for each element of the WT, and mathematical methods are available for all of these techniques. The main obstacles facing the designers of CM systems for WTs clearly continue to be:
1. selection of the number and type of sensors;
2. selection of effective signal processing methods associated with the selected sensors; and
3. design of an effective fusion model (i.e. the combination of sensors and signal processing methods that improves performance).
List of acronyms
AE
Acoustic emission
CBM
Condition-based maintenance
CM
Condition monitoring
CMS
Condition monitoring system
O&M
Operation and maintenance
RCM
Reliability-centred maintenance
SPM
Shock pulse method
UT
Ultrasonic testing
WT
Wind turbine
..................Content has been hidden....................
You can't read the all page of ebook, please click here login for view all page.