
APPENDIX C
INTEGRATED PERFORMANCE REPORTING
A GUIDE FOR ASSESSING PERFORMANCE REPORTING TO SENIOR MANAGEMENT AND THE BOARD OF DIRECTORS
CO-SPONSORED BY THE
CANADIAN PERFORMANCE REPORTING INITIATIVE
OF THE
CANADIAN INSTITUTE OF CHARTERED ACCOUNTANTS
AND THE
CREDIT UNION INSTITUTE OF CANADA
1999
PREPARED BY
ROB MCLEAN
Matrix Links International Inc.
©MATRIXLINKS, CUIC, CICA, 1998/1999/2000/2001
- Background and overview
- A framework for evaluating integrated performance reporting practices and capabilities
- Financial performance reporting
- Operational performance reporting
- Integrated indicators reporting
- Comparative performance reporting
- Value creation reporting
- Integrated Performance Reporting Evaluation Matrix: A CPRI self-assessment guide
1. BACKGROUND AND OVERVIEW
Background
This Issue Paper provides senior management and members of Boards of Directors with an overview of key trends affecting performance reporting, and a means of assessing their organization's current practices and capabilities with respect to “integrated performance reporting.”
The focus of this paper is on “internal” performance reporting: that is, reporting to senior management and the board of directors. All other aspects of performance measurement and reporting, while important, are beyond the scope of this paper. Specifically, this paper does not address:
- External performance reporting or disclosure to investors or creditors
- Performance measurement of individuals or of organizational units
- In-depth performance measurement with respect to particular aspects of performance, except insofar as these are relevant to performance of the organization as a whole
- Performance reporting for entities other than business organizations
At the outset, it is useful to clarify what we mean by performance measurement, performance reporting, and integrated performance reporting.
Performance measurement refers to techniques for distinguishing various levels of a business organization's performance. Typically, these techniques focus on a particular aspect of performance, such as quality or customer satisfaction. The measures may be: qualitative or quantitative; absolute or relative; related to particular time periods; and so on.
Performance reporting refers to methods for summarizing and communicating information about performance to a particular audience—in this case, executive or senior management and the board of directors. We choose this audience because it is this group that is accountable for performance of the organization as a whole, and has the authority to make decisions concerning the quantity and scope of information it receives. For convenience, this group will henceforth be referred to in this paper as SMBD.
Integrated performance reporting refers to methods for synthesizing information so as to convey, in as efficient a manner as possible, the overall performance of the organization.
The point of departure for this paper is the observation that over the past 10 to 15 years, the quantity and range of information that is regularly provided to SMBD has increased dramatically.
At one time, financial statements were considered the main vehicle for providing SMBD with an overall picture of the organization's performance. In the late 1970s and 1980s, an increased emphasis on quality led many organizations to add quality issues to the board agenda. In the 1980s, many jurisdictions passed legislation which made SMBD members personally liable for the organization's compliance with environmental and health and safety regulations. Consequently, compliance reporting became an additional board responsibility.
In many companies today, SMBD receives reports on topics as diverse as:
- Financial performance
- Market share
- Quality
- Health and safety
- Environmental compliance
- Customer satisfaction
- Employee satisfaction
Many leading companies have added other performance “domains” to this list, such as:
- Intellectual capital management
- Risk management
- Shareholder value
- Environmental performance
This proliferation of reporting has led to a new challenge—that of synthesizing this wide range of information into a comprehensive or integrated view of the organization's overall performance.
Many SMBD members feel overwhelmed by the quantity and diversity of the information reported to them. They are looking for a way of grasping the organization's overall performance without having to read dozens of detailed reports. They want to know how various aspects of performance interrelate: for example, how does employee satisfaction affect customer satisfaction and vice-versa? They want to understand what weighting should be placed on different aspects of performance: that is, what are the most important determinants of overall performance. They also want to understand the organization's performance as perceived by shareholders and other key stakeholders.
Given this context, the cosponsors of this initiative believed that it would be useful to provide SMBD members with a basic framework for assessing their own organization's progress with respect to performance reporting. It should be recognized at the outset that performance measurement and reporting is a dynamic field, with many organizations working to expand the boundaries of current practice. Another objective of this paper is to identify areas for continuing research and development.
About the Cosponsors
The cosponsors' objectives in supporting this paper are complementary but distinct.
Until recently, the main focus of the Canadian Institute of Chartered Accountants was financial measurement and reporting. However, in its 1996 Vision project, the CICA recognized that its members would be held increasingly accountable for measuring and reporting not just on financial performance, but on other aspects of performance as well. This led to the launch of the Canadian Performance Reporting Initiative, which provides an opportunity for collaborative research and experimentation into various aspects of performance measurement and reporting, and has subsequently led to the formation of TVC International Inc., an entity created to enhance value creation measurement and reporting.
The Credit Union Institute of Canada is the national education association for Canada's $48 billion credit union system. One of CUIC's areas of responsibility is to provide support for training members of credit union boards of directors. This provides an opportunity to influence the expectations and capabilities of board members with respect to performance measurement and reporting. As a result of this interest, CUIC undertook to test the approaches described in this paper with leading credit unions across Canada.
Overview
This paper is organized as follows.
Section 1 provides a background and overview.
Section 2 describes an overall framework for exploring various approaches to Integrated Performance Reporting (IPR).
Sections 3 through 7 describe the various components of this IPR framework in greater detail.
Section 8 provides an assessment guide that shows how the IPR framework can be used to evaluate an organization's practices and capabilities.
Section 9 provides concluding comments and proposals for continuing research and development relating to integrated performance reporting.
2. A FRAMEWORK FOR EVALUATING INTEGRATED PERFORMANCE REPORTING PRACTICES AND CAPABILITIES
Performance reporting practices and capabilities can best be described by locating them within a continuum. Given the developments of the past two decades, we can differentiate among five major locations along this continuum:

Financial performance reporting is a basic building block for any attempt at integrated performance reporting. As discussed in Section 4, we have seen in recent decades the development of increasingly sophisticated techniques for analyzing financial performance, return on investment, and risk.
Operational performance reporting consists of the organization's practices and capabilities relating to nonfinancial information. Over the past two decades, techniques for measuring and reporting operational performance have become much more sophisticated. Most organizations have systems that track such things as quality and productivity. Section 5 points out that leading organizations today employ comprehensive performance management systems that track performance against targets covering all aspects of operations.
Integrated indicators reporting refers to the techniques for linking financial and nonfinancial performance measures. The best known approach is the “balanced scorecard” initially made famous by Kaplan and Norton. Developing a balanced scorecard is a logical step, based on today's practices, for an organization that wishes to integrate financial and nonfinancial information to get a comprehensive picture of its overall performance. This and other approaches for integrated indicators reporting are discussed further in Section 5.
The term comparative performance reporting is used to refer to various approaches for benchmarking the organization's performance against competitors and/or comparable organizations. These approaches are described in Section 6.
Value creation reporting refers to techniques that link performance to the creation of value. There has been considerable interest in recent years in measuring and reporting on the creation of shareholder value. As described in Section 7, the CICA is currently engaged in an exploration of a broader concept of value creation, referred to as Total Value Creation™ or TVC™.
3. FINANCIAL PERFORMANCE REPORTING
Financial reporting has many shortcomings, but its virtues become evident when one looks seriously at alternatives which don't share these same virtues.
The great strengths of financial reporting are as follows:
- Reliability: most of the numbers in a set of financial statements originate in a transaction with a third party. By contrast, many other performance measures are indicators-based rather than transaction-based.
- Comparability: the basic unit of measure for financial reporting is derived from currency—in Canada, the Canadian dollar. This facilitates comparisons among different companies.
- Defined standards: in Canada, the standards for financial reporting are defined by Generally Accepted Accounting Principles, which are codified in the Handbook of the Canadian Institute of Chartered Accountants, and in the United States, the equivalent standards are defined by the Financial Accounting Standards Board.
Financial reporting has been referred to as a “universal language,” since virtually anyone trained in business has the ability to read and understand a set of financial statements, at least at a basic level.
The main weaknesses of financial reporting are all related to the fact that it is designed to look backward at the past rather than forward to the future. There is an active ongoing debate about whether in the final analysis, everything that is relevant to assessing the performance of a business enterprise eventually affects cash flow. Even if one concedes this point, one must agree that by the time something has affected actual cash flows, it is too late to do anything about it.
One of the main complaints about the current accounting model is that it does not incorporate leading indicators of performance such as management of intellectual capital, which is increasingly important in a knowledge-based economy. Another concern is that financial reporting focuses on the firm as a discrete entity, and does not therefore reflect the complex interdependencies among business organizations that in many cases are critical determinants of business success.
Virtually all of the alternative approaches to integrated performance reporting are responses to these perceived deficiencies. Nevertheless, its strengths are such that financial reporting will continue to provide the “bedrock” on which all other approaches build.
Financial Reporting Practices
Within financial reporting, there is a broad spectrum of practice. In general, it is possible to distinguish among:
- Companies that provide SMBD with a fairly basic comparison of financial performance against budgets or forecasts
- Companies that provide SMBD with a more detailed analysis of financial return on investment generated in various business units
- Companies that incorporate comprehensive risk/return analysis into their reporting to SMBD
4. OPERATIONAL PERFORMANCE REPORTING
Modern companies have always used some form of measurement system to track operational performance, whether those operations involve resource extraction, manufacturing, retailing, or providing services. Over the past 20 years, the sophistication of these operational measurement systems has increased dramatically. This is due to several factors:
- As computing power became increasingly accessible and inexpensive with the development of PCs, it became possible to track performance at a more detailed level than would have been possible without this technology.
- Experience gained in the “quality movement” in the 1980s led to a greater understanding of how measurement can be used systematically to improve performance.
- The performance measurement and management techniques perfected in the quality movement have gradually been adapted and applied in a wide range of other performance domains, including:
- —productivity
- —customer satisfaction
- —health and safety
- —environmental performance
- —employee satisfaction
- —intellectual capital management
Within operational performance reporting, the spectrum of practices now includes:
- Organizations whose operational performance reporting practices are driven mainly by the requirements of suppliers. For example, many companies require their suppliers to acquire ISO 9000 or equivalent certification, which includes a requirement to report on various aspects of quality assurance.
- Organizations where SMBD has chosen to receive regular reports on a set of strategically significant operational performance indicators. This enables SMBD to monitor performance, and also signal to the organization the importance that is placed on the chosen areas of performance.
- Organizations that have implemented a comprehensive performance management system.
5. INTEGRATED INDICATORS REPORTING
Integrated indicators reporting refers to approaches for linking together financial and nonfinancial or operational indicators.
The Balanced Scorecard
The balanced scorecard is traditionally associated with Robert Kaplan and David Norton, who are recognized as its most active promoters. Over the past five years or so, it has emerged as the most widely practiced method for integrated performance reporting to SMBD.
The balanced scorecard was designed to overcome some of the limitations of traditional financial reporting, in that it focuses on:
- A limited number of performance measures which should be linked to an organization's strategy
- The present and the future, rather than the past
In its original incarnation, the balanced scorecard was intended to focus on performance from four key perspectives:
- The financial perspective
- The customer perspective
- Internal processes
- Innovation and improvement activities
In recent years, there has been a great deal of experimentation and development building on the initial concept. Some of the approaches that have emerged include:
- Using the balanced scorecard approach for performance management at various levels in the organization, in some cases all the way to individual performance.
- Using the balanced scorecard as part of a feedback loop in a system to promote strategic learning.
The Skandia Navigator
The Skandia Navigator is another approach that links financial and nonfinancial indicators. While initially introduced as a method of managing intellectual capital, the Skandia Navigator is in reality a potential approach for integrated indicators reporting.
Skandia and its first manager of intellectual capital, Lief Edvinsson, have become well known in recent years among those who are tracking developments in the field of intellectual capital. The Skandia Navigator was originally conceived as a tool for “navigating” through information relevant to assessing Skandia's performance in managing its intellectual capital. The Skandia Navigator is fully described in Chapter 4 of Leif Edvinsson's book, Intellectual Capital.
In simplified form, the Skandia Navigator focuses on five areas:
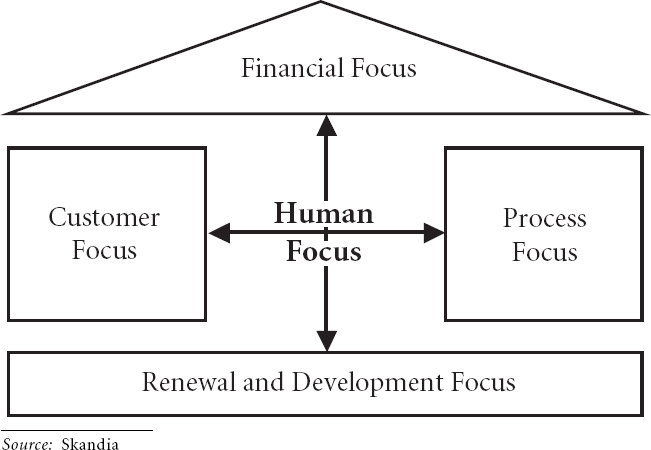
As Edvinsson explains, “These are the areas upon which an enterprise focuses its attention, and from that focus comes the value of the company's Intellectual Capital within its competitive environment.”
Skandia has developed a set of indicators to measure performance with respect to each of these areas of focus. Its 1994 supplementary report on Visualizing Intellectual Capital included 111 indicators as follows:
| Financial focus: | 20 measures |
| Customer focus: | 22 measures |
| Process focus: | 16 measures |
| Renewal and Development Focus: | 19 measures |
| Human Focus: | 13 measures |
Skandia continues to experiment with these measures, evaluating others, and adding them to its reporting structure as they prove useful.
Further information on Skandia's approach, and on measuring intellectual capital in general, is available in a separate CPRI publication entitled Intellectual Capital Management: Challenge and Response.
Identifying Causal Relationships
Among the more important developments in the last few years are initiatives by a number of companies to identify the causal relationships among various indicators of performance. Some of these initiatives were documented in a recent Conference Board of Canada report entitled Loyal Customers, Enthusiastic Employees and Corporate Performance. The report refers to work undertaken by the Royal Bank of Canada and Nortel, both of which have created statistical models to enable the company to predict the changes in customer satisfaction and financial performance that will occur as employee satisfaction increases or decreases.
The report notes that at Nortel, every percentage point change in employee satisfaction increases will yield a predictable change in customer satisfaction, which will in turn lead to predictable revenue and margin increases or decreases.
Spectrum of Practice
Within integrated indicators reporting, we can summarize the spectrum of practice as follows:
- Organizations that use a technique such as the balanced scorecard or Skandia Navigator to report integrated financial and non-financial performance information to SMBD.
- Organizations that use techniques such as the balanced scorecard or Skandia Navigator to manage performance at various levels within the organization.
- Organizations that are undertaking the research necessary to understand the causal linkages among specific financial and non-financial indicators of performance.
6. COMPARATIVE PERFORMANCE REPORTING
Many organizations recognize that measuring performance using only their internal information runs the risk of missing important quantum shifts in relative performance. Benchmarking emerged in the mid-1980s when it became evident that some companies were getting 100 percent and 200 percent performance improvements as a result of process redesign—far beyond the incremental changes that used to be the norm. Their competitors were able to respond to these nonincremental performance improvements only if they realized where they stood in relation to their rivals.
Benchmarking is now a commonly used term, but there are differences in the depth of analysis undertaken and/or reported to SMBD by various companies:
- Some companies focus their benchmarking analysis on market or customer data.
- Others use a benchmarking approach to get detailed intelligence on comparative performance of various functions or business units at an operational level.
- A third category extend their benchmarking focus to include comparative information about value creation. (See Section 7 below for more about value creation reporting.)
7. VALUE CREATION REPORTING
Value creation reporting is a very dynamic area, in which there have been important recent developments.
Reporting on Shareholder Value Creation
The topic of shareholder value has been thoroughly explored in two recent publications prepared for the CPRI by Julie Desjardins:
- Shareholder Value Measurement in Canada 1997 Survey, a report cosponsored by the CICA and the Financial Executives Institute Canada.
- The Measurement of Shareholder Value Creation, a commentary on various approaches.
Consequently, this section will be limited to a brief consideration of shareholder value reporting in the context of integrated performance reporting.
In general, current approaches to shareholder value reporting are derivatives of financial reporting, but are focused on the implications of financial results for the owners of the business. Various techniques are used to show whether the business is generating returns that exceed the cost of capital employed. To the extent that shareholder value approaches are based on the current financial accounting model, they share its shortcomings and strengths as previously described in Section 3.
Some approaches to shareholder value are promoted as performance management tools. So far, these approaches focus on influencing behavior to increase returns to shareholders.
In considering shareholder value reporting as a means for evaluating overall business performance, it is important to recognize the distinction between:
- Optimizing the returns available to shareholders given a specific fundamental underlying performance of the enterprise; and
- Improving the fundamental underlying performance of the enterprise, which increases the returns available to be optimized.
At present, many shareholder value management techniques address the former, not the latter. Nevertheless, reporting on shareholder value creation is, we believe, an essential task for most companies. In the context of integrated performance reporting, the key question is whether to focus solely on shareholders or to focus on value creation for other stakeholders as well.
Value Creation for Key Stakeholders
The CICA sponsored a study by John Waterhouse of the use of nonfinancial measures by Boards of Directors of Canadian corporations, entitled Strategic Performance Monitoring and Management: Using Non-Financial Measures to Improve Corporate Governance. The study included a survey of over 100 board members and CEOs, and case studies of the performance measurement approaches of five leading Canadian companies.
One of the important insights in the study is the importance of performance measurement with respect to all key stakeholders. Waterhouse argues that there is a crucial link between an organization's strategy and the stakeholders whose support is essential for successful implementation. Each of the major companies studied in depth—Nortel, the Bank of Montreal, Nova, Syncrude, and Noranda—identified a variety of stakeholders that were regarded as key to future success. The stakeholder groups most often identified by these companies include: shareholders, customers, employees, the community, and suppliers and business partners.
We conclude that in many companies, SMBD will be interested in understanding value creation from the perspective of all key stakeholders.
Total Value Creation™
Reflecting these insights, the CICA is currently experimenting with a model for internal reporting called Total Value Creation™ or TVC™.
TVC™ is based on the notion that just as market value normally exceeds book value in most companies, so does the total value created by an organization likely exceed the market value that is applicable to shareholders. The total value created by an organization includes value created for all key stakeholder groups, which normally include:
TVC™ integrates financial and nonfinancial measures that, in combination, provide insights into long-term value creation. Intellectual capital-related measures are integral to value creation and incorporated as appropriate into the measurement framework.
The TVC™ approach is flexible to allow companies to make their own decisions on the relative importance of key stakeholders and the measures which best reflect long-term value creation.
TVC™ addresses many of the limitations of other approaches to integrated performance reporting. For example, one of the features of the balanced scorecard approach is that this scorecard is intended to be customized to the needs of each individual organization. As a result, it is not possible to directly compare the balanced scorecards of different organizations. TVC™ includes both company-specific measures, and generic measures that facilitate making comparisons across organizations.
Similarly, the model for TVC™ combines information about strategic direction, operational performance, and value creation to provide an overall perspective of performance.
Further development of the TVC™ approach is taking place under the auspices of TVC International Inc. Further information is available from its web site at http://www.totalvaluecreation.com.
Spectrum of Practice
Within value creation reporting, we can summarize the spectrum of practice among organizations as follows:
- A large number are currently practicing some form of shareholder value reporting to SMBD.
- A somewhat smaller number are beginning to measure value creation from the perspective of other key stakeholders as well;
- The CICA, with the participation of other accounting institutes, is experimenting with an approach to measuring Total Value Creation™— which enables organizations to assess overall organizational performance from the perspective of all key stakeholders.
8. INTEGRATED PERFORMANCE REPORTING EVALUATION MATRIX: A CPRI SELF-ASSESSMENT GUIDE
The following is an outline of an evolving self-assessment guide which is intended to help organizations assess (1) their current positioning with respect to Integrated Performance Reporting, and (2) priorities for future development. This should be considered a “beta” version: feedback and reactions are encouraged.
This latest version of this guide can be accessed through the CPRI web site at www.cica.ca. Using the web-based guide, you can compare your organization's position with that of other organizations that have tested the self-assessment guide.
The Integrated Performance Reporting Self-Assessment Guide asks a series of questions related to each location along the IPR Continuum described in Sections 2 through 7 above. On the basis of these questions, you are invited to identify your current position within the continuum (positions 1 through 4 for each location along the continuum), and also identify your desired future position within the next 12 to 18 months.
Financial Performance Reporting
Positions:
- The organization provides financial statements to senior management and the Board of Directors on a regular basis.
- The organization regularly provides senior management and the Board of Directors with analysis of financial performance against forecasts/budgets.
- The organization regularly provides senior management and the board of directors with analysis of financial return on investment generated in all business units.
- The organization provides senior management and the board of directors with detailed comparative analysis of risks and returns for all business units.
What is your organization's current position with respect to Financial Performance Reporting?_____
If this position is not optimal for your organization, what position would you set as a target to move toward in the next 12–18 months?_____
Operational Performance Reporting
- Senior management and the board of directors rely mainly on financial reporting and do not receive regular reports on operational performance.
- The organization provides senior management and the board of directors with quality and/or customer satisfaction performance reporting in accordance with standards set by customers or standard-setting organizations such as ISO.
- The organization tracks a set of strategically significant operational performance indicators and reports these regularly to senior management and the board of directors.
- The organization has a comprehensive performance management system that sets targets and tracks performance for a full set of operational performance indicators, with appropriate monitoring by senior management and the board of directors
What is your organization's current position with respect to Operational Performance Reporting?_____
If this position is not optimal for your organization, what position would you set as a target to move toward in the next 12–18 months?_____
Integrated Indicators Reporting
Positions:
- The organization reports financial and/or operational performance to senior management and the board of directors, but does not have a mechanism for integrating financial and nonfinancial performance indicators.
- The organization prepares a regular report for senior management and the board of directors that integrates financial and nonfinancial indicators using approaches such as the balanced scorecard or the Skandia Navigator.
- The organization uses approaches such as the balanced scorecard or Skandia Navigator to set performance targets and monitor performance at all levels in the organization, in addition to reporting a high-level synthesis to senior management and the board of directors.
- The organization is actively engaged in research concerning the causal linkages among various financial and nonfinancial indicators of performance (e.g., linkages between employee satisfaction, customer satisfaction and revenue growth).
What is your organization's current position with respect to Integrated Indicators Reporting?_____
If this position is not optimal for your organization, what position would you set as a target to move toward in the next 12–18 months?_____
Comparative Performance Reporting
Positions:
- The organization tracks performance using primarily internally generated data.
- The organization reports comparative performance with respect to market share and customer satisfaction to senior management and the board of directors.
- The organization reports comparative performance with respect to productivity, efficiency, employee satisfaction, and other operational factors to senior management and the board of directors.
- The organization reports comparative performance with respect to value creation to senior management and the board of directors.
What is your organization's current position with respect to Comparative Performance Reporting?_____
If this position is not optimal for your organization, what position would you set as a target to move toward in the next 12–18 months?_____
Value Creation Reporting
- The organization does not report on value creation to senior management and the board of directors.
- The organization reports to senior management and the board of directors on value creation performance from the perspective of shareholders.
- The organization reports to senior management and the board of directors on value creation performance from the perspective of all key stakeholders.
- The organization is experimenting with leading-edge approaches to value creation performance reporting, such as the CICA's TVC™ approach.
What is your organization's current position with respect to Value Creation Reporting?_____
If this position is not optimal for your organization, what position would you set as a target to move toward in the next 12–18 months?______
Feedback about the Self-Assessment Guide
We are interested in any comments you have about this Self-Assessment Guide, including whether you found it useful, and what changes you would suggest to improve it. You may contact us through the CPRI web site at http://www.cica.ca, or the TVCI web site at http://www.totalvaluecreation.com.
Reprinted and reformatted with permission.