Imagine that you are developing an e-lesson on how to use a computer application such as how to input a formula into a spreadsheet. You've designed an animated demonstration showing how to activate the correct cell in the spreadsheet, type the formula in it, and press enter to see the result. You could explain the animated demonstration with either on-screen text or with audio narration. Which would be more efficient? What research do we have about the best ways to use visuals and audio for performance and for learning?
As we have discussed in Chapters 1 and 2, cognitive load refers to the amount of work imposed on working memory. One factor that determines cognitive load is the complexity of the content—what instructional scientists call element interactivity. Complex content or instructional goals require learners to devote working memory capacity to coordinate multiple elements. For example, when learning from instructional materials that teach a new computer application like Excel, you must coordinate several actions on the keyboard and mouse with the screen formats. One way to accelerate expertise when your instructional goals involve coordination and integration of several elements is to exploit two subcomponents of working memory: the auditory (phonetic) center and the visual center. This is the first of three chapters on how to best make use of auditory and visual modalities to extend the limited capacity of working memory.
WHAT THE RESEARCH SAYS ABOUT MULTITASKING
Recall in Chapter 2 that we discussed dual task experiments in which subjects are required to perform a primary task and a simultaneous secondary task. For example, subjects are asked to remember a list of random numbers read to them at the same time that they trace an image on a computer screen with a mouse. In dual task experiments in which each task requires a different mode, for example, an auditory task and a visual task, performance on the primary task is not depressed significantly. In contrast, when each task uses the same mode, for example, two auditory tasks, performance plummets. Even though we have two ears, our capacity for simultaneously assimilating multiple different auditory messages is quite limited.
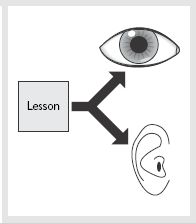
Based on these dual-task experiments, psychologists have inferred that working memory has two subcomponents: one for auditory information called the phonological loop and a separate one for visual information called the visual-spatial sketch pad (Baddeley, 1992). The phonological loop processes auditory, mainly verbal, information while the visual-spatial component processes diagrams and pictures. In Figure 3.1 we represent the phonological loop as a phonetic folder and the visual-spatial sketch pad as a visual folder in working memory.
In this chapter we will look at evidence-based ways to accelerate learning through judicious use of visual modalities including graphics and diagrams as well as auditory modalities such as narration. Our guidelines regarding diagrams apply to any instructional medium that can display visual information including computer screens, white boards in physical or virtual classrooms, and workbooks. Our guidelines regarding audio apply to any instructional medium that can deliver sound including instructors in classrooms, computers used for e-learning, and video. We begin with evidence-based guidelines for the best use of visuals followed by a discussion of how to maximize learning by describing visual information with audio narration.
Whether assembling your child's bicycle or clearing a jam in the copy machine, all of us have faced tasks requiring us to manipulate objects. Commonly we refer to working aids with instructions to help us complete these kinds of tasks. Under what circumstances do diagrams aid performance on such spatial tasks? Research shows that we perform spatial tasks faster when we refer to self-explanatory diagrams than when we refer to text descriptions. This guideline applies primarily to individuals who are new to the task and to tasks involving relatively complex spatial relationships.
WHAT THE RESEARCH SAYS ABOUT USING DIAGRAMS IN PERFORMANCE AIDS
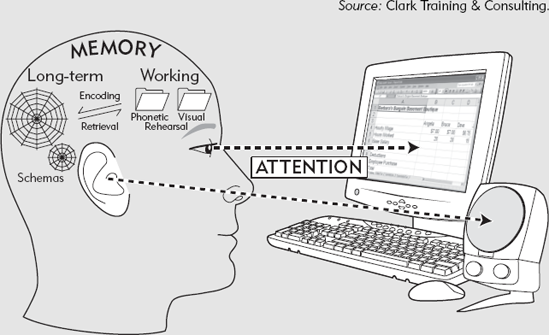
Marcus, Cooper, and Sweller (1996) asked sixth graders to perform one of three tasks requiring connection of resistors in three different configurations. As shown in Figure 3.2, these tasks range from quite simple (single series) to relatively complex (parallel) configurations. Half of the participants were provided performance aids with textual directions, while the other half used performance aids with diagrams. Therefore the experiment compared six conditions: three resistor connection patterns explained by text and three explained by diagrams. Figure 3.2 shows the text and diagram versions for both the simple single series connection and the more complex parallel connection. As you can see, either the diagram or the text was self-explanatory and could support completion of the task. The research team measured the time participants needed to complete the connections, as well as the participants' ratings of task difficulty. Figure 3.3 shows the time used to complete each of three connections.

As indicated in Figure 3.3, the diagrams helped participants complete the connections faster for simple and complex connections. However, notice that the time differences between text and diagram were most pronounced with the more complex parallel connections. In this experiment the participants using diagrams as a performance aid completed the more complex task over two and one-half times faster compared to those using text! When rating task difficulty, all groups rated the parallel connections as more difficult than the others. However, those using the text work aid rated the task more difficult than those using the diagram aid.
Recall from Chapter 1 that we can visually compare efficiencies of different instructional materials with an efficiency graph. Figure 3.4 shows a plot of the six different conditions on the efficiency graph. Note that the data point corresponding to the parallel connections explained by text is located in the low efficiency portion of the graph (extreme lower right hand corner). Note also that the efficiency ratings of all the aids with diagrams fall quite close together in the high efficiency portion of the graph (upper left quadrant). The efficiency graph clearly illustrates the superiority of performance aids that use diagrams and the inefficiency of aids that use text—especially for the more complex parallel connections.
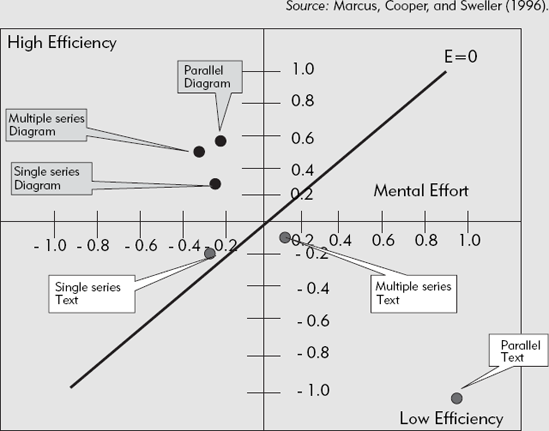
The research supporting Guideline 1 shows that performance aids using diagrams are more efficient than aids using text. In other words, diagrams can serve as psychological equalizers by allowing you to complete high complexity tasks in about the same amount of time as low complexity tasks with less mental effort.
What is it about diagrams that make them easier to process psychologically? All elements in a visual can be viewed simultaneously, unlike sentences, which must be processed sequentially one at a time. This leads to a lower visual search for tasks that involve coordination of multiple spatial elements. Greater psychological processing efficiency is the result. Likewise, diagrams provide more explicit representations of spatial tasks. A diagram requires fewer inferences because it shows spatial relationships that must be inferred from textual descriptions (Larkin & Simon, 1987). There is a closer correspondence between the diagram and the requirements of the task.
For Guideline 1, we reviewed evidence that working aids for assembly tasks that used diagrams resulted in faster performance than aids that used textual instructions. The focus in that section was performance, rather than learning. In other words, the goal was to accomplish a task while using the aid, rather than to store new knowledge or skills in memory. Guideline 2 rests on evidence that diagrams support learning of content involving spatial relationships better than text does.
WHAT THE RESEARCH SAYS ABOUT USING DIAGRAMS TO PROMOTE LEARNING
Carlson, Chandler, and Sweller (2003) constructed alternative chemistry lesson versions to teach students how to name carbon compounds by applying rules regarding the prefix and suffix of the compound. The rule for the prefix portion of the carbon compound is a simple association between a name and the number of carbon atoms in the molecule. For example, the prefix propan- is applied to any compound with three carbon atoms. To apply the prefix rule, you simply need to count the number of carbon atoms and associate it with the correct name. In contrast, the naming rule for the suffix portion of the compound is more complex. It requires the student to consider the relative positions and types of bonds of various atoms. Figure 3.5 shows an example of one suffix rule presented in text and by diagram. Therefore, learning and applying the prefix rule is likely to impose less cognitive load than learning to apply the suffix rule.
In this experiment, the students were provided lesson materials that used either text or diagrams to explain the prefix rule and the suffix rule. After studying the prefix and the suffix rules (using either text or diagrams), they rated the difficulty of the materials using a seven-point mental effort scale described in Chapter 1. The study period was followed by two test phases. The first test phase required participants to apply the prefix and suffix rule to twelve compounds not seen during the lesson. Participants could use their study materials as reference guides. Therefore this test phase was similar to the resistor connection study discussed in the previous section. In both situations the participants had access to a reference guide during task performance. The second test phase included six problems to be completed without reference to the instructional materials.

Test Phase 1, in which learners had access to their instructional materials, resulted in a pattern similar to the one described for the resistor connection task. Materials with diagrams resulted in better scores for both the simple rules (prefix names) and complex rules (suffix names) with the greatest advantage seen for the more complex suffix rules. Difficulty ratings were highest for the more complex suffix rule and for textual descriptions—most notably textual descriptions of the more complex suffix rule. The efficiency graph revealed a pattern similar to the one seen in the resistor study.
Test Phase 2 required a similar performance, naming of carbon compounds. However, on this test, learners were not allowed to reference their instructional materials. Therefore performance depended on learned ability to apply the two rules. Learners studying from materials with diagrams were able to apply the more complex suffix rule from memory more effectively than learners who studied from the text versions. However, for the simpler prefix rule, the text materials resulted in better achievement.
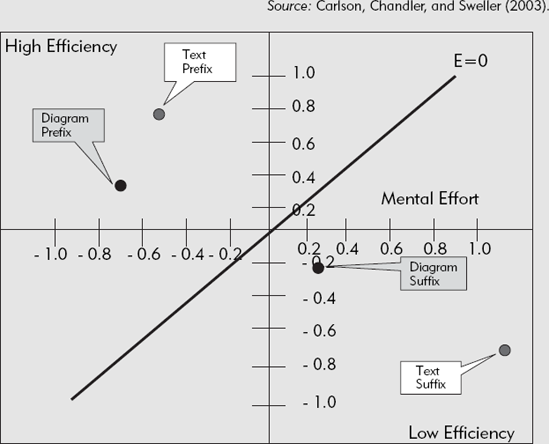
The efficiency graph shown in Figure 3.6 illustrates the low efficiency of the textual explanation of the more complex suffix rule at about the same graph location as the Phase 1 test results. Unlike Phase 1, the text explanation of the simpler prefix rule was more efficient than the diagram, although both text and diagram materials fell into the high efficiency upper left quadrant.
The authors conclude: "When instructional material requires learners to compare, relate, or simultaneously process multiple elements of information, then a diagrammatic representation of the materials is likely to enhance both the learning and understanding. Under conditions where instructional information can be processed serially and there are few if any relations between learning elements, then a text-based instructional format is likely to be as effective as a diagrammatic representation of the instructional material" (p. 638).
Taken together, the research supporting Guidelines 1 and 2 tells us that:
Diagrams enhance performance and learning efficiency.
Diagrams lead to greatest efficiency for spatial tasks of medium to high complexity.
For tasks of lower complexity, text representations are usually less expensive to produce and are as efficient for performance aids and instructional materials.
We recommend diagrams for both performance aids and for training materials in most situations.
So far we have seen that materials with diagrams alone can serve as better performance or learning aids than materials with text alone, especially with more complex content. Guideline 3 is concerned with problem-solving instructional goals that require a deep understanding of the content.
Workers are often faced with challenging situations that require some degree of problem solving. For example, when troubleshooting equipment or when writing employee performance appraisals, workers must generate somewhat novel solutions to each situation. In order to perform novel tasks effectively, the worker must be able to call on a schema of sufficient flexibility that it can be applied to a variety of situations. For example, in a troubleshooting task, to isolate the fault the worker must apply knowledge of how the system works, along with a systematic troubleshooting process. A number of studies have shown that adding a relevant visual to explanatory text helps learners build a deeper understanding of the content that will aid problem solving.
WHAT THE RESEARCH SAYS ABOUT ADDING DIAGRAMS FOR DEEPER UNDERSTANDING
Mayer (2001, 2002) has conducted a number of experiments using lessons that taught how something worked. For example, he has developed lessons designed to teach how a bicycle pump works, how lightning works, and how hydraulic brakes work. In these studies two lesson versions were tested. One consisted of text alone that explained how the system worked. The other included the same text but added an illustration of the process. In some lessons the illustrations were presented as a series of still visuals with arrows to indicate motion and in other lessons the diagrams were presented as animations. Figure 3.7 shows a portion of the text and the text-plus diagram versions from the bicycle pump lesson.

After a study period, learners were asked to apply this new knowledge to problems that were not discussed during the lesson. For example, learners were asked: "Suppose you push down and pull up the handle of a pump several times but no air comes out. What could have gone wrong? or What could be done to make a pump more effective, that is, to move air more rapidly?" To answer questions like these, learners must have built a cause-and-effect understanding of how the parts of the equipment work together to produce the desired result.
In six different experiments, learners who studied from lessons that added a diagram to the text created a median of 79 percent more solutions to questions like these than learners who studied from text alone. The median effect size was 1.37, which tells us that these results not only have statistical significance but are of high practical significance as well.
Not all visuals are equally effective. Different types of visuals are best suited for various instructional goals (Clark & Lyons, 2004). For example, a representational visual is a diagram that illustrates the appearance of an object. In contrast, explanatory visuals show relationships among the content elements. Some examples of explanatory visuals include organizational maps and bar charts to show qualitative and quantitative relationships and interpretive diagrams to illustrate abstract relationships and principles. When the learning goal requires a deep understanding, explanatory visuals that show relationships work best.
WHAT THE RESEARCH SAYS ABOUT EXPLANATORY VISUALS
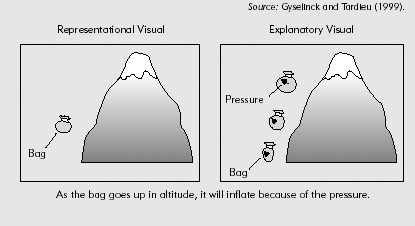
Gyselinck and Tardieu (1999) compared learning of principles governing gas pressure from text alone and from text accompanied by two different types of illustrations. The illustration shown on left side of Figure 3.8 is a representational visual. It does not show relationships. In contrast, the diagram on the right side of Figure 3.8 is an explanatory visual because it illustrates changes in air pressure in relation to altitude. An experimental comparison of the two diagrams with a text-only version found that learning was better from text illustrated with either of these diagrams than from text alone. However, the explanatory visuals such as the one shown on the right side were the most beneficial. The research team concluded: "The results reported indicate that pictures that highlight the relationships between the objects being described in the text are the most beneficial for readers, allowing them to build connections in order to draw inferences" (pp. 214–215).
As we discussed in Chapter 2, expertise is based on a rich bedrock of schemas resident in long-term memory. Schemas are formed when new information entering the eyes and ears is integrated into prior knowledge. This process is called encoding. According to a theory called dual encoding, learning can be deeper when participants have multiple opportunities to encode information.
When studying materials such as those on the right side of Figure 3.8, learners have the opportunity to encode information in two ways—through the words and through the visuals. Learners read the words and view the visual and then integrate those two sources of information into a coherent explanation. Learners have two opportunities to build a new schema: one from the text and one from the visual representation. However, the extra work imposed on working memory to integrate the two sources of information will increase the cognitive load of materials that include text and related visuals.
Since the added load results in deeper learning, this is a form of useful load—the kind we called germane. Since these types of lessons are more demanding of limited working memory capacity, we need to offset this germane load by finding ways to present the visuals and the words in the most cognitively efficient manner possible. We will look at ways to do this under Guideline 4 and in Chapters 4 and 5.
One way to reduce load imposed by the need to coordinate visuals and words is to divide the new incoming content among the two storage areas in working memory—the visual and the auditory. In our CD asynchronous demonstration lesson on creating Excel formulas, our default version uses audio narration to explain animated demonstrations. However, if the delivery platform does not have sound capability or some learners have hearing impairments, the audio can be turned off and is replaced by on-screen text. Research has indicated that the default version using audio narration results in more efficient learning. Cognitive efficiency gained when visuals are explained by auditory narration is referred to as the modality effect.
WHAT THE RESEARCH SAYS ABOUT THE MODALITY EFFECT
One of the most compelling findings from cognitive load theory research is the modality effect. A variety of experiments using different content, learners, and contexts have shown that learning is better when diagrams are explained with audio narration than when diagrams are explained with text. This guideline applies to situations in which the visual is not self-explanatory; in other words the visual requires an explanation to be understood. The superiority of explanations provided in narration has been shown for static diagrams as well as for animated visuals. As summarized in Table 1.1 in Chapter 1, the modality effect has been demonstrated in lessons designed to teach electrical troubleshooting to trade school apprentices, mechanical and scientific processes to college students, and botany concepts to seventh graders, among others. In the following paragraphs we summarize a few of these studies on the modality effect.
LEARNING PROCEDURES
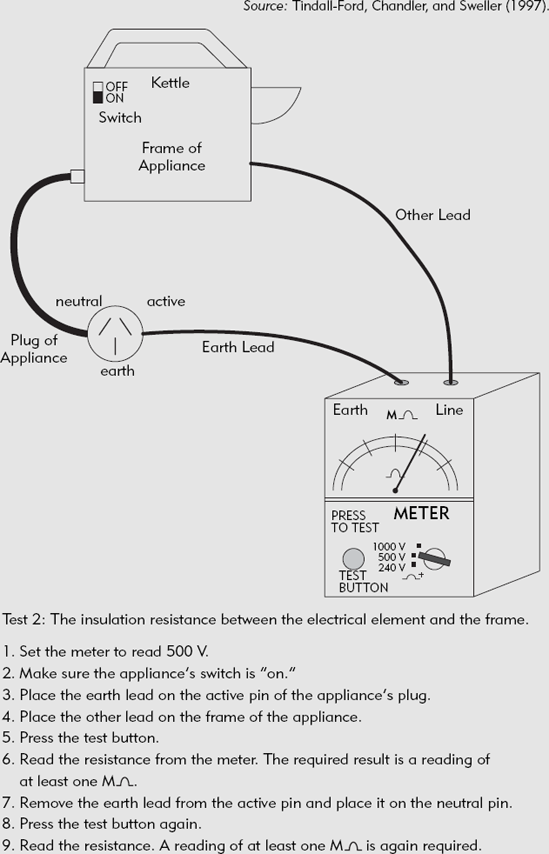
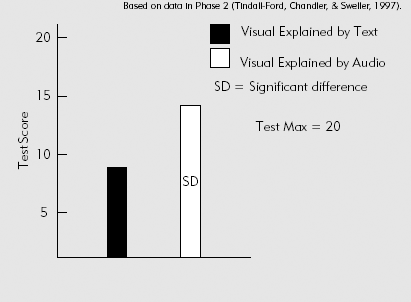
Tindall-Ford, Chandler, and Sweller (1997) trained trade apprentices how to conduct electrical tests of appliances using a volt meter. Figure 3.9 shows the visual-only version that explained the diagram with text. A second version (AV format) described this same visual using the same words presented in audio narration. Each lesson lasted about five minutes. The test included written problem-solving questions as well as a practical test that required the learners to perform the electrical test using actual equipment. One month later a second training session was conducted with the same learners using the same materials. Figure 3.10 shows the test results from the second training session for both groups. As you can see, the AV format resulted in higher scores.
LEARNING PROCESSES
Previously in this chapter we described experiments conducted by Mayer (2001, 2002) and his colleagues that focused on teaching college students how bicycle pumps, brakes, and lightning work. In a comparison of these lessons, in which words were presented in text, with lessons in which the same words were presented in audio narration, the narrated versions always resulted in better problem-solving learning. In four of four comparisons in which the visuals were animated, the audio versions resulted in better learning, with a median gain of 80 percent (Mayer, 2001). The median effect size from all of these experiments was 1.17, indicating that the results are not only statistically significant but have considerable practical significance as well.
LEARNING FROM AGENTS
Learning agents are on-screen characters presented in human, animal, or inanimate forms included to help learners achieve the instructional goal. For example, Figure 3.11 shows a learning agent from our CD Excel asynchronous e-lesson. Research has shown that learning is better in the presence of a learning agent (Clark & Mayer, 2003).

Given the benefits of learning agents, a number of recent experiments have examined how best to present agents to get the most learning value from them. Agents with different representations (human versus cartoon animal versus no image) that presented information and advice delivered either by text or by audio have been tested in lessons designed for college and seventh grade students. The image does not seem to be very important for learning. Moreno, Mayer, Spires, and Lester (2001) found their agent was equally effective in the form of a cartoon bug, a human video image, or no image at all! However, the modality of the agent's words makes a difference. Four studies that used different types of agents and focused on different instructional goals all found that learning is better when the agent communicates with the learner by audio rather than by text (Atkinson, 2002; Craig, Gholson, & Driscoll, 2002; Mayer, Dow, & Mayer, 2003; Moreno, Mayer, Spires, & Lester, 2001).
Taken together the research supporting the modality effect tells us that:
When a visual requires an explanation, learning is more efficient when the explanation is provided with audio narration rather than with text.
Both still and animated visuals benefit from an audio explanation.
Providing content in a complementary visual and auditory format reduces cognitive load by dividing content between the visual and auditory centers in working memory.
Of course not all situations lend themselves to using audio, and research shows that, even when it is available, it is not always beneficial. We recommend that you describe diagrams using audio narration rather than text when: (1) the delivery medium can support audio; (2) learners are not hearing impaired; (3) the instructional goal requires higher levels of mental work; (4) learners are novice to the skills being trained; (5) the diagram and/or text require an explanation; and (6) learners will not need reference to the content. In this section we discuss each of these conditions that will influence your decision to use audio narration.
Naturally your delivery medium has to be able to carry audio. Probably the two most common settings where audio can be used to describe visuals are multimedia training delivered on computer and instructor-led training either in actual or virtual classroom sessions. For example, in a synchronous web cast, learning is most effective when the instructor explains a relevant visual, as shown in our Excel virtual classroom lesson on our CD. If the instruction is delivered in books, you will most likely want to use other proven methods to effectively reduce load. We describe these in the next chapter.
Many organizations require that all training programs accommodate learners with visual and auditory impairments. For these situations, secondary text explanations should be available to replace the audio. As we will see in Chapter 5, you should not present the same explanations in both audio and text simultaneously. Identical text and audio are redundant and depress learning by overloading working memory with unnecessary information.
Audio narration will be most helpful when the cognitive load is highest. If the instructional goal and/or content are relatively simple, presenting words with text will be as effective for learning as presenting words with audio narration.
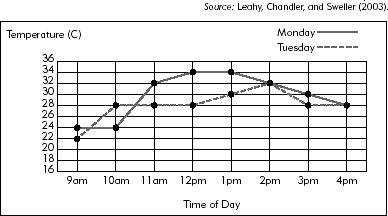
For example, consider the graph shown in Figure 3.12. Suppose you were asked to find the average rate of temperature change on Tuesday between 12 p.m. and 2 p.m.? How much mental effort would you need to answer this question compared to finding the times on Monday that had a zero average rate of change? In order to find a time that has a zero average rate of change for any given day, the student needs only to locate the correct day and look at the time periods for a flat line. In contrast, in order to find an average rate of temperature change for a given day and time the student must (1) locate the correct day, (2) locate the first time period, (3) identify the temperature for that time, (4) locate the second time period, and (5) identify the temperature for that time. Next the student must (6) subtract the lowest temperature from the highest temperature, (7) subtract the earlier time from the later time and divide the answer for Step 5 by the answer for Step 6. As you can see, the average rate of change question requires you to identify a number of different variables on the graph and to perform several mathematical operations. In contrast, the zero rate of change question only requires you to identify straight line segments and associate them with specific hours.
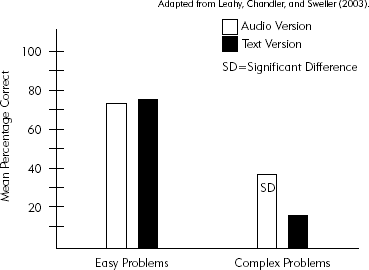
Leahy, Chandler, and Sweller (2003) compared a text explanation with an audio explanation of this graph on high and low complex questions such as the ones we just described. Figure 3.13 shows the results. As you can see, there are no real differences for the easy questions. As we would expect, the audio version helped learning on the more complex operations and had little effect on questions that did not require much mental effort.
A third factor to consider is the experience of the learner. Novices are most subject to cognitive overload. As learners gain experience, we would expect that the modality effect would taper off. In fact, Kalyuga, Chandler, and Sweller (2000) found that, as learners became more experienced as they progressed through a series of lessons, the effectiveness of the audio versions decreased. Once learners were quite experienced, the diagram alone was the most effective treatment. At this point, the experienced learners understood how to use the diagram and adding audio explanations was counterproductive. This is another demonstration of the expertise reversal effect that we describe in Chapter 10.
Naturally, audio narration will reduce load only in situations in which the language used in the instruction corresponds to the native language of the learner. In cases in which there is a mismatch in delivery and native language, a text version is likely to impose less load.
Note that the superiority of audio-visual instruction over visual-only instruction (the modality effect) is only obtainable when neither the diagram nor the text can be understood without the other. For example, in our Excel demonstration lessons on the accompanying CD, neither the visual animated demonstration nor the descriptive words is self-explanatory. Learners need both for understanding.
You will need to apply different guidelines when, for example, a text redescribes a diagram that is self-explanatory. In these situations the text and the diagram become redundant. We describe how to deal with this situation in Chapter 5.
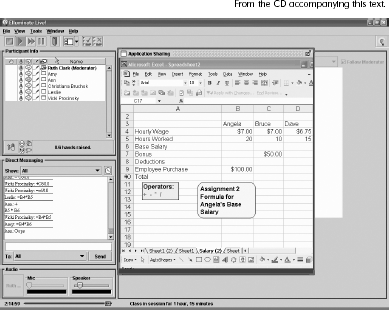
Although audio explanations of a relevant visual can reduce extraneous cognitive load, there are times that presenting information in audio might add extraneous load. Because audio is a transient modality, any content that must be referenced during the training should be available in a text format. Directions or data needed to complete an exercise are two common examples. For example, in our demonstration Excel virtual classroom lesson on the CD, the instructor writes the exercise directions on the spreadsheet for learners to reference, as shown in Figure 3.14.
All of the studies we've described on the modality effect so far focused on the use of audio to explain diagrams. However, the same benefits are realized when the material being explained is in the form of text. If you have written text that requires an explanation, it is better to provide the explanation in spoken rather than written form.
WHAT THE RESEARCH SAYS ABOUT USING AUDIO TO DESCRIBE TEXT
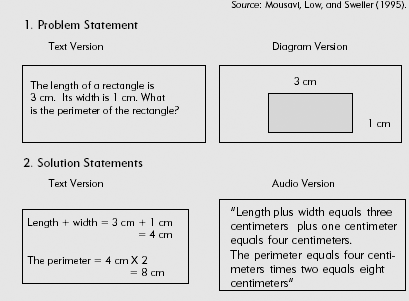
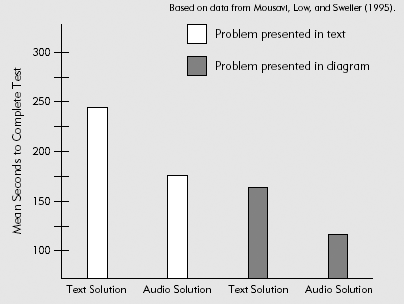
Mousavi, Low, and Sweller (1995) evaluated learning from worked examples of geometry problems. Figure 3.15 shows a geometry problem statement presented in text and in diagrams. The solution statements were presented in text or by an audio narration. The time required to solve test problems was compared among four groups: (1) text problem explained with text solution; (2) text problem explained with audio solution; (3) diagram problem explained with text solution; and (4) diagram problem explained with audio solution. Figure 3.16 shows the time each group needed to complete the test. Note in the two white bars that, when the problem was presented in text, the solution presented in audio was a bit more effective than when presented in text. The authors conclude: "The results of this experiment demonstrate the superiority of auditory solution statements over written solution statements regardless of whether problem information is presented in written or diagrammatic form" (p. 329).
There are solid research and psychological reasons for recommending that you:
Use diagrams in place of text to support performance of tasks involving spatial relationships when the diagram is self-explanatory
Add explanatory diagrams to words when the goal is to help learners build a deep understanding
Explain visual content—either diagrams or text with words presented in audio narration when the tasks or content is complex
All of the above recommendations apply to workers or learners who are novice to the task or content as well as to tasks that are more complex.
Chapter 3: Using Visuals and Audio Narration. John describes the best techniques for display and explanation of spatial information using graphics and audio.
The asynchronous lesson illustrates effective use of visuals, audio, and text.
Note the use of:
Relevant visuals to illustrate procedures.
Audio narration as the default modality to explain visuals.
Text on screens that require learner responses.
The synchronous lesson Virtual Classroom Example illustrates effective use of visuals, audio, and text, including instructor explanations of relevant visuals on the white board and use of text to display directions.
In this chapter we have summarized basic guidelines for use of visuals and explanations of visuals using audio narration in ways that best manage cognitive load. In the next two chapters we will expand on these guidelines. In some cases your delivery medium will not have audio capability and you will have to rely on text to explain visuals. In Chapter 4 we describe ways to manage cognitive load by focusing learner attention to relevant portions of visual or text displays and to avoid split attention by integrating text close to the visuals. In Chapter 5 we review research recommending a minimal display of content needed for understanding. The guidelines in Chapter 5 mitigate against describing a visual with both text and audio.