
While it's easy to get started with the launching of nodes and the forming of Elasticsearch clusters, the real challenge comes when the indexing and searching requests increase and your server encounters real pressure. In this section, we will discuss when and how to scale your Elasticsearch clusters.
Elasticsearch is very good at giving you hints in advance when it starts getting overloaded. The problems can arise in many areas such as slow searches, disk space utilizations, JVM issues, memory pressure, or high CPU utilizations. In any case, scaling should be done before your servers crash.
For timely scaling, the best thing to do is keep a close eye on the monitoring of the metrics provided by Elasticsearch for all resource utilizations. Your biggest friend would be Marvel. It provides very granular statistics of your clusters. However, in case you can't opt for Marvel due to any reason, you can use a combination of three approaches: use monitoring plugins such as Bigdesk, HQ; keep watching the logs and use the monitoring REST APIs to get a clear idea of what is causing the problem; and taking decisions about when to scale.
The following are the most important metrics that you need to continuously watch out for in Elasticsearch.
The performance of Elasticsearch is highly dependent on the type of server on which it has been installed. There are many reasons for spikes in high CPU utilizations, such as higher indexing speed that causes a lot of segment merges in the background or higher garbage collection activities. Look at the following images that have been taken after running the htop command on a Ubuntu system:
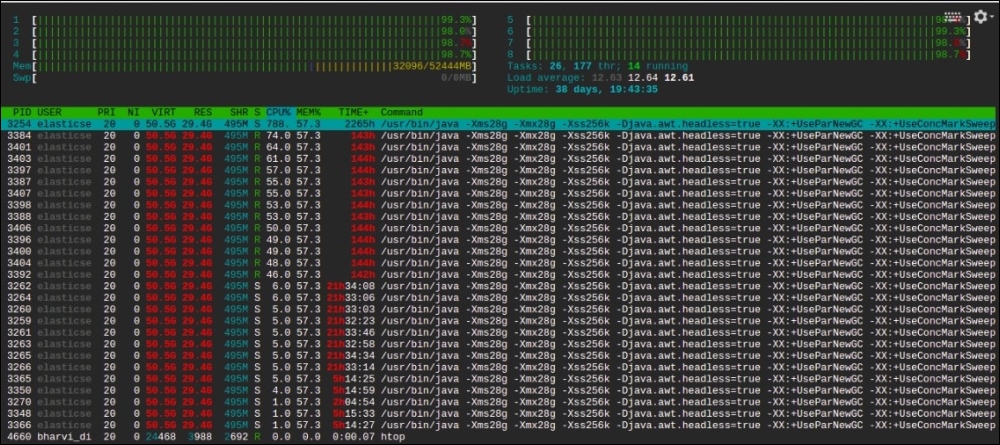
The preceding screenshot is from my server, which has eight CPU cores and 32 GB of RAM (16 GB dedicated to Elasticsearch). You can see Elasticsearch is using almost 800% of CPU because of a higher indexing rate of almost 3,000 documents per second (with a size of 20 KB per document). We were required to increase the indexing rate, but we were not able to because there was no room in the CPU.
The only solution in this scenario was to scale, either vertically (increasing CPU of this server) or horizontally (adding more nodes to allocate some of the shards on a new node), to distribute the load.
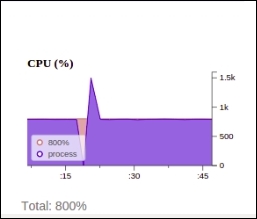
The same CPU utilization can be viewed with the help of the Bigdesk plugin:
Elasticsearch is a memory extensive process. It runs in JVM and requires a lot of memory holding objects while performing aggregation, sorting, and caching different kinds of data, such as field cache and filter cache, to give you faster search executions. Many people are worried when they see that Elasticsearch is using almost all the memory of the server. However, this is not always correct. In Elasticsearch, it is good if your server is utilizing all the memory. The actual thing to look for is whether there is any free buffer or cached memory available.
When there is too much memory pressure on an Elasticsearch node, it starts giving warnings in the logs of that particular node, similar to the following one:
[2015-11-25 18:13:53,166][WARN ][monitor.jvm] [es-data-1] [gc][ParNew][1135087][11248] duration [2.6m], collections [1]/[2.7m], total [2.6m]/[6.8m], memory [2.4gb]->[2.3gb]/[3.8gb], all_pools {[Code Cache] [13.7mb]->[13.7mb]/[48mb]}{[Par Eden Space] [109.6mb]->[15.4mb]/[1gb]}{[Par Survivor Space] [136.5mb]->[0b]/[136.5mb]}{[CMS Old Gen] [2.1gb]->[2.3gb]/[2.6gb]}{[CMS Perm Gen] [35.1mb]->[34.9mb]/[82mb]}
If you start getting these kinds of warnings in your logs, its time to add more resources.
If you are working on applications having high writes such as logging and real-time data indexing, you need very high disk I/Ops. Elasticsearch provides options for tuning store-level throttling for segment merging; however, spinning media disks cannot cope with heavy writes. It is best to use SSD for write heavy applications. In our applications, we have seen an almost 10x performance boost after opting for SSD.
Look at the following lines of log, which have been taken from the master node of the cluster:
[2015-11-21 15:22:52,656][INFO ][cluster.routing.allocation.decider] [es-master-1] low disk watermark [15%] exceeded on [ujhOO-MzR22bJHPUGLtyQA][es-data-1] free: 36.6gb[14.8%], replicas will not be assigned to this node
It clearly says that one of the data nodes has less than 15% of disk space available and new shards won't be assigned to this node anymore. This can even be worse if 90% of the disk is full. In this case, your shards will be automatically assigned to other nodes, and if the other nodes also have the same disk space, your cluster will go into hang mode.
However, you can increase the thresholds for low and high watermarks in the following way:
curl -XPUT client_node_ip:9200/_cluster/settings -d '{
    "transient" : {

        "cluster.routing.allocation.disk.watermark.low" : "90%",
        "cluster.routing.allocation.disk.watermark.high" : "10gb"
    }
}'
As you can see, these parameters take values in the form of percentage as well as gigabytes or megabytes. However, if this is still not enough, you need to add more nodes to move the shards or increase the disk space.
Distributed systems such as Elasticsearch, Cassandra, or Mongodb are built for higher scalability. However, it is very important to consider one thing: how you scale your clusters. Scaling can be done either vertically or horizontally. Vertical scaling is the one in which you keep adding more resources to existing machines, whereas in horizontal scaling, you dynamically add more nodes to the cluster. Elasticsearch is built for horizontal scaling. You keep adding more nodes to your cluster, and it can automatically balance the shards/load on the new nodes.
To add new nodes to Elasticsearch, simply launch a new server with Elasticsearch installed on it and similar configuration (cluster name and discovery parameters). It will automatically connect to the existing cluster, if it is able to connect with your master nodes.
There are still some scenarios in which it will be required to go for vertical scaling, such as cost optimizations. In this case, you need to stop the node and increase the resources on it. However, you need to have enough nodes to keep the cluster operational, such as having two client nodes or two data nodes and three master nodes.