4 Thermopower Wave-Based Micro-and Nanoscale Energy Sources
CONTENTS
4.2 Theory of Thin Film-Based Thermopower Wave Oscillations
4.2.1.1 X-Ray Diffraction (XRD)
4.2.1.2 Scanning Electron Microscopy (SEM), Atomic Force Microscopy (AFM), and Raman Spectroscopy
4.3.1 Multiwalled Carbon Nanotube (MWNT)-Based Thermopower Systems
4.4 Bi2Te3- and Sb2Te3-Based Thermopower Wave Systems
4.4.1 Experimental Details of Thin Film Thermopower Wave Systems
4.4.1.2 Fabrication of the Bi2Te3 and Sb2Te3 Films
4.4.1.3 Characterization of Films
4.4.3 Comparison of Sb2Te3- and Bi2Te3-Based Thermopower Devices
4.4.3.1 Thermopower Devices Based on Al2O3 Substrate
4.4.3.2 Thermopower Devices Based on Terracotta Substrate
4.5 ZnO-Based Thermopower Wave Sources
4.1 Introduction
There is a growing need to reduce the size of current energy sources in order to realize fully the potential of many fascinating systems, such as “smart dust,” integrated microelectromechanical (MEMS) systems and biomedical electronic devices such as cardiac microdefibrillators [1]. Large-scale deployment of applications such as hybrid cars with high efficiency has also been hampered for a long time due to lack of power sources that match their dimensional scale and deliver the required power densities [2].
Miniaturization of energy sources is also highly desirable for applications such as heat engines, where a large power surge is required solely at the start. However, heavy and bulky batteries have to be accommodated for the entire journey, thereby reducing the efficiency of the entire system.
Batteries have been the most commonly used power source for a long time. Although there have been recent advances reported in fabricating three-dimensional Li ion micro-and nanobatteries, their specific power and energy densities are still quite low (0.3 kW/ kg and 0.4 kWh/ kg, respectively) [2]. Additionally, a reduction in size makes them lose their energy discharge capabilities. The reduction in size is also hampered by disruption of ionic flow near the electrodes and by electrical shorts that impede their performance [3]. Consequently, batteries continue to be heavy and bulky, thereby limiting their use for micro-and nanoscale applications.
Fuel cells are another commonly used energy generation technology. However, they require large volumes and expensive electronics while exhibiting very low specific power ( power-to-mass) ratios [4,5].
Energy can also be stored and released at high rates using supercapacitors. Although such systems exhibit a high specific power, they are rendered inefficient due to their high self-discharge rate. They have to be charged at regular intervals in order to maintain the stored energy [6].
In addition to the aforementioned limitations, all such energy sources are capable of generating only DC output; however, for practical applications, an AC output is highly desirable. Thus, none of the currently used energy generation technologies have so far enabled reliable miniaturized energy sources with a high specific power.
Consequently, novel techniques for energy generation need to be explored in order to achieve true miniaturization of power sources. New thermopower, wave-based energy sources are particularly attractive as they are capable of generating higher specific power ( power-to-mass ratio) compared to conventional sources such as batteries and fuel cells, especially at smaller dimensions.
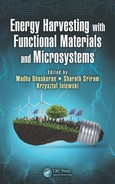
Choi et al. first demonstrated that chemically driven carbon nanotube-guided thermopower waves are capable of producing specific powers as large as 7 kW/ kg [7]. In their work, aligned arrays of multiwalled carbon nanotubes coated with a several-nanometers-thick layer of cyclotrimethylene-trinitramine (TNA) were developed (Figure 4.1). In such devices, the energy is stored in the chemical bonds of the fuel (TNA, in this case), which enables them to maintain their energy for a long period of time. A laser or microheater was used at one end to initiate an exothermic decomposition reaction of TNA. The thermally conductive MWNT conduit accelerated the reaction along their length, creating a unidirectional thermal wave up to 10,000 times faster than the reaction wave in bulk. This thermal wave also entrains electronic carriers, resulting in output power, and, hence, these waves were coined as “thermopower waves.”
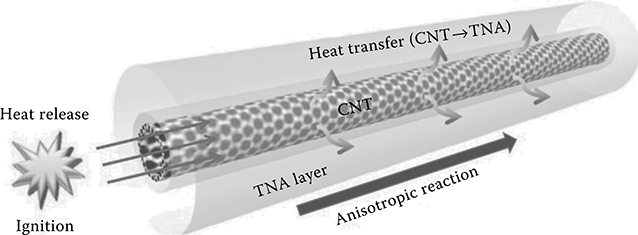
FIGURE 4.1 Schematic of the thermopower wave system showing the reaction propagation mechanism across a TNA-coated carbon nanotube.
The main limitation of the MWNT-based thermopower systems is the low voltage generated, which is generally in the range of 30–50 mV with a maximum reported voltage of 200 mV for masses in the range of just a few milligrams. Additionally, the amplitude of the oscillations is also low (20–30 mV generally). The reason for this limitation is that MWNTs exhibit a relatively low Seebeck coefficient (80 μV/ K). In order to increase the output voltage and thus improve the performance of such systems, materials such as bismuth telluride (Bi2Te3), antimony telluride (Sb2Te3), and transition metal oxides such as zinc oxide (ZnO) with large respective absolute Seebeck coefficient values of 287, 243, and 367 μV/ K can potentially replace MWNTs as the core thermoelectric materials for thermopower energy generation systems. Another desirable property of the core thermoelectric material is a high electrical conductivity, which results in a larger power output.
This chapter provides an overview of the thermopower wave technology. Such systems, based on MWNTs and thin films of thermoelectric materials such as Bi2Te3, Sb2Te3, and ZnO, will be discussed. These materials exhibit a high Seebeck coefficient and high electrical conductivities. A high thermal conductivity is also required for sustaining the propagation of the thermopower waves. As the thermal conductivity of Bi2Te3 and Sb2Te3 materials is low, thermally conductive alumina (Al2O3) is used as the substrate in order to compensate for this deficiency. Additionally, in order to show the influence of the substrate thermal conductivity on the behavior of the thermopower waves, a substrate with low thermal conductivity (terracotta) is also used.
It has been shown that Bi2Te3-and Sb2Te3-based thermopower systems are capable of generating oscillatory voltages up to 400 mV with complementary polarities and specific power as high as 1 kW/ kg. ZnO-based thermopower devices generated the highest voltage and oscillations of the order of 500 mV and a specific power of up to 0.5 kW/ kg [2,8,9].
4.2 Theory of Thin Film-Based Thermopower Wave Oscillations
In order to simplify the theoretical analysis, we assumed the system to be a one-dimensional space model and transformed it to a nondimensional system in order to predict the occurrence of oscillatory combustion linked to the heat losses in the system. The theoretical approach is of particular importance as it can be used to predict the behavior of the system, the velocity of the wave front, and the possibility of oscillations.
The thermoelectric film is thin when compared to the Al2O3 substrate. Therefore, the majority of the heat is exchanged with the thermally conductive Al2O3 substrate. As a result, we consider one-dimensional approximations for both the fuel/ Al2O3 system and the fuel/ terracotta system in our calculations. It means that fuel exchanges heat either with a thermally conductive substrate of alumina with k = 20 W/ m.K or the much less thermally conductive substrate terracotta with k = 1 W/ m.K. Assuming the solid fuel combustion to be exothermic and oxygen supplied in excess and governed by Arrhenius kinetics with volumetric heat loss, the dimensional equations for the conservation of heat and mass are [10]
where
T and w denote the temperature and the concentration of the fuel, respectively
x and t describe space and time variables
ρ is the density of the fuel (kg/ m3)
cp is the specific heat of the fuel (J/ kg.K)
k is the thermal conductivity of the fuel (J/ s.m.K)
Q is the heat of reaction (J/ kg)
A is the pre-exponential rate constant (/s)
E is the activation energy (J/ mol)
R is the universal gas constant (8.314 J/ mol.K)
Heat is transferred from the fuel layer to the Bi2Te3/substrate layer and to the surroundings. As we are using a one-dimensional averaged model, the term
models both the transfer to Bi2Te3/substrate and the Newtonian cooling to the ambient surrounding, which is at a temperature Ta [10]. In the latter case, S/ V is the surface-area-to-volume ratio of the fuel (/m) and h is the heat transfer coefficient from the fuel to the quiescent surroundings (J/ s.m2.K) [10], which is typically quite small. The term ρQAwe–E/RT in Equation (4.1) accounts for the exponential decomposition reaction of the fuel.
As a first step toward analyzing the combustion, we applied the model presented by Mercer, Weber, and Sidhu [10]. Defining the nondimensional temperature to be u = RT/E and rescaling space and time coordinates by
respectively, leads to the nondimensional version of the governing equations:
where we define
a parameter related to the properties of the fuel, and the nondimensional volumetric heat transfer,
Depending on the value of system parameters, we can predict thermopower waves with or without oscillations [11,12]. For simplification in our theoretical analysis, we start with a one-dimensional space model and transform it to a nondimensional system to predict the occurrence of oscillatory combustion linked to the heat losses.
The determination of all the necessary parameter values is the key to being able to apply the model to a real system. The solution of the model presented by Mercer et al. [10] assumes that the ambient temperature is absolute zero (ua = 0). Ambient temperatures are typically very small compared to the reaction temperature and, hence, this assumption has little effect on the overall behavior of the solutions to this model.
For the fuel (which is a combination of nitrocellulose and sodium azide in our case), the value parameters are as follows: S/ V = 1/240/μm, ρ = 1600 kg/ m3, cp = 1596 J/ kg.K, Q = 4.75 × 10⁶ J/ kg, E = 1.26 × 10⁵ J/ mol, A = 105 s−1, and h = 2 × 10⁻³ J/ s.m2.K. In all cases, the β value is 5.09 for the nitrocellulose fuel layer. Two extreme conditions are now considered for the substrate:
A highly thermally conductive substrate (k = 20 W/ m.K): This system is similar to the schematic shown in Figure 4.1. The fuel is deposited on Al2O3 (with a thin layer of Bi2Te3 in between) with a thermal conductivity of approximately 20 W.m−1.K−1. This results in the nondimensional heat loss parameter ℓ = 1.7 × 10⁻⁴. The oscillation period is directly related to β and ℓ. For β = 5.09, the critical heat loss value for the onset of oscillations is smaller than ℓ/β = 0.000035 (see reference 2 for details). Furthermore, the model predicts that there would be a time of approximately 0.05 s between peaks in the oscillating signal. In this case an oscillatory behavior is predicted; hence, the slower and faster propagation speeds are strongly dependent on very fine-scale details of the solution to the model; the slower one is of the order of 0.002 m/ s and the faster one of an order of magnitude higher. Due to the oscillatory behavior, a two-dimensional model will better account for the various paths of heat conduction to provide accurate velocity predictions in this case.
A substrate with a low thermal conductivity (k = 1 W/ m.K): The fuel is deposited on terracotta (with a thin layer of Bi2Te3 in between) with a thermal conductivity of approximately 1 W/ m.K. The change in thermal conductivity of the substrate affects the heat loss parameter. In the case of terracotta, the heat loss parameter is obtained as ℓ = 2 × 10⁻⁵ and it is predicted that oscillations will cease to exist [2].
Next, we apply the model proposed by McIntosh, Weber, and Mercer [13] to predict the reaction propagation velocity for the fuel/ terracotta system. The equation is as follows:
where c is the wave speed in meters per second. Using Equation (4.3), the average reaction propagation velocity is estimated to be approximately 0.007 m/ s. The velocity measured for experiments on the fuel/ terracotta system is about 0.009 m/ s, so the simulation agrees reasonably well with the measurements. Hence, the mathematical model is able to predict the oscillation period and the reaction propagation velocity reasonably well.
4.2.1 Characterization
4.2.1.1 X-Ray Diffraction (XRD)
XRD was carried out using a Bruker D8 DISCOVER microdiffractometer fitted with a GADDS (general area detector diffraction system). Data were collected at room temperature using CuK α-radiation (α = 1.54178 Å) with a potential of 40 kV and a current of 20 mA and filtered with a graphite monochromator in the parallel mode (175 mm collimator with 0.5 mm pinholes).
4.2.1.2 Scanning Electron Microscopy (SEM), Atomic Force Microscopy (AFM), And Raman Spectroscopy
Scanning electron microscopy (SEM) was conducted using the FEI Nova Nano SEM to investigate the structure of the ZnO films. Atomic force microscopy (AFM) was carried out on the ZnO films using an AFM-Bruker D3100 in order to assess their surface roughness. The Raman spectra were recorded with a system incorporating an Ocean Optics QE 6500 spectrometer and a 532 nm, 40 mW laser as the excitation source.
4.3 Thermopower Wave Systems
4.3.1 Multiwalled Carbon Nanotube (MWNT)-Based Thermopower Systems
Choi et al. first demonstrated the phenomenon of thermopower waves using MWNTs as a core thermoelectric material [14]. In their system, they synthesized MWNTs encased in a 7 nm thick annular coating of cyclotrimethylene trinitramine (TNA) (Figure 4.1).
The free-standing films exhibit high porosity (95%–99%) and are able to incorporate approximately 3–45 times TNA by mass. Subsequently, a NaN3/water solution was applied and allowed to dry in ambient conditions.
The reaction was initiated at one end of the TNA-MWNTs using laser irradiation or a high-voltage electrical discharge. This resulted in a self-propagating reaction wave specifically along the direction of the nanotube orientation (Figure 4.1) at velocities more than four orders of magnitude larger than the bulk combustion rate of TNA.
Such a directional thermal wave evolves a corresponding thermopower wave in the same direction, resulting in a high specific power electrical pulse with a constant polarity. The measurement setup is shown in Figure 4.2(a). Ignition via laser irradiation at one end of the MWNT results in a voltage oscillation peak of the same duration as the corresponding reaction wave.
This demonstrates that the thermopower wave is uniquely distinct from conventional, static thermopower in the fact that single polarity pulses are observed over the duration of the reaction for the high-velocity waves. A moving thermal gradient across a conductor results in static regions of maximum, minimum, and zero voltages as a result of the Seebeck effect. However, the voltage signal obtained as a result of thermopower wave propagation is oscillatory in nature while exhibiting a constant polarity (Figure 4.2b); this suggests that the wave traverses the system faster than the cooling time of its posterior region, resulting in highly directional energy pulses [7,15].
As discussed earlier, the main limitation of MWNT-based thermopower wave systems was the low voltage and very limited oscillatory behavior. Therefore, in order to make such systems practically useful, the output from the thermopower wave-based devices needs to be enhanced. This prompted an investigation of other thermoelectric materials, such as Bi2Te3, Sb2Te3, and ZnO that exhibited high Seebeck coefficients and electrical conductivity. Thermopower devices based on thin films of the previously mentioned thermoelectric materials have been developed and the results are discussed later in this chapter.
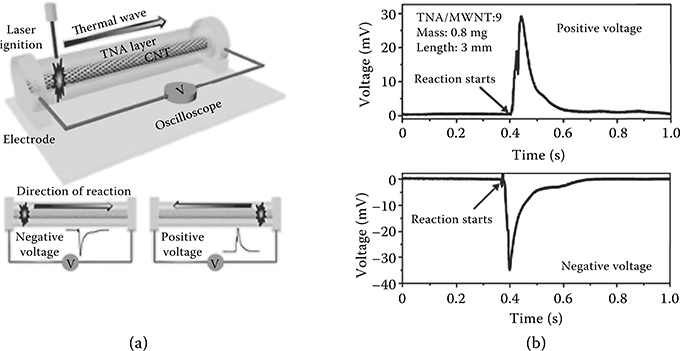
FIGURE 4.2 (a) Schematic of the experimental setup for a MWNT-based thermopower wave system and (b) output voltage profiles with opposite polarities obtained from MWNT-based thermopower wave system.
4.4 BI2TE3-and SB2TE3-Based Thermopower Wave Systems
In this section, thermopower wave generation is demonstrated in the thin film geometry by coupling exothermic chemical reaction of nitrocellulose to Bi2Te3 and Sb2Te3 films supported by a highly thermally conductive alumina (Al2O3) substrate in comparison to a much less thermally conductive terracotta (baked natural polysilicate) substrate (Figure 4.3) [2].
These devices produced a high specific power of the order of 1 kW/ kg and generated voltages of the order of 100–150 mV with large oscillation amplitudes in the range of 50–140 mV. The generated voltage and the amplitude of oscillations for Bi2Te3-based devices were significantly larger than for MWNT-based thermopower devices.
Subsequently, Sb2Te3 was used as the complementary thermoelectric material. Sb2Te3 is a p-type semiconductor, while Bi2Te3 is an n-type [16,17]. Such a contrast ensures that the voltage output from these thermopower wave sources with identical characteristics (one based on Bi2Te3 and the other based on Sb2Te3) produce both positive and negative polarities. The combination of these two can result in an alternating signal, which is required for practical applications. Similarly to Bi2Te3, Al2O3 and terracotta are used as the substrates. They are chosen due to their contrasting thermal conductivities, which will help observe the effect of thermal properties of the system on the thermopower wave propagation. A detailed comparison of Sb2Te3-and Bi2Te3-based thermopower wave devices is presented later in this section.
FIGURE 4.3 Difference in thermal conduction rates of Al2O3 and terracotta.
4.4.1 Experimental Details of Thin Film Thermopower Wave Systems
4.4.1.1 Preparation of Fuel
The fuel used for the exothermic reaction was a combination of nitrocellulose (C6H8(NO2)2O5) and sodium azide (NaN3). Nitrocellulose was used due to its large enthalpy of reaction (4.75 × 10⁶ J/ kg). It was prepared by dissolving millipore nitro-cellulose membranes (N8645, Sigma Aldrich) in acetonitrile (15 g/ L). Using a pipette, this solution was then dropcast on the Bi2Te3 and Sb2Te3 films and left to dry. The acetonitrile evaporated, leaving an adhesive and solid nitrocellulose layer deposited on top of the thermoelectric materials. NaN3 was used to serve as a primary igniter due to its low activation energy (40 kJ mol−1 for NaN3, compared to 110-150 kJ mol−1 for nitrocellulose) [18,19]. NaN3 (14314, Alfa Aesar) in aqueous solution (50 mg mL-1) was then added on top of the nitrocellulose layer, using a pipette. The total thickness of the fuel layer was ~240 μm [2,8].
4.4.1.2 Fabrication of the bi2te3 and sb2te3 Films
The Sb2Te3 and Bi2Te3 films were deposited on thermally conductive Al2O3 substrates and non thermal-conducting terracotta substrates using RF (radio frequency) magnetron sputtering, under identical deposition conditions. High purity (99%) Sb2Te3, Bi2Te3, and ZnO targets (Vin Karola Instruments) were used for sputtering. The chamber was pumped down to a pressure of 2 × 10⁻⁵ torr before starting the sputtering process.
Al2O3 substrates with linear dimensions of 12–15 mm (L) × 4–6 mm (W) × 100 μm (H) were utilized after being cleaned using acetone, isopropyl alcohol, and distilled water. The substrates were held at a constant temperature of 100°C throughout the sputtering process, in which a power of 100 W and an argon atmosphere with 10 mtorr process pressure were used. Sputtering time of 90 min resulted in a 6-μm-thick Sb2Te3 and 5 μm Bi2Te3 films, respectively. Electrical contacts between the copper tape electrodes and the thermoelectric layer were made using adhesive conductive silver paste (42469, Alfa Aesar). The resistance between the electrodes for Sb2Te3 films and Bi2Te3 films ranged from 6 to 12 Ω and 2 to 10 Ω, respectively [8,20].
4.4.1.3 Characterization of Films
Figure 4.4(a) and 4.4(b) shows scanning electron micrographs of Sb2Te3 and Bi2Te3 films, respectively. The images clearly highlight the difference between the structures of the two films with Bi2Te3 exhibiting a more irregular structure compared to Sb2Te3. This confirms the polycrystalline nature of Bi2Te3. The SEM images also show that Bi2Te3 films are more porous than Sb2Te3 when they are deposited on Al2O3 substrates under identical conditions.
A surface profilometer (Ambios Technology XP-2) was used to investigate the morphology of the Sb2Te3 and Bi2Te3 surfaces and that of the substrate further. The average surface roughness of Sb2Te3 and Bi2Te3 was determined to be 0.4 and 0.7 μm, respectively. This indicates that the Bi2Te3 films are more porous, thereby confirming the earlier observation made from the micrograph in Figure 4.4(b). A greater porosity enables more fuel to be placed on the surface of the films. Additionally, a higher porosity is also important to facilitate increased thermal conduction between the fuel and thermoelectric films [2], resulting in a more sustained reaction propagation.
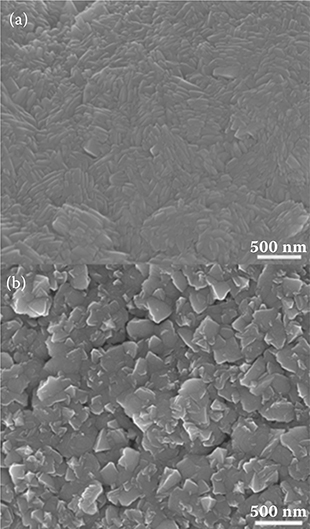
FIGURE 4.4 The SEM images of (a) Sb2Te3 film on Al2O3; (b) Bi2Te3 film on Al2O3.
X-ray diffraction measurements were carried out on the Sb2Te3 and Bi2Te3 samples in order to assess the crystallinity of the films. The XRD pattern for Sb2Te3 (Figure 4.5a [1]) shows three well defined peaks, which indicate its crystalline structure. In the case of Bi2Te3, the XRD pattern reveals a more polycrystalline structure (Figure 4.5b [1]) [21]. On addition of nitrocellulose, different effects on the XRD patterns of Sb2Te3 and Bi2Te3 are observed (Figure 4.5a and b [2]). For Bi2Te3, the peak at 18.1 2θ (006) plane for rhombohedral Bi2Te3 (ICDD no. 1-75-0921) is no longer exhibited in the samples with nitrocellulose (Figure 4.5b [1]). Possibly, incoherent scattering and adsorption effects may be responsible for the disappearance of this peak. It is also probable that the nitrocellulose coating on both the Sb2Te3 and Bi2Te3 samples effectively masks the surface, thus inhibiting the penetration of x-rays to and collection of scattering data from this particular peak. This effect is particularly acute for the relatively low-intensity (006) Bi2Te3 peak, which lies in the same region as the principal XRD reflections for nitrocellulose (ICDD no. 03-0114) [2]. Sb2Te3, on the other hand, does not show any significant diffraction peaks in this region.
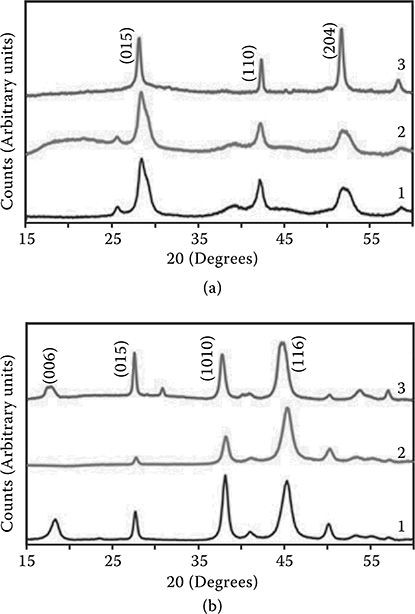
FIGURE 4.5 (a) The XRD pattern of Sb2Te3 (1) before thermopower wave propagation, (2) after adding nitrocellulose, and (3) after thermopower wave propagation. (b) The XRD pattern of Bi2Te3 (1) before thermopower wave propagation, (2) after adding nitrocellulose, and (3) after thermopower wave propagation.
Thus, the masking effect caused by the nitrocellulose layer only results in a general decrease in diffraction intensity across its entire diffraction pattern. The XRD patterns of the samples following consumption of the nitrocellulose are also shown (Figure 4.5a and b [3]) and will be discussed later [8].
4.4.2 Results and Discussion
Figure 4.6 shows the schematic of the setup used for the thermopower experiments. Ignition takes place at one end of this system and the reaction self-propagates to the other end. A custom-made blow torch with a localized flame tip is used to initiate the reaction. Samples with low mass of nitrocellulose or NaN3 (masses below 15 mg/75 mm2) showed no sustained wave front propagation in any direction. Several samples using different masses of the fuels were prepared and tested.
For both Bi2Te3 and Sb2Te3 systems, identical masses were used to ensure statistical comparison. Ignition at one end of the system, shown in Figure 4.6, results in an accelerated self-propagating reaction wave that drives a simultaneous wave of free carriers. This wave of carriers results in a flow of current and voltage across the devices. The voltage signal exhibited a positive polarity for waves initiating at the positive electrode for p-type Sb2Te3 and the opposite polarity for the n-type Bi2Te3. The duration of the output signal corresponds to the reaction time, thus enabling us to calculate the reaction propagation velocity. Even in oscillatory mode, the thermo-power waves always exhibit a constant polarity during the reaction, depending on the direction of wave front propagation. This suggests that the wave passes through the system faster than the cooling time of its posterior region [2,22].

FIGURE 4.6 Schematic of a thin film thermopower wave generation system.
4.4.3 Comparison of SB2TE3-and BI2TE3-Based Thermopower Devices
4.4.3.1 Thermopower Devices Based on AL2O3 Substrate
The thermal conductivity of Al2O3 is much higher than that of Bi2Te3 and Sb2Te3. Both Bi2Te3 and Sb2Te3 films are comparatively thin (<10 μm compared to the ~100 μm thick Al2O3 substrate). Thus, we can assume that the Al2O3 substrate will dominate the thermal conduction process [2].
Figure 4.7(a, b) shows typical voltage measurements across the fuel/ Sb2Te3/Al2O3 and the fuel/ Bi2Te3/Al2O3 systems, respectively. The voltage profiles of Figure 4.7(a, b) can be divided into an initial reaction phase followed by a cooling down phase. The reaction phase consists of a rising voltage and continues until all the combustion fuel is consumed.
This is followed by a region of exponential decay [15]. The voltage generated depends on the sample mass, especially the amount of fuel used (which is a combination of nitrocellulose and sodium azide). Sb2Te3-based devices generated voltages as large as 200 mV with oscillations in the range of 10–40 mV. On the other hand, Bi2Te3 devices generated voltages as large as 140 mV with larger oscillations generally within the range of 40–140 mV. Figure 4.7(a, b) also shows the difference in the oscillation amplitudes of the Sb2Te3 and Bi2Te3 devices. The reason for the difference in oscillatory behavior can be attributed to the larger thermal conductivity of Sb2Te3 (2.5 times that of Bi2Te3). Oscillation amplitude difference between the two devices corresponds to the difference in thermal conductivities of the two materials. A larger effective thermal conductivity means that the reaction will propagate faster, potentially affecting the oscillation amplitude.
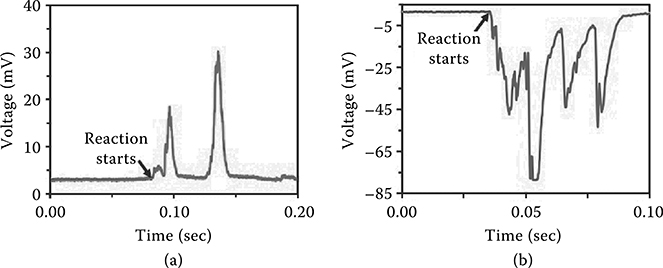
FIGURE 4.7 Comparison of oscillations between Sb2Te3-and Bi2Te3-based thermopower devices. (a) Oscillatory thermopower voltage signal for Sb2Te3 device using Al2O3 substrate. (b) Oscillatory thermopower voltage signal for Bi2Te3 device using Al2O3 substrate. We can see that Bi2Te3-based devices exhibit amplitudes approximately three times larger than those of Sb2Te3-based devices. The difference is similar to the variation in the thermal conductivities of Bi2Te3 and Sb2Te3.
The change in thermal conductivity affects the heat loss parameter as discussed in Section 4.2. The higher thermal conductivity of Sb2Te3 compared to Bi2Te3 enhances the heat transfer. Hence, faster combustion velocities are predicted for Sb2Te3-based devices and the system is closer to the parameter values where oscillations in the combustion occur. However, as the model is based on a one-dimensional average over all the layers, the resultant changes predicted are not as dramatic as observed in the experiments. Abrahamson et al. [15] have employed a similar averaged one-dimensional model. They have solved their model numerically (rather than use the asymptotic results that we have) with a set of estimated parameter values and found corresponding results to those reported in this work, albeit for carbon nano-tube-guided thermopower waves, which are on a smaller scale than the thin-film-based devices.
The analysis of voltage and power as a function of mass shows an optimal mass range for both Sb2Te3-and Bi2Te3-based devices (Figure 4.8a, b). A very low amount of fuel does not generate enough heat to sustain the propagation of the exothermic reaction. Too much fuel, on the other hand, may provide more heat energy, but the unreacted accumulated fuel mass renders the reaction unsustainable [2]. As a result, we observed an optimal mass range (22–26 mg for ~75 mm2 samples) that sustained the wave front propagation. Both types of devices exhibited well-matched trends in terms of the relation between voltage and mass (Figure 4.8a).
Comparison of peak power versus mass for the two different materials is shown in Figure 4.8(b). The peak power was determined using the equation
in which P is the peak power in watts, V is the peak output voltage in volts, and R is the resistance in ohms.
The resistance of the Sb2Te3 films ranged from 6–12 Ω, while Bi2Te3 films’ resistances were between 2 and 10 Ω. The difference between the resistances can be attributed to the larger electrical conductivity of Bi2Te3. Hence, we expect the power output from Bi2Te3-based devices to be higher. Experimental observations show that the peak power generated by Sb2Te3-based devices is ~6 mW, while Bi2Te3-based devices on an average generate 67% larger power with the peak value of ~10 mW. The resistance of the thermoelectric films remains almost the same even after the end of the reactions. The resistance dependence on temperature is defined by the following equation:
where T is the temperature, To is the reference temperature, Ro is the resistance at To, and α is the temperature coefficient of resistivity of the material. Since Sb2Te3 and Bi2Te3 are semiconductors, they exhibit negative temperature coefficient of resistivity [23,24]. Hence, it is expected that the resistance actually decreases during the reaction propagation in our case.

FIGURE 4.8 (a) Comparison of voltage generated as a function of mass (of fuel and thermo-electric material) for Sb2Te3-and Bi2Te3-based thermopower devices. (b) Power as a function of mass. (c) Comparison of the reaction propagation velocity for Sb2Te3-and Bi2Te3-based devices.
Additionally, the XRD pattern of the samples after the thermopower wave propagation, confirms that the structures of Sb2Te3 and Bi2Te3 remain unchanged (Figure 4.5a and b [3]), as the peaks remain dominantly unaltered. The average wave front propagation velocity for Sb2Te3-based devices was approximately 0.7 m/ s compared to ~0.3 m/ s average propagation velocity for Bi2Te3-based devices. Propagation velocities for Sb2Te3-based devices were generally 2–2.5 times higher than the velocity for Bi2Te3-based devices (Figure 4.8c). This nicely corresponds to the difference in the thermal conductivities of the two thermoelectric materials.
A higher thermal conductivity of the thermoelectric material provides an extra path for heat conduction (i.e., the surface of the Sb2Te3 film) in addition to the path provided by the thermally conductive Al2O3 substrate. This will consequently cause the wave to travel faster on Sb2Te3, as the thermal wave generated from the exothermic reaction travels approximately 2.5 times faster than on Bi2Te3.
4.4.3.2 Thermopower Devices Based on Terracotta Substrate
The oscillatory behavior and wave front velocities strongly depend on the thermal conductivity of the substrate. Terracotta has an identical thermal conductivity to Bi2Te3. However, thermal conductivity of Sb2Te3 is 2.5 times higher. Consequently, we expect the rate of heat conduction for Sb2Te3-based devices to be approximately 2.5 times faster than for Bi2Te3-based thermopower devices.
Figure 4.9(a,b) shows the voltage signals obtained for Sb2Te3/terracotta and Bi2Te3/terracotta systems, respectively. In line with our expectation, we can see that the reaction propagation for the Sb2Te3/terracotta device is approximately three times faster than the Bi2Te3/terracotta device. This endorses our explanation that the reaction propagation velocity depends on the thermal conductivity of the material. The voltages generated by both devices are comparatively low because a relatively high thermal conductivity is essential for a sustained thermopower wave propagation and to maintain a high reaction temperature [2].
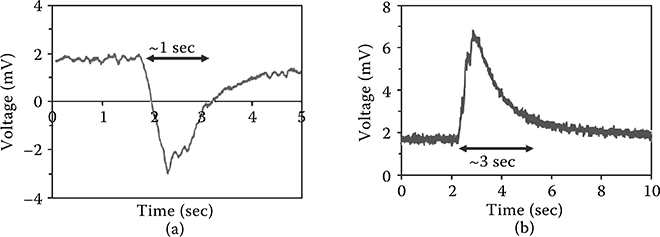
FIGURE 4.9 Comparison of thermopower voltage signals on terracotta substrates for (a) Sb2Te3 films; (b) Bi2Te3 films.
4.5 ZnO-Based Thermopower Wave Sources
4.5.1 Fabrication of ZnO Thin Films
The ZnO films were deposited using RF magnetron sputtering. A high-purity (99%) ZnO sputtering target (Vin Karola Instruments) was used in the process. The sputtering process was started after the chamber was pumped down to 2 × 10⁻⁵ Torr. Al2O3 substrates were used after being adequately cleaned using acetone, isopropanol, and distilled water successively and dried using a high-pressure nitrogen gun. The substrates were kept at room temperature during the sputtering process. RF sputtering power of 160 W was used throughout the deposition process. The sputtering process was carried out under an atmosphere of 100% argon (Ar).
A sputtering time of 60 min resulted in ~1 μm ZnO layer. Adhesive conductive silver (Ag) paste (42469, Alfa Aesar) was used to make electrical contacts between the copper tape electrodes and the ZnO samples. ZnO films exhibited a room temperature resistance of approximately 3 kΩ [9]. However, as ZnO exhibits a relatively high negative temperature coefficient of resistance, the resistance is considerably lower at the reaction temperature. This property will be discussed later in the chapter.
4.6 Results and Discussion
Zinc oxide, an N-type semiconducting oxide, is an outstanding candidate as the core thermoelectric material for thermopower-based energy sources. ZnO exhibits a relatively high Seebeck coefficient (approximately −360 μV/ K at 85°C), which increases with temperature, and a high electrical conductivity at elevated temperatures of above 300°C (ZnO film resistance of 250 Ω at 300°C—hence, it is suitable for operation in thermopower wave sources), high thermal conductivity (15 W/ m.K at 300°C), and good chemical stability [25,26]. The temperature dependence of the Seebeck coefficient and electrical conductivity is discussed in this chapter.
It has been shown that ZnO-based thermopower devices are capable of generating significantly larger voltages and oscillation amplitudes than previously reported systems utilizing MWNTs, Bi2Te3, and Sb2Te3 as the core thermoelectric materials.
The ZnO films were deposited on alumina (Al2O3) substrates using RF magnetron sputtering. Previous work carried out on RF sputtered ZnO films shows that their resistivity can vary up to eight orders of magnitude depending on the sputtering power and the substrate temperature [27-29]. Consequently, a high sputtering power (160 W) was used and no substrate heating was applied in order to synthesize crystalline and electrically conductive ZnO thin films (~1.2 μm). Nitrocellulose [C6H8(NO2)2O5] was used as the fuel, due to its large enthalpy of reaction (4.75 × 10⁶ J/ kg) [30]. Sodium azide (NaN3) in aqueous solution (50 mg/ mL) was then added to serve as a primary igniter to lower activation energy (40 kJ/ mol for NaN3 compared to 110–150 kJ/ mol for nitrocellulose).
Similarly to Bi2Te3-and Sb2Te3-based thermopower wave systems, ignition is initiated at one end using a blow torch with a fine tip, resulting in self-propagating reaction waves that travel at a rapid pace to the opposite end. This accelerated reaction wave entrains a simultaneous wave of electrical carriers, resulting in an oscillatory voltage output.
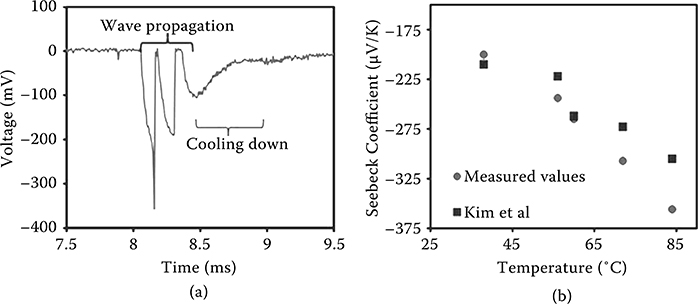
FIGURE 4.10 (a) Oscillatory thermopower voltage signal obtained using the fuel/ ZnO/ Al2O3 device. (b) Measured and literature values of the Seebeck coefficient at different temperatures [25].
A typical thermopower voltage signal obtained across a sample of the fuel/ ZnO/ Al2O3 system is shown in Figure 4.10(a). The moving temperature gradient results in voltages with peak magnitudes of up to 500 mV and oscillations with peak-to-peak amplitude of up to 400 mV. The power obtained from these devices can be as large as 1 mW.
Using the theoretical model presented in Section 4.2, we were able to predict the oscillatory behavior and the propagation velocity of the thermopower waves [10]. The theoretical analysis concluded that the oscillatory behavior and wave front velocities strongly depend on the thermal conductivity. A change in thermal conductivity affects the heat loss parameters of the system. It was demonstrated that a higher thermal conductivity enhances the heat transfer through the thermoelectric core, resulting in a proportional increase in combustion velocities. Consequently, Sb2Te3-based systems exhibited combustion velocities that were almost 2.5 times faster than the Bi2Te3-based devices, reflecting the difference in the thermal conductivities of the two materials [8].
Hence, based on the aforementioned analysis, it is expected that a higher thermal conductivity of ZnO (~15.0 W/ m.K) compared to Bi2Te3 (1.0 W/ m.K) and Sb2Te3 (2.5 W/ m.K) would result in a faster wave velocity and larger oscillations. The velocity of the waves in our system was assessed using the duration in which the output voltage exists. We have previously shown that the duration of the voltage signal corresponds to the reaction wave propagation time, which enables us to calculate the linear propagation velocity of the thermopower waves [8,20]. A high thermal conductivity of the ZnO thermoelectric material provides an extra path for heat conduction (i.e., the surface of the ZnO film) in addition to the path provided by the thermally conductive Al2O3 substrate. As a result, we initially expect the rate of heat conduction for ZnO-based devices to be approximately 15 times faster than for Bi2Te3-based thermopower devices. Propagation velocities for the ZnO-based devices were measured to range between 12 and 35 m/ s, which was generally 15–25 times higher than the velocities for Sb2Te3-(1.2 m/ s) and Bi2Te3-(0.4 m/ s) based devices demonstrated previously [8,20]. This difference nicely corresponds to the variation in the thermal conductivities of these materials and is in excellent agreement with theoretical expectations.
It has been previously shown that in a thin film thermopower system configuration in which nitrocellulose is incorporated as the fuel, the reaction temperature remains under 300°C [8,20]. As a result, the Seebeck coefficient and resistance of the ZnO films within this range needed to be estimated. Kim et al. have shown that the Seebeck coefficient of ZnO increases with temperature. In their work, it has been demonstrated that the Seebeck coefficient of ZnO is approximately −300 μV K–1 at 85°C [25]. The Seebeck coefficient of the ZnO films was measured to be approximately −360 μV K–1 (Figure 4.10b). At 300°C, the Seebeck coefficient is expected to be approximately −500 μV K–1 based on linear extrapolation [25]. It has been reported that ZnO exhibits a negative temperature coefficient of resistance at temperatures up to 350°C [31,32]. The ZnO film resistance was measured at temperatures of up to 300°C, and the value of the temperature coefficient of resistance is in close agreement with Caillaud, Smith, and Baumard (approximately −3.5 × 10⁻³/°C) [31]. At 300°C, the resistance was reduced to approximately 250 Ω (from 3.4 kΩ at room temperature). Figure 4.11(a) illustrates the Raman spectra (indicated as “1”) of the as-grown ZnO structure. The peaks observed at around 436 and 576/cm correspond to the E2 (high) and the dominant A1 (LO) modes, respectively. The E2 (high) is a characteristic mode of the ZnO hexagonal wurtzite-type lattice [33]. The Raman peaks after the deposition of nitrocellulose (spectrum “2” in Figure 4.11a) show the presence of strong C– H and NO2 bonds [34].
After the thermopower wave propagation, the C– H and NO2 bonds disappear, while carbon peaks appear on the Raman spectra (spectrum 3 in Figure 4.11a). The exothermic reaction causes the C– H bonds to decompose, while carbon is left behind as the residual product. The x-ray diffraction pattern in Figure 4.11(b) reveals that the ZnO films are highly crystalline with a strong c-directional (002) preferred orientation. Addition of nitrocellulose results in an acute reduction in intensity of the 25.3° 2θ Al2O3 substrate peak. This is because the 25.3° 2θ Al2O3 substrate peak lies in the same region as the principal XRD reflections for nitrocellulose (ICDD no. 03-0114). A general decrease in diffraction intensity due to the nitrocellulose coating inhibiting x-ray penetration is observed [8]. The XRD pattern following thermo power wave propagation shows strong ZnO peaks (Figure 4.11b), verifying that ZnO remains largely intact at the end of the process.
Using AFM, the roughness of the ZnO films was determined to be approximately 250 nm (Figure 4.12).
It has therefore been shown that ZnO is excellent for application as a core material for thermopower wave-based energy sources as it exhibits a high Seebeck coefficient (−360 μV/ K), electrical conductivity (250 Ω resistance at 300°C), and thermal conductivity (15 W/ m.K) [25]. The aforementioned properties of ZnO resulted in a highly oscillatory voltage output of the order of 500 mV and peak specific power of the order of 0.5 kW/ kg.

FIGURE 4.11 (a) Raman spectra of (1) ZnO film, (2) nitrocellulose-coated ZnO film (▪ peak denotes strong NO2 bonds; ♦ denotes strong C– H bonds), and (3) after the reaction (▫ peak denotes carbon). (b) XRD pattern (1) of Al2O3 substrate, (2) of ZnO before thermopower wave propagation, (3) after adding nitrocellulose, and (4) after thermopower wave propagation.
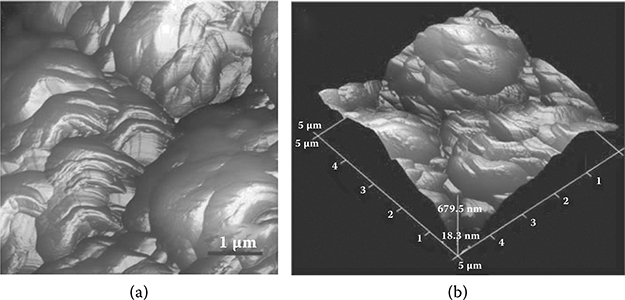
FIGURE 4.12 Samples of AFM images: (a) two-dimensional image of the ZnO film surface; (b) three-dimensional profile of the ZnO film surface
4.7 Conclusion
It has been shown that thermopower waves offer a truly unique method of scaling down the dimensions of energy sources while maintaining high specific powers. Thermopower wave systems appear to be an attractive technology for micro-and nanoscale energy generation systems, as their efficiency and the energy discharge rates increase with a reduction in dimensions.
Such systems therefore provide an excellent opportunity for future small size sources that are compatible with low-dimensional electronics.
Furthermore, such systems currently use solid fuels for the exothermic chemical reaction. Replacing solid fuels with liquid fuels can help integrate such sources with micro-and nanofluidic platforms, making a novel combination. This will transform the thermopower wave energy generation systems into a replenishable and sustainable energy generation technology.
References
1. Cook, B. W., Lanzisera, S., and Pister, K. S. J. 2006. SoC issues for RF smart dust. Proceedings of IEEE 94:1177–1196.
2. Walia, S., Weber, R., Latham, K., Abrahamson, J. T., Strano, M. S., and Kalantar-zadeh, K. 2011. Oscillatory thermopower waves based on Bi2Te3 films. Advanced Functional Materials 21:2072–2079.
3. Sekido, S. 1983. Solid state micro power sources. Solid State Ionics 9 (10): 777–781.
4. Murphy, O. J., Cisar, A., and Clarke, E. 1998. Low-cost light weight high power density PEM fuel cell stack. Electrochimica Acta 43:3829–3840.
5. Martin, J. L., and Osenar, P. 2009. Portable military fuel cell power systems. ECS Transactions 25: 249–257.
6. Nakanishi, H., and Grzybowski, B. A. 2010. Supercapacitors based on metal electrodes prepared from nanoparticle mixtures at room temperature. Journal of Physical Chemistry Letters 1:1428–1431.
7. Choi, W., Abrahamson, J. T., Strano, J. M., and Strano, M. S. 2010. Carbon nanotube-guided thermopower waves. Materials Today 13:22–33.
8. Walia, S., Weber, R., Sriram, S., Bhaskaran, M., Latham, K., Zhuiykov, S., et al. 2011. Sb2Te3 and Bi2Te3 based thermopower wave sources. Energy & Environmental Science 4:3558–3564.
9. Walia, S., Weber, R., Balendhran, S., Yao, D., Abrahamson, J. T., Zhuiykov, S., et al. 2012. ZnO based thermopower wave sources. Chemical Communications 48:7462–7464.
10. Mercer, G. N., Weber, R. O., and Sidhu, H. S. 1998. An oscillatory route to extinction for solid fuel combustion waves due to heat losses. Proceedings of the Royal Society of London, Series A—Mathematical Physical and Engineering Sciences 454:2015–2022.
11. Zarko, V., and Kiskin, A. 1980. Numerical modeling of nonsteady powder combustion under the action of a light flux. Combustion, Explosion, and Shock Waves 16:650–654.
12. Bayliss, A., and Matkowsky, B. J. 1994. From traveling waves to chaos in combustion. SIAM Journal of Applied Mathematics 54:147–174.
13. McIntosh, A. C., Weber, R. O., and Mercer, G. N. 2004. Nonadiabatic combustion waves for general Lewis numbers: Wave speed and extinction conditions. Anziam Journal 46:1–416.
14. Choi, W., Hong, S., Abrahamson, J. T., Han, J. H., Song, C., Nair, N., et al. 2010. Chemically driven carbon– nanotube-guided thermopower waves. Nature Materials 9:423–429.
15. Abrahamson, J. T., Choi, W., Schonenbach, N. S., Park, J., Han, J-H., Walsh, M. P., et al. 2010. Wavefront velocity oscillations of carbon-nanotube-guided thermopower waves: Nanoscale alternating current sources. ACS Nano 5:367–375.
16. Sommer, I. 1972. Crystal growth of Sb2Te3 by chemical transport. Journal of Crystal Growth 12:259–260.
17. Zimmer, A., Stein, N., Johann, L., Terryn, H., and Boulanger, C. 2008. Characterizations of bismuth telluride films from Mott-Schottky plot and spectroscopic ellipsometry. Surface and Interface Analysis 40:593–596.
18. Burnham, A. K., and Fried, L. E. 2006. Kinetics of PBX9404 aging (http://www.ntis.gov/search/product.aspx?ABBR=DE2006894349).
19. Katoh, K., Ito, S., Kawaguchi, S., Higashi, E., Nakano, K., Ogata, Y., et al. 2010. Effect of heating rate on the thermal behavior of nitrocellulose. Journal of Thermal Analysis and Calorimetry 100:303–308.
20. Walia, S., Weber, R., Latham, K., Petersen, P., Abrahamson, J. T., Strano, M. S., et al. 2011. Oscillatory thermopower waves based on Bi2Te3 films. Advanced Functional Materials 21:2072–2079.
21. Pradyumnan, P., P. Swathikrishnan. 2010. Thermoelectric properties of Bi2Te3 and Sb2Te3 and its bilayer thin films. Indian Journal of Pure & Applied Physics 48:115–120.
22. Choi, W., Hong, S., Abrahamson, J. T., Han, J. H., Song, C., Nair, N., et al. 2010. Chemically driven carbon-nanotube-guided thermopower waves. Nature Materials 9:423–429.
23. Das, V. D., Soundararajan, N., and Pattabi, M. 1987. Electrical conductivity and thermoelectric power of amorphous Sb2Te3 thin films and amorphous crystalline transition. Journal of Materials Science 22:3522–3528.
24. Das, V. D., and Soundararajan, N. 1988. Size and temperature effects on the thermoelectric power and electrical resistivity of bismuth telluride thin films. Physical Review B 37:4552–4559.
25. Kim, K. H., Shim, S. H., Shim, K. B., Niihara, K., and Hojo, J. 2005. Microstructural and thermoelectric characteristics of zinc oxide-based thermoelectric materials fabricated using a spark plasma sintering process. Journal of the American Ceramic Society 88:628–632.
26. Jood, P., Mehta, R. J., Zhang, Y. L., Peleckis, G., Wang, X. L., Siegel, R. W., et al. 2011. Al-doped zinc oxide nanocomposites with enhanced thermoelectric properties. Nano Letters 11:4337–4342.
27. Lim, S. J., Kwon, S. J., and Kim, H. 2008. ZnO thin films prepared by atomic layer deposition and rf sputtering as an active layer for thin film transistor. Thin Solid Films 516:1523–1528.
28. Jayaraj, M. K., Antony, A., and Ramachandran, M. 2002. Transparent conducting zinc oxide thin film prepared by off-axis RF magnetron sputtering. Bulletin of Materials Science 25:227–230.
29. Martínez, M. A., Herrero, J., and Gutiérrez, M. T. 1994. Properties of RF sputtered zinc oxide based thin films made from different targets. Solar Energy Materials and Solar Cells 31:489–498.
30. Lemieux, E., and Prud’Homme, R. E. 1985. Heats of decomposition, combustion and explosion of nitrocelluloses derived from wood and cotton. Thermochimica Acta 89:11–26.
31. Caillaud, F., Smith, A., and Baumard, J.-F. 1991. Effect of oxygen chemisorption on the electrical conductivity of zinc oxide films prepared by a spray pyrolysis method. Journal of the European Ceramic Society 7:379–383.
32. Al-Hardan, N. H., Abdullah, M. J., and Aziz, A. A. 2010. Sensing mechanism of hydrogen gas sensor based on RF-sputtered ZnO thin films. International Journal of Hydrogen Energy 35:4428–4434.
33. Ozgur, U., Alivov, Y. I., Liu, C., Teke, A., Reshchikov, M. A., Dogan, S., et al. 2005. A comprehensive review of ZnO materials and devices. Journal of Applied Physics 98:041301.
34. Moore, D. S., and McGrane, S. D. 2003. Comparative infrared and Raman spectroscopy of energetic polymers. Journal of Molecular Structure 661:561–566.