Chapter Five

Information and Communication Technology for EPN

K.A. Ellis*
D. Pesch**
M. Klepal**
M. Look
T. Greifenberg
M. Boudon
D. Kelly*
C. Upton*
*    IoT Systems Research Lab, Intel Labs, Intel Corporation, Ireland
**    NIMBUS Centre for Embedded Systems Research, Cork Institute of Technology, Cork, Ireland
    Software Engineering, RWTH Aachen University, Aachen, Germany
    EMBIX, Issy-les-Moulineaux, Paris, France

Abstract

Information and Communication Technologies (ICT) are pervasive in our urban neighborhoods, not just in terms of traditional computing devices but also in terms of embedded monitoring and control systems that manage our environment, in particular the energy consumption of our buildings, homes, outdoor lighting systems, traffic, and safety systems. Huge opportunity exists in leveraging these systems into neighborhood management platforms that can provide innovative energy services to the neighborhood and the wider energy grid.

This chapter outlines the challenges and opportunities associated with the provision of ICT based energy positive neigbborhoods. The chapter begins with an overview of the technical challenges, changing ICT landscape and the emergence of the Internet of Things (IoT). This is followed by an identification of the requirements for heterogeneous data acquisition, technologies for coping with increasingly voluminous and varied data at differing velocities and in attesting to the veracity of such data. End-to-end approaches to services at a neighborhood scale are presented followed by a discussion of a system-of-systems (SoS) approach to service provision at the district level.

This system-of-systems approach, was proposed within the European Commission part funded FP7 project—COOPERaTE. In particular the concept of a Neighborhood Information Model (NIM), a metamodel approach to a common data model and an web-based service implementation is introduced as a means of integrating heterogeneous management platforms. An example of how the NIM was used within the COOPERaTE project to integrate multiple systems into an EPN platform is presented as are exemplar service. Conclusion draw the chapter to a close.

Keywords

Internet of things
information and communication technology
system-of systems
information model
energy services
energy positivity
district optimization

1. Introduction

Our urban infrastructure, for example homes, commercial and industrial buildings, outdoor spaces, streets, transport infrastructure, and also our energy grids are heavily instrumented with a variety of monitoring and control systems. These systems have been embedded into our environment to manage energy flows and usage, control buildings and our homes, to control traffic and lighting in our streets and so on, thus helping to improve our daily life’s. These monitoring and control systems have traditionally been standalone and vendor specific, for example, a building monitoring and control system manages just the building it is installed in, the street lighting system controls the light along just one street, traffic lights are controlled along one street or even only at a single junction, a parking control system manages one car park. There are many more examples of these soiled system that manage our environment. However, our increasingly digitalized world now offers opportunities to connect these individual systems via the Internet into a much larger system. The emergence of the Internet of Things (IoT) (Yan, Zhang, Yang, & Ning, 2008) and the continued digitalization trend, provide opportunities to create a system-of-systems (SoS) (Boardman & Sauser, 2006) beyond individual, isolated monitoring and control systems. The opportunity of networking individual systems into a bigger, SoS offers new business cases, that is opportunities to gather data, analyze it and to develop new services based on the availability of data from a broad spectrum of systems. In particular the opportunity to develop new energy management services based on a virtual neighborhood management platform that connects individual systems within a neighborhood and shares data motivated the EU funded FP7 COOPERaTE project. The project’s focus was to develop concepts and services for Energy Positive Neighborhoods (EPN) as outlined in Chapter 2. COOPERaTE, like other initiatives focused on making urban neighborhoods more energy efficient and energy flexible, envisioned new services that would monitor energy use across the neighborhood and aggregate the information, services that manage energy consumption in individual buildings, forecast energy usage, optimize energy purchase between grid based energy supply and on-site generation, and demand response (DR) services that trade energy between buildings and the grid (Pesch, Ellis, Kouramas, & Assef, 2013). Value add services were also envisioned that link the building infrastructure to the outside spaces within an urban neighborhood to optimize traffic, parking, street lighting, and security.
However, the main road blocks to achieving an integrated IoT based SoS are the many different standards that are used for machine-to-machine (M2M) communication technologies, radio frequencies, networking protocols, data formats, management platforms, service formats, and security protocols. The plethora of technologies and formats has hindered integration across existing systems at both the system and the data layer. Techniques to overcome such issues are the focus of much current research and invariably the COOPERaTE project experienced some key challenges.
The first key challenge identified by the project was the issue of “Interoperability”. Interoperability whether technical, syntactic, semantic, or organizational is arguably the number one barrier to IoT and SoS adoption. Section 2 focuses on identifying technology and standards to consider with respect to the connectivity and interoperability of resources and services within the built environment, smart city, smart grid sector, and more generally the IoT, which as Fig. 5.1 (Postscapes, 2015) and Fig. 5.2 (Carrez et al., 2013Cisco, 2013ITU-T, 2012Intel, 2015Open Interconnect Consortium, 2015Industrial Internet Consortium, 2015) suggests is a bourgeoning landscape of multiple standards, technologies, and alliances.
image
Figure 5.1 IoT alliance round-up (Postscapes, 2015).
Heterogeneous data, low level communication protocols, and networks all pose interoperability challenges to be navigated. Uncertainty regarding which technology and standards should be applied act as a barrier to IoT adoption and any envisaged domain services. Once a data format, a communication protocol, and a transfer medium have been chosen, the next interoperability question arises, semantics. Like before there are many existing standards with different advantages and disadvantages that has to be decided upon. The COOPERaTE approach is to integrate these heterogeneous standards while minimizing changes to existing systems.
The second key challenge identified by the project relates to “Trust, Security, and Privacy”. Trust, Security, and Privacy has become a huge challenge in the digitalized world. This is due to the increasing amount of available data containing personal information, and the cloud computing techniques used to cope with same. Fig. 5.3, is taken from an IDC published report (Bradshaw, Folco, Cattaneo, & Kolding, 2012), “estimates of the demand for cloud computing in Europe and the likely barriers to take up”, while Fig. 5.4 (Bonagura, Folco, Kolding, & Laurini, 2012) is a follow on analysis of the same report. The data shown in Fig. 5.3 suggests that amongst those stakeholders surveyed, “data location” and “security” were the highest ranking barriers to cloud adoption with almost half of all stakeholders rating “security” as the biggest barrier. Approaches to increase the trust in cloud computing are described in (Helmut Krcmar, Ralf Reussner, & Bernhard Rumpe, 2014). Interestingly “interoperability” and “standardization” where also identified in the IDC report. Fig. 5.4 illustrates that 62.2% of survey respondents mentioned at least one of the top six concerns, which indicates quite strongly that trust, security, and privacy are significant barriers to adoption.
image
Figure 5.3 Stakeholder identified main barriers to adoption (Open Interconnect Consortium, 2015).
image
Figure 5.4 Percentage of respondents stating barrier is restricting (very/completely) cloud adoption (Bonagura et al., 2012).
While the reports (Bradshaw et al., 2012Bonagura et al., 2012) are cloud specific they can arguably be taken as a reasonable proxy as to the importance of security, privacy, and interoperability to the ICT solutions investigated in the context of EPN. Whereby the solutions investigated are a combination of traditional embedded monitoring and control systems and cloud computing based data services, that is, solutions increasingly being described as IoT systems. Within the COOPERaTE project this challenge is set against the context of an energy sector that tends to be conservative in terms of ICT technology adoption.
The third key challenge identified by the project relates to “Complexity” and the impact that has on federation of data. This challenge essentially goes hand-in-hand with the interoperability challenges. The respondents of (Bradshaw et al., 2012Bonagura et al., 2012) are in the main considering adoption from an organizational perspective. Delivery of an Energy Positive Neighborhood (EPN) is a far more complex brownfield scenario with heterogeneous systems and multiownership. The technologies described in Section 2 are a mixture of well-established and increasingly adopted technologies that can form part of any proposed EPN solution. However, in the main, adoption to date has been within silos. The issue faced in the context of EPN is that scale is measured at the neighborhood level not at an organizational level. Information needs to flow between systems and actors and this compounds the trust, security, and privacy issues and critically, the interoperability challenge. Cloud technology is arguably fit for purpose today, in terms of delivering the scale, security, and flexibility required at the neighborhood level, but the challenge is more one of ownership and interoperability with legacy in situ systems and new increasingly distributed resources.
To tackle these challenges the COOPERaTE project adopted an interoperable data driven approach that mitigates some of these issues without forcing major changes to existing systems. However, before discussing the specifics of the approach, its necessary to first review the standards and technologies to consider when developing IoT/SoS solutions.

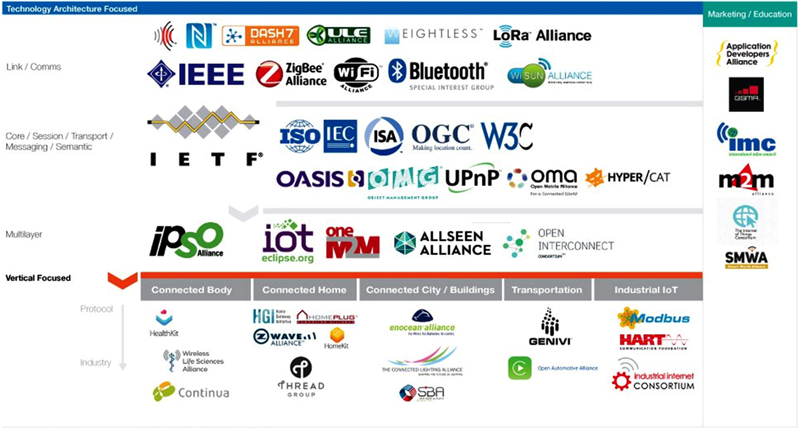
2. Standards and Technologies of Interest

This section describes some of the technologies and standards to be considered when developing ICT/IoT/SoS solutions in general and also for the delivery of energy services at the building and neighborhood level in particular. Any given solutions will most likely be composed of technologies and standards at different conceptual levels. This analysis uses the Industrial Internet Consortium (IIC) (Industrial Internet Consortium, 2015) “Edge, Platform and Enterprise tiers” (Fig. 5.5) as a structural guide to the conceptual position of different technologies. Additionally, the layers of the “IoT World Forum reference model” (Postscapes, 2015) were loosely used as a more granular structure/taxonomy as they cover all required functional elements.
image
Figure 5.5 The IIC 3-tier reference architecture (Industrial Internet Consortium, 2015).
The proximity network (Fig. 5.5) connects the sensors, actuators, devices, control systems, and assets, collectively called “edge nodes”. It typically connects these nodes, as one or more clusters related to a gateway that bridges to other networks. The access network enables connectivity for data and control flows between the edge and the platform tiers. It may be a corporate network, or an overlay private network over the public Internet, or a 3G/4G network. The access network bridges edge compute/gateway functions with greater compute capacity, storage, and analytical tools. The architecture depicted in Fig. 5.5 largely assumes a gateway-centric view of the IoT. What this means is that edge nodes need not be “smart” as the gateway provides much of the required functionality and compute capacity. There are other views, for example a cloud-centric view whereby, individual edge nodes communicate directly into a remote cloud backend. An onpremises or fog view sees both backend compute and edge nodes geographically localized, perhaps also integrating with remote cloud compute. While a distributed edge-centric view effectively sees increased intelligence, control, and peer-to-peer edge communications. (http://www.wi-next.com/2015/03/living-cloud-gateway-edge-iots-fragmented-future/)

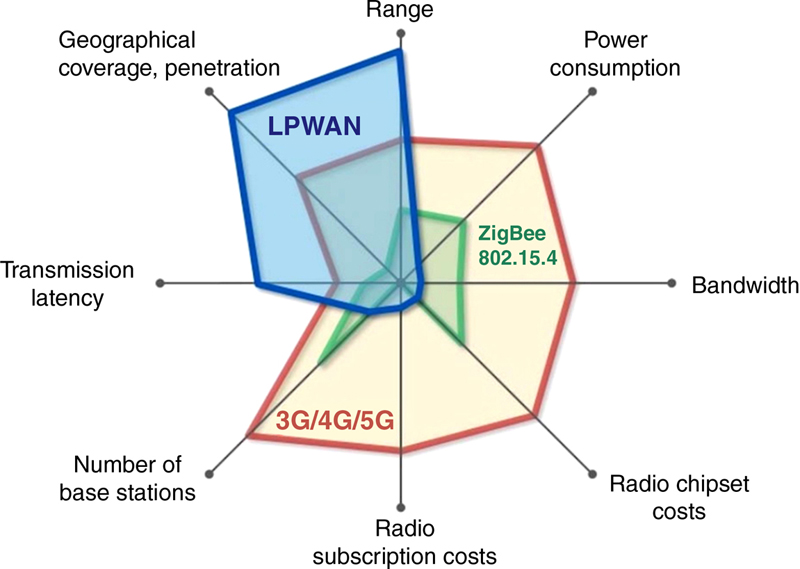
2.1. Edge Compute and Communication Technologies
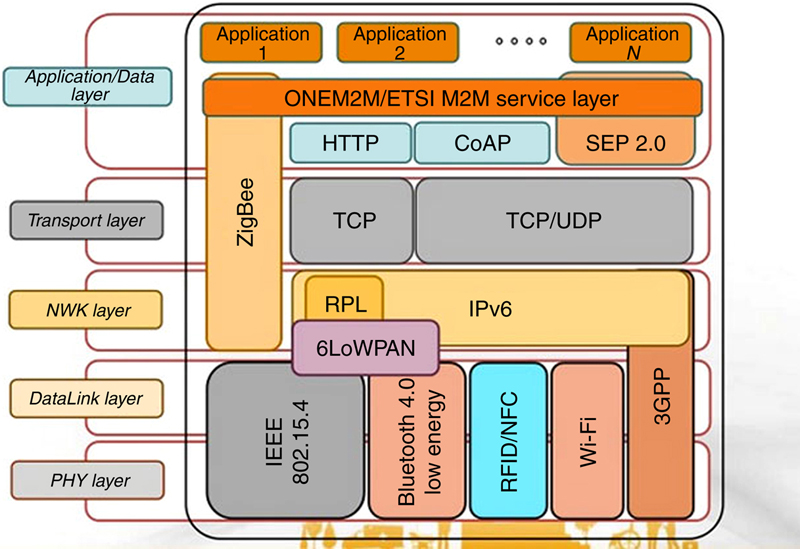
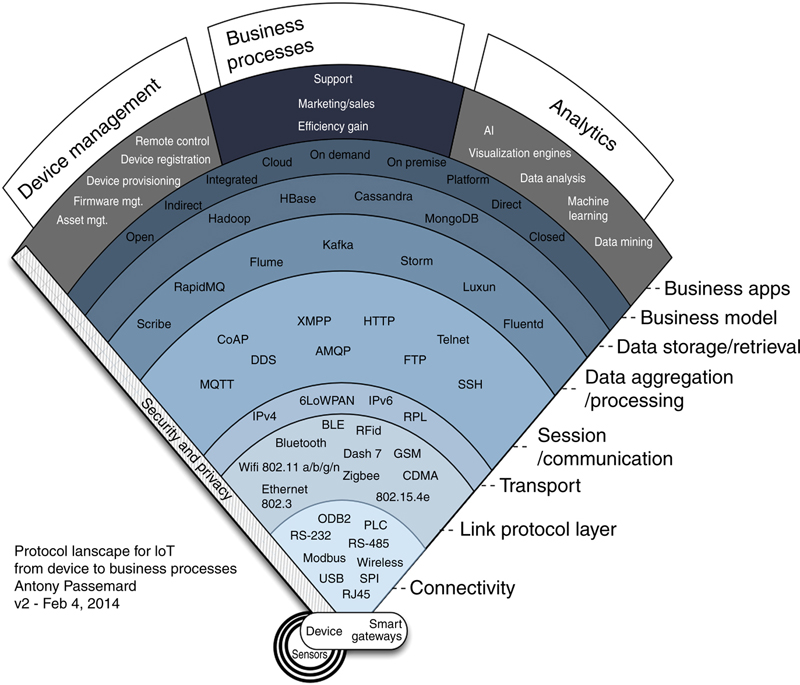
The IoT involves “physical things/devices” for example, sensors, motors, fridges, fans, locks, lights, boilers, controllers, and so on. Such edge nodes are varied and voluminous. As per Fig. 5.1 there are numerous alliance all of which utilize various M2M communication protocols in connecting the compute functions associated with such nodes. Examples of wired and wireless communications include Ethernet, Wi-Fi, IEEE 802.15.4 based (Z-wave, Zigbee, WirelessHart, 6LoWPAN), LoRa, DASH 7, Modbus, Profibus, RS232, and RS485, and many others. Fig. 5.6 (http://www.slideshare.net/butler-iot/butler-project-overview-13603599) outlines example protocols utilized by the alliances/architectures of Fig. 5.1 and 5.2 superimposed over the OSI 7 layer protocol stack model (Zimmermann, 1980). Some M2M communications like Zigbee are full protocol stacks which in this case is built on the IEEE 802.15.4 standard, but are commonly understood to relate to the connection of edge nodes.
image
Figure 5.6 Communication protocol exemplars Source the Butler project (http://www.slideshare.net/butler-iot/butler-project-overview-13603599).
Often within the built environment M2M communications are based on more industrial oriented protocols, such as PROFIBUS, PROFINET, IO-Link, LON, BACNet, Modbus, OPC-UA, FDI, ISA100.11a, HART, WirelessHART. Traditional IP technologies, such as IP, IPv6, or Ethernet (IEEE 802.3), and other specific communication technologies like Near Field Communication (NFC) and ultrawide bandwidth (UWB) have also been used more recently. Figs. 5.6 and 5.7 (https://entrepreneurshiptalk.wordpress.com/2014/01/29/the-internet-of-thing-protocol-stack-from-sensors-to-business-value/) highlight just how onerous a task it is to select an IoT solution given the number of options for communicating with physical things is reflective of the multitude of things to be connected, monitored, and controlled.
image
Figure 5.7 Protocol landscape for IoT from device to business processes, Antony Passemard v2, Feb. 4, 2014. (https://entrepreneurshiptalk.wordpress.com/2014/01/29/the-internet-of-thing-protocol-stack-from-sensors-to-business-value/).
To date, the approach to deal with complexity has typically been to adopt a leading standard, or propose one, but this can be a labored process. Additionally, IoT type services increasingly look to leverage multiple data sources to infer knowledge and insights. One could adopt a cloud-centric, gateway-centric, or distributed edge-centric approach as introduced previously, but invariably there will be a requirement to enable interoperability, that is, data exchange/translation needs to happen at some point. Whether that happens in a data center, more locally or in a truly distributed fashion is at the crux of the various approaches. The description of “edge gateways” and “abstraction layer technologies” that follow envisage a combined gateway and cloud-centric view, but increased computational power in the embedded space coupled with improvements in power envelope and communications means some aspect of distributed approaches are on the increase.
An edge gateway is a device which provides an entry point into enterprise or service provider core networks. Examples include routers, routing switches, integrated access devices (IADs), multiplexes, and a variety of metropolitan area network (MAN) and wide area network (WAN) access devices (https://en.wikipedia.org/wiki/Edge_device). Put simply, an edge gateway is a device that bridges two networks. It is considered to be at the edge of the networks because data must flow through it before entering either network. Edge gateways in this context can be data-center hosted or in-the-field devices, which (Fig. 5.5) connect the proximity network of the lower level wired/wireless edge nodes and the access network linking to larger scale compute, storage, and analytics services. Based on the latter description Table 5.1 lists examples of hardware that can act as gateways in the built environment.

Table 5.1

Edge hardware exemplars

x86 micro-PC Raspberry Pi
Intel Galileo, Edison, Building Automation Gateways
Intel DK series Alcatel–Lucent HSG(Home Sensor Gateway)
Honeywell XYR300G Lantiq GRX family
The gateway itself is tasked with providing the requisite compute, memory, communication, and other interfaces required to link edge nodes (sensors and actuators) and the internet. It is a combination of hardware and software that enables what is essentially a translation/abstraction functionality, whereby the gateway links the data protocols of edge nodes and higher order compute nodes. As such, data abstraction technologies form an integral element of the gateway function.
As discussed previously, in IoT-enabled scenarios, invariably there is the requirement to enable interoperability between heterogeneous low level communication protocols. For example, in the built environment one might want to convert from Modbus RTU and say BACnet IP whereas in residential settings one might have Zigbee, Z-Wave, and Bluetooth sensors. Ideally one would want a gateway that could communicate/connect all three. A combination of hardware and software is required to do so. The gateway requires the communication hardware, but from a software perspective, some means of parsing the various data formats is required, as is some logic to decide what to do with the data. This can, of course, be done on a case by case basis, but that is not ideal. One means of addressing the issue is to utilize a “devise abstraction layer” type technology which acts as an extensible standard and handles data translation/exchange from different connecting protocols. Table 5.2 identifies some examples, many of which are OSGI (https://www.osgi.org/) Java based.
Some proximity network communication protocols that is, Zigbee are meshed technologies and can cover a reasonable range within a building, however, the “access network”, linking the edge tier, and the platform tier, typically utilizes fiber or cellular based technologies, such as GPRS, EDGE, HSPA, LTE, LTE+, or wireless metropolitan area network (WMAN) technologies such as WiFi (wireless mesh) and WiMAX. However, increasingly low-power wide-area network (LPWAN) technologies, for example, LoRA, SigFox, Neul, and WEIGHTLESS, are being seen as alternatives for IoT M2M based communications, both within the proximity network and to some extend at the access network level. LPWAN technologies are aimed at addressing high coverage and very low power. The technology is particularly suited to M2M use cases, where data rates can be low and infrequent. While cellular based solutions play an important role in today’s M2M networks, they often have significant power requirements and are chatty. This type of overhead is unsuitable for many M2M applications. Moreover the current capacity limitations reduces the number of concurrent connections available at macro cells (Guibene, Nolan, & Kelly, 2015). LPWAN networks generally operate in the Sub-1GHz unlicensed spectrum, enabling longer range and building penetration and allowing installation without having to acquire a spectrum license. Moreover, LPWAN solutions which operate at lower frequencies can cover significant geographic distances when compared to high-bandwidth cellular technologies. Fig. 5.8 (Guibene et al., 2015) shows how LPWAN technologies (SigFox, Neul, and LoRa) compare to classical cellular technologies (3G/4G/5G) and to low power short range mesh technologies (IEEE802.15.4, ZigBee) in terms of latency, cost, power consumption, and geographical coverage (Guibene et al., 2015). The number of options at the access network hamper solution selection for domain actors as much needs to be considered in identifying the best technological fit.
image
Figure 5.8 LPWAN target characteristics (Guibene et al., 2015).

2.2. Data Analytics Technologies, Frameworks, and Applications

Technologies and standards in the Platform tier are essentially tasked with providing access to what is typically described as “data storage”, “data analytics”, or “big data analytics” infrastructure and frameworks. As can be seen from Table 5.3, this tier is a myriad of some well-established and some emerging technologies and standards. Similar to the networking technologies, the spectrum of available technologies and solutions creates a challenge in identifying the best fit for a particular requirement. Therefore, a careful analysis of the requirements is required to identify which technology is the best fit for a particular application need.

Table 5.3

Big data analytical infrastructure and frameworks

Hadoop

HDFS For storing large datasets. Hadoop utilizes inexpensive hard drives in a very large cluster of servers. While one can expect failure on these drives, the Mean time to Failure (MTTF) is well understood. HDFS divides data into blocks and copies these blocks of data across nodes in the cluster, thus embedding built-in fault-tolerance and fault compensation within Hadoop
MapReduce For processing large data sets. MapReduce is a model of programming for processing and generating large data sets utilizing a parallel, distributed algorithm on a cluster. The MapReduce framework marshals the distributed servers, running the various tasks in parallel, manages all communications and data transfers between the various parts of the system, and provides for redundancy and fault tolerance.
Pig For analyzing large data sets. Is a platform for analyzing large data sets. It consists of a high-level language for expressing data analysis programs, coupled with infrastructure for evaluating these programs. The salient property of Pig programs is that their structure is amenable to substantial parallelization, which in turns enables them to handle very large data sets. Pig also allows the user to define their own user defined functions (UDFs).
Yet Another Resource Negotiator (YARN) Supporting multiple processing models in addition to Map Reduce. Designed to address the tendency of MapReduce to be I/O intensive, with high latency not suitable for interactive analysis. Additionally, MapReduce was constrained in support for graph, machine learning (ML) and other memory intensive algorithms.
Zookeeper Is a centralized service for maintaining configuration information, naming, providing distributed synchronization, and providing group services. Distributed applications utilize these kinds of services and they are typically difficult to implement. Zookeeper combines these services into a interface to a centralized coordination service. The coordinated service itself is distributed and highly reliable.
Apache Mesos Is a cluster manager that abstracts CPU, memory, storage, and compute resources away from machines this enables fault-tolerant and elastic distributed systems to be managed. It is built similarly to the Linux kernel, but at a different level of abstraction. The Mesos kernel runs on every machine and provides applications with APIs for resource management and scheduling across cloud environments. It can be used by Hadoop, Spark, Kafka, and Elastic Search.
Cloudera Enterprise, IBM big Insights, EMS/Pivotal HD, Hotonworks Enterprise distributions of Hadoop.

Big data storage

HBase, Cassandra NOSQL Big table stores
CouchDB, MongoDB NOSQL Document Based
Riak, Redis, HANA RDBMS, VoltDB RDBMS, OpenTSDB, KairosDB Key Value and In-Memory Databases (both RDMS & NOSQL)
Neo4j Graph Databases

Big Data Processing & Querying

Hive Is a data warehouse software which supports querying and management of large datasets residing in distributed storage. Hive provides a mechanism to project structure onto this data and query the data using a SQL-like language called HiveQL (HQL).
Apache Shark Is a port of Apache Hive designed to run on Spark. It is still compatible with existing Hive data, megastores, and queries like HiveQL. The reason for the port is that MapReduce has simplified big data analysis but users want more complex analysis capabilities and multistage applications.
Apache Tajo Data warehousing system on top of HDFS. Designed for low-latency and scalable ad-hoc queries, online aggregation, and ETL (extract-transform-load process) on large-data sets stored on HDFS and other data sources.
Apache Drill Is a low latency SQL query engine for Hadoop and NoSQL. Drill provides direct queries on self-describing and semistructured data in files (such as JSON, Parquet) and HBase tables without needing to define and maintain schemas in a centralized store, such as Hive metastore.
Cloudera Impala Is an open-source interactive SQL query engine for Hadoop. Built by Cloudera, it provides a way to write SQL queries against your existing Hadoop data. It does not use Map-Reduce to execute the queries, but instead uses its own set of execution daemons which need to be installed alongside your data nodes.
Apache Phoenix (for HBase) Provides a relational database layer over HBase for low latency applications via an embeddable JDBC driver. It offers both read and write operations on HBase data.
Presto by Facebook Is a distributed SQL query engine optimized for ad-hoc analysis. It supports standard ANSI SQL, including complex queries, aggregations, joins, and window functions.

Big Data Acquisition and Distributed Stream Processing

Apache Samza Is a distributed stream processing framework. It uses Apache Kafka for messaging, and apache Hadoop Yarn which provides fault tolerance, processor isolation, security, and resource management.
Apache Storm Is a distributed real-time computation system for processing large volumes of high-velocity data. Storm on YARN provides real-time analytics, machine learning, and continuous monitoring of operations.
Apache Spark Streaming Uses the core Apache Spark API which provides data consistency, a programming API, and fault tolerance. Spark treats streaming as a series of deterministic batch operations. It groups the stream into batches of a fixed duration called a Resilient Distributed Dataset (RDD). This continuous stream of RDDs is referred to as Discretized Stream (DStream).
Apache Spark Bagel Is a Spark implementation of Google’s Prgel A System for Large-Scale Graph Processing. Bagel currently supports basic graph computation, combiners, and aggregators.
Typesafe ConductR and Akka Stream processing ConductR is a Reactive Application Manager that lets Operations conveniently deploy and manage distributed systems. It utilizes Reactive Akka stream processing which is an open source implementation of the reactive streams draft specification. Reactive Streams provides a standard for asynchronous stream processing with nonblocking back pressure on the Java Virtual Machine (JVM).

Big Data Analytics Frameworks and Tools

Apache Spark Is a fast and general engine for large-scale processing. It provides in-memory processing for efficient data streaming applications while retaining the Hadoop’s MapReduce capabilities. It has built-in modules for machine learning, graph processing, streaming, and SQL. Spark needs a distributed storage system and a cluster manager. Spark is quick and runs programs up to 100× faster than Hadoop MapReduce in memory, or 10× faster on disk
Apache Flink Is an open source system for data analytics in clusters. It supports batch and streaming analytics, in one system. Analytical programs can be written in APIs in Java and Scala. It has native support for iterations, incremental iterations, and programs consisting of large Directed acyclic graphs (DAG) operations.
H2O Is an open source big data analysis offering. Using the increased power of large data sets, analytical algorithms like the generalized linear model (GLM), or K-means clustering, are available and utilize parallel computing power, rather than by truncating data. Efficiency is achieved by dividing data into subsets and then analyzing each subset simultaneously using the same algorithm. Iteratively results from these independent analysis are compared, eventually convergence produces the estimated statistical parameters of interest.
Weka This is a collection of data mining tasks algorithms that provide machine learning. It has tools for visualization, for data preprocessing, for classification, for regression, for clustering and for association rules. It facilitates the development of new machine learning schemes.
Massive Online Analysis (MOA) Branched from Weka, designed for data streams and concept drift. It has APIs to interact with Scala and R.
RapidMiner and RapidMiner Radoop The Rapidminer platform provides an integrated environment for machine learning, data mining, text mining, predictive analytics and business analytics. Rapidminer Radoop is a big data analytics system it provides visualization, analysis, scripting, and advanced predictive analytics of big data. It is integrated into RapidMiner on top of apache Hadoop.
Apache SAMOA Enables development of new machine learning (ML) by abstracting from the complexity of underlying distributed stream processing engines (DSPE). Development of distributed streaming ML algorithms can be done once and then can be executed on DSPEs. Such as Apache Storm, Apache S4, and Apache Samza.
Apache Spark Mlib Is a scalable machine learning library. It consists of common learning algorithms and utilities, such as classification, dimensionality reduction, regression, clustering, collaborative filtering, and optimization primitives.
Apache Spark SparkR SparkR is an R package that provides a light-weight frontend to use Apache Spark from R. Through the RDD class SparkR exposes the Spark API. Users can interactively run jobs from the R shell on a cluster.
Amazon, AWS ML, Microsoft Azure ML, Google prediction ML Commercial machine Learning (ML) solutions.


2.3. Enterprise Technologies

In the pre-IoT era, Supervisory Control and Data Acquisition (SCADA) systems were the predominant approach taken to build automated monitoring and control systems. Traditional SCADA involves Programmable Logic Controllers, Telemetry Systems, Remote Terminal Units, and Human Machine Interfaces. These systems require custom design and deployment to a specific domain and the Human Machine Interfaces tended to be desktop native applications. Traditional SCADA is still widely used in industrial processes and facilities management, however, the growth of IoT as well as advances in predictive analytics and cloud computing has created demand for more flexible solutions. Modern commercial IoT based SCADA systems make better use of data modeling techniques to map sensed data back to control interfaces and take advantage of scalable cloud-hosted software-as-a-service (SaaS) to run more complex control algorithms. At the same time there has been growing demand for frameworks and software solutions that can merge traditional Business Intelligence (BI) functionality with that of SCADA systems. New trends are starting to emerge including:
Broader device support: Most reporting tools have been designed as native desktop applications but there is an increasing demand for mobile and touch screen support. While it seems unlikely that complex queries will be developed on mobile phone or tablet screens, the consumption of reports on mobile platforms is a common request. Furthermore, trends around increasing self-service BI and Visual improvements open up possibilities for touchscreen and gestural query composition.
Improved Visualization: Many solutions include charting components that allow users to generate basic charts from their query results, however users often struggle to get the views they required due to limited chart libraries and clumsily configured GUI’s. Extended charting libraries with improved composition capabilities are expected.
Agile self-service Reporting: Traditionally data querying and analysis was carried out by the IT department or more recently by data scientists. There is an increasing demand from business users to be able to query data directly. Many advanced analytics platforms include visual query builders that support drag and drop query workflow building and charting. This codeless development will become more widespread. A range of new reporting and visualization solutions have appeared over the last decade. These range from programming libraries to dash boarding technologies to off the shelf applications. While off the shelf applications tend to provide simpler development and deployment, lower level programming libraries provide greater customization and integration capabilities. Solution providers should consider their choices accordingly.
Programming Libraries: In order to satisfy the trends of broad device support and self-service graphics many browser based java script frameworks have emerged, for example:
Dashboard Solutions: A number of dashboard building frameworks exist that enable even inexperienced programmers or general users to build effective dashboards, examples are:
Freeboard.io https://freeboard.io/
Dashing.io http://dashing.io/
Finalboard.io http://finalboard.com/
Commercial Applications: Finally, a number of online services exist that allow users to build online, browser based dashboards through drag and drop techniques, examples are:

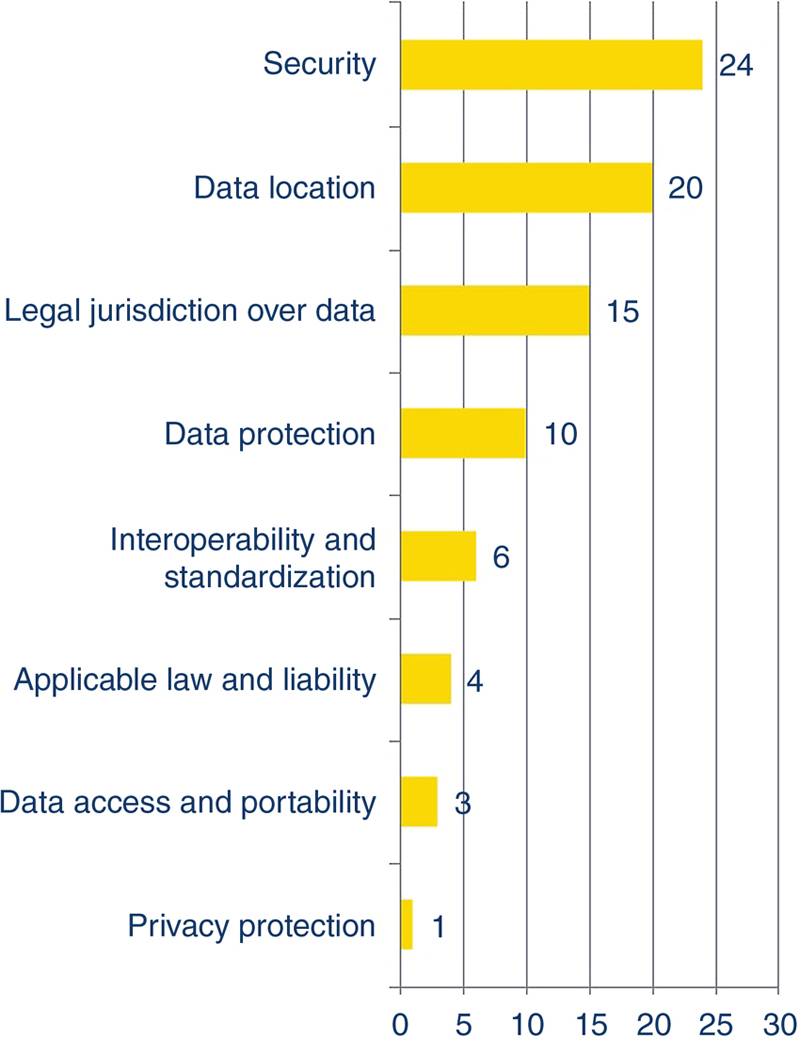
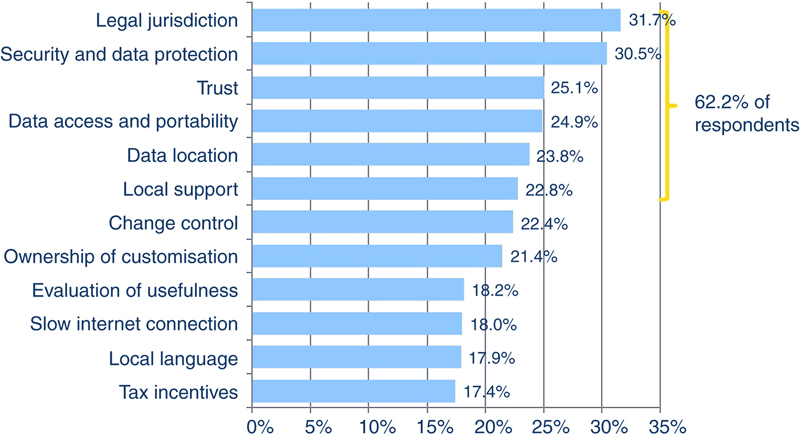
2.4. Security and Privacy Considerations

Security and privacy is of increasing concern in the deployment of IoT systems as they connect the physical world to the cyber world. We are all familiar with security issues in the cyber world and the thought of cyber security issues translating into the physical world is worrying. Gathering data from the physical world also creates privacy issues in terms of linking data to people and their activities, data ownership, access to data, and so on. Current security and privacy issues around IoT are due to their:
physically distributed nature
mixture of very small to very large devices
use of open or untrusted networks
large scale deployments, which may extend to tens of thousands of components
They also have complex attributes due to their system complexity and SoS nature, such as
different parts of the system may be created by different vendors (multiownership and multitenancy)
use and functionality changes over the duration of the system’s lifecycle
Table 5.4 outlines elements that should be incorporated at the development stage that is, security by design. Security needs a holistic approach from the physical up to network level and then service level authentication.

Table 5.4

EPN security considerations

Network aspects Other aspects
Firewall
Virtual private networks
Authentication
Key management
Device attestation
Runtime controls
Stack simplification
Integrity measurement
Data encryption
Data authentication
Physical aspects
Device-specific cert
Trusted Platform Module Platform Configuration Registers
Secure boot
Physical access

Table 5.5 outlines some of the many security standards that are used in wireless and wired communications and their applications. Any solution needs to be based on best practice incorporating aspects outlined in Table 5.4 and standards listed in Table 5.5. It can be arduous for domain actors in understanding the best approach when deploying an IoT system for their urban neighborhood.

Table 5.5

Communication/Data Security standards

Encryption standards

Triple-DES data encryption standard Symmetric-key block cipher, which applies the original Data Encryption Standard (DES), which is now obsolete, cipher algorithm three times to each data block.
Advanced Encryption Standard (AES) AES also known as Rijndael, is a specification for the encryption of electronic data established by the US National Institute of Standards and Technology (NIST) in 2001. AES is based on the Rijndael cipher developed by two Belgian cryptographers, Joan Daemen and Vincent Rijmen, who proposed it to NIST. Rijndael is a family of ciphers with different key and block sizes.
RSA Named after Ron Rivest, Adi Shamir, & Leonard Adleman at MIT, RSA s one of the first practical public-key cryptosystems and is widely used for secure data transmission. In such a cryptosystem, the encryption key is public and differs from the decryption key which is kept secret.
OpenPGP Pretty Good Privacy (PGP) is a data encryption and decryption computer program that provides cryptographic privacy and authentication for data communication. PGP is often used for signing, encrypting, and decrypting texts, e-mails, files, directories, and whole disk partitions and to increase the security of e-mail communications. It was created by Phil Zimmermann in 1991. PGP and similar software follow the OpenPGP standard (RFC 4880) for encrypting and decrypting data.

Wireless standards

Wi-Fi Protected Access (WPA) Wi-Fi Protected Access (WPA) and Wi-Fi Protected Access II (WPA2) are two security protocols & security certification programs developed by the Wi-Fi Alliance to secure wireless computer networks. The Alliance defined these in response to serious weaknesses researchers had found in the previous system, Wired Equivalent Privacy (WEP). WPA2 became available in 2004 & is a common shorthand for the full IEEE 802.11i-2004 standard.
WPA2/802.11i uses AES
A5/1 cell phone encryption for GSM A5/1 is a stream cipher used to provide over-the-air communication privacy in the GSM cellular telephone standard. It is one of seven algorithms which were specified for GSM use. It was initially kept secret, but became public knowledge through leaks and reverse engineering. A number of serious weaknesses in the cipher have been identified.

Transport Security

Secure Socket layer Cryptographic protocol designed to provide communications security over a computer.
Transport Layer Security Evolved from SSL cryptographic protocol used to provide privacy and data integrity between two communicating computer applications. Symmetric cryptography is used to encrypt the data transmitted

Aside from technical security, “privacy by design” should also be considered as a standardized practice. Incorporating privacy aspects at the data model level should help with appropriate data lifecycle management. Additionally, developing interfaces and mechanism for allowing users to tag data in intuitive ways could offer a means of mitigating uncertainty regarding privacy legislation which can be a barrier to investment in IoT infrastructure. While good practice in terms of data minimization, that is, collecting, storing, and processing only data strictly required for a task, and anonymity, that is, removing individually identifiable data where not required, should be considered. Also the level of granularity should be questioned for example, The City of Amsetrdam’s Energy Atlas project uses clustering as a means of protecting privacy will giving a suitable level of data granularity in order to be useful for services (http://amsterdamsmartcity.com/news/detail/id/186/slug/the-launch-of-the-energy-atlas-in-amsterdam-arena). Some relevant standards/initiatives (with varied degrees of adoption and/or recency) include:
P3P—is a protocol allowing websites to declare their intended use of information they collect about web browser users. Designed to give users more control of their personal information when browsing, P3P was developed by the World Wide Web Consortium (W3C). However, it is not widely adopted. (https://www.w3.org/P3P/)
XACML—the Extensible Access Control Mark-up Language together with its Privacy Profile is a standard for expressing privacy policies in a machine-readable language which a software system can use to enforce the policy in enterprise IT systems. (http://docs.oasis-open.org/xacml/3.0/xacml-3.0-core-spec-os-en.html)
EPAL—the Enterprise Privacy Authorization Language is very similar to XACML. It is a formal language for writing enterprise privacy policies to govern data handling practices in IT systems according to fine-grained positive and negative authorization rights. It has been submitted by IBM to the World Wide Web Consortium (W3C) to be considered for recommendation. (https://www.w3.org/Submission/2003/SUBM-EPAL-20031110/)
Open Authorization (OAuth)—OAuth is an authentication protocol that allows users to approve application to act on their behalf without sharing their password. (http://oauth.net/)
Open Web Application Security Project: top 10 privacy project—The OWASP Top 10 Privacy Risks Project provides a top 10 list for privacy risks in web applications and related countermeasures. It covers technological and organizational aspects that focus on real-life risks, not just legal issues. The Project provides tips on how to implement privacy by design in web applications with the aim of helping developers and web application providers to better understand and improve privacy (https://www.owasp.org/index.php/OWASP_Top_10_Privacy_Risks_Project)
Within the COOPERaTE project the information regarding these issues are foreseen within the NIM data model. The data model offers storing information about authorization and authentication. The actual control is left to the overall architecture which may reuse the aforementioned described standards.

2.5. Semantics, Data Models, and Ontologies of interest

Relevant semantic and ontology standards can be divided into those which support the modeling and deployment of knowledge in cloud-based systems, and those which capture knowledge regarding the built environment, energy and intelligent sensing domains. Within the former category the most relevant standards include—the web ontology language (OWL) (OWL, 2015), the resource description framework (RDF) (RDF, 2016), the SPARQL protocol, and RDF query language (SPARQL, 2015) (SPARQL) and the semantic web rule language (SWRL) (SWRL, 2016). These standards are ICT specific, they to not pertain to any given domain.
The existing standards which capture knowledge in the built environment/smart grid and intelligent sensing domains form a plethora of languages, data models, and taxonomies, towards a variety of different purposes, and within different parts of a broad domain. Semantic models of interest include the common information model (CIM) (International Electrochemical Commission, In Press), the industry foundation classes (IFC) (BuildingSmart, 2016a), the city geography mark-up language (CityGML) (CityGML, 2016), the smart city concept model (SSCM) (BSI, 2014) and the semantic senor network (SSN) ontology (Compton et al., 2012).
The CIM has been adopted by the International Electrotechnical Commission (IEC) (IEC, 2016), and aims to allow the interoperation of software in electrical networks by facilitating data exchange. The CIM is natively expressed as a universal mark-up language (UML) model, but further IEC standards define extensible mark-up language (XML) serializations of the model, to allow their federation into an RDF format (BuildingSmart, 2016b). This is relevant as it acts as a benchmark for information models within utility companies, and whilst it is arguably not sufficient for next generation smart grids, much can be learnt from the CIM.
The industrial foundation class (IFC) is the data model which facilitates open building information modeling (open BIM), and has been accepted as an ISO standard (BuildingSmart, 2016a). IFC was primarily developed to facilitate information exchange between the design and construction phase of buildings. It is based on the EXPRESS schema, but can also be expressed in XML (BuildingSmart, 2016b), and ongoing research is enriching the IFC to an OWL model (BuildingSmart, 2016c). This model is also undergoing development to describe data and concepts from the broader role of connected buildings within urban environments.
CityGML has foundations in the geospatial field, and facilitates the visualization and exchange of data at the city level (CityGML, 2016). CityGML is an extension of the geography mark-up language (GML) for the purposes of specifically modeling cities to various levels of detail, where GML is an extension of XML for the purposes of modeling geospatial data. Several domain extensions are under development for CityGML, to allow standardized descriptions of data related to various “city domains”, including utility networks. The smart city concept model (SCCM) is a conceptual model presented in BSI:PAS 182 (BSI, 2014), and outlines the concepts and relationships deemed most critical to the smart city field. The SCCM is somewhat domain neutral, in that it aims to remain a middle-level conceptual model, suitable for further development as the smart city modeling field matures. The SCCM also is not serialized in a normative manner; it is officially termed a “guide” rather than an actual model. Finally, the SSN ontology is an OWL model formalizing a language for the description of intelligent sensor networks, and utilizes significant abstraction and domain neutrality.
The energy efficient Building Data Model (eeBDM) community (https://webgate.ec.europa.eu/fpfis/wikis/display/eeSemantics/Home), is a European Commission (EC) supported community focused on semantic ontology development. The premise being that R&D focused on ICT integration and standardization will ultimately address interoperability issues between building subsystems, building to buildings and between buildings and other sectors, particularly smart utility grids (not just electric but also water, waste, heat/cool, etc…). It is envisaged that the introduction of ICT interoperability standards, models, and tools, that can consider all levels of complexity in energy management and optimization, will enable greater adoption of solutions.
Within the COOPERaTE project a meta model based approach is used in order to not enforce such a concrete standard. Moreover the ability to integrate the different data model standards is facilitated by the NIM.

3. The COOPERaTE Approach

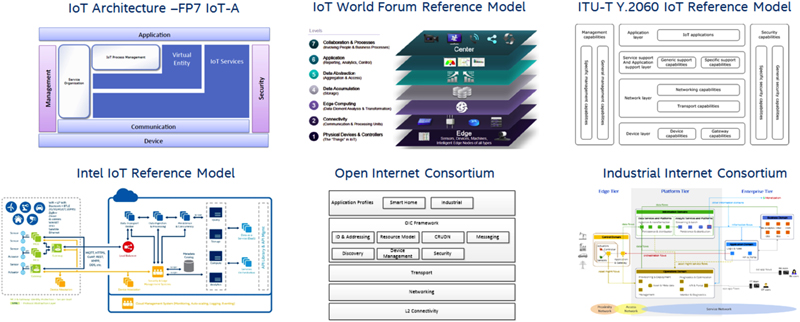
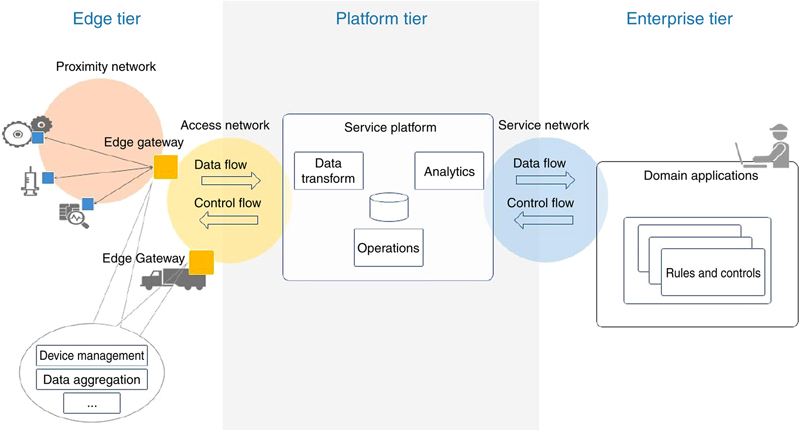
3.1. An End-to-End Reference Model
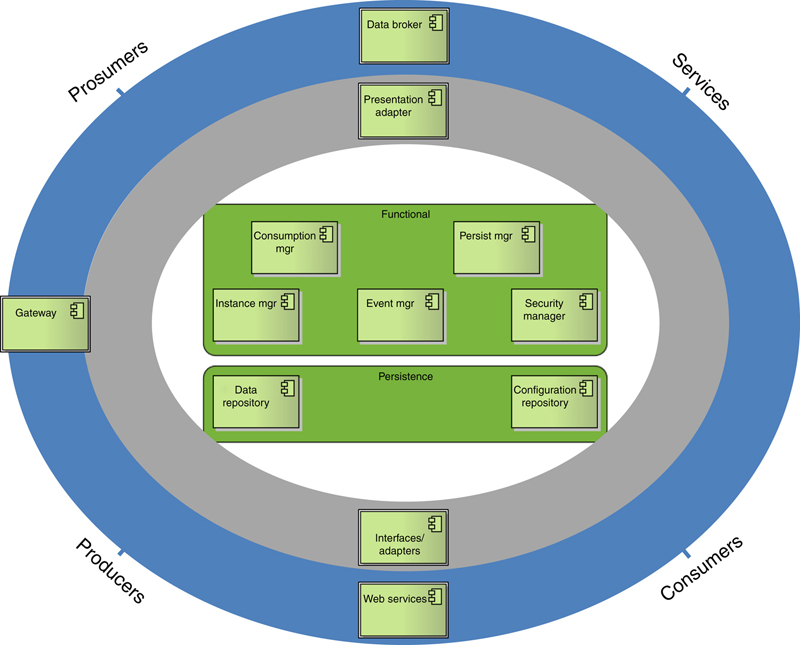
As was discussed in the inroduction and illustrated in Fig. 5.2 there are multiple IoT architectural options. All offer a reference in terms of end-to-end implementation and all to some degree focus on enabling data acquisition, aggregation, persistence, analytics, presentation, or visualization. What follows describes a logical view of the COOPERaTE reference architecture and its logical components. Fig. 5.9 shows an overview of the COOPERaTE architecture components and logical scopes. The architecture is based on a service-oriented system’s approach. From a technical perspective it could be a standalone platform offering services that can scale to the neighborhood level. In practice it is more likely to be a combination of existing systems that act in a transactional nature to deliver the range of functionality outlined in the architecture and required for neighborhood level services, the components outlined can be considered broadly reflective of those required within any architecture for delivering services at scale.
image
Figure 5.9 COOPERaTE Reference Architecture.
Logically the components can be grouped into several scopes as follows:
The Communication scope (blue ring) contains a broker, a web service component and a gateway focusing on message transport and management. This just means that some form of M2M communication is required whether that be publish/subscribe, RESTful or web-sockets based.
The Integration and presentation scope (grey ring) contains a presentation component and an interface/adapter component focused on integration of external systems and on ensuring consumers, producers, and services can interact with the COOPERaTE services. For example, the gateway component straddles this scope and contains the required adapters and interfaces to communicate with the underling physical systems, in the case of a home environment this could be Z-Wave or Zigbee based or in a commercial building system it may be OPC based. Essentially the blue and grey rings mean that services, prosumers, producers, or consumers connect via a gateway, web service, or broker to the presentation layer or adapters, to access any of the components in the circle. This is consistent with the proximity and access network description of Section 2.
The Functional scope focuses on logic and service and management components that is, platform tier of Fig. 5.5.
The Persistence scope focuses on efficient data storage and retrieval, again the platform tier of Fig. 5.5.
The security manager is listed as a functional component, but of course it is in practice a horizontal that is managed by an instance in each cooperating system of the SoS.
Each externally facing service defines the message types it can accept. In the case of COOPERaTE such services will conform to the NIM and/or subscribe to a NIM service (Section 4). If one service wishes to communicate with another service it must send a message which meets the requirements of the service which will receive the message or utilize a NIM or similar service that is cognizant of the underline systems data model.
Components are references and in practice the cooperating systems of the neighborhood host the required functionality while participating in NIM (or similar) enabled neighborhood wide services. Table 5.6 lists the COOPERaTE architecture components.

Table 5.6

COOPERaTE architecture components

Component Presentation Adapter PADT
Functionality The presentation Adapter allows targeted adapters for specific consumption clients. There may be several types of PADT and each PADT may have several Instances configured differently.
Component Consumption Mgr CMgr
Functionality The CMgr provides the initial default access point to the system for Actors/consumers. The consumption Mgr will manage and ensure best fit for consumers and presentation adapters.
Component Event Mgr EMgr
Functionality The EMgr facilitates the communication between components via messaging mechanisms negotiating service contracts. In essence it is responsible for event propagation, initial message route configuration and queuing. The EMgr is not involved in the actual communication between components but rather routing.
Component Security Mgr SMgr
Functionality The SMgr is responsible for ensuring authentication and authorization and integrating security provided by individual components within each layer.
Component Instance Mgr IMgr
Functionality The Instance Mgr is a component to manage the life-cycle of logic/adapters / interfaces instances and their configuration. It handles the initialization of adapters and logic components and the component instances with their corresponding configurations.
Component Persistence Mgr PMgr
Functionality The PMgr is responsible for storage, long-time archiving, retrieving and deleting of any kind of data. Accordingly, it allows access to all persisted configuration and historical data, which are stored respectively in the configuration and data repositories.
Component Data Repository DR
Functionality The database component provides historical data. Historical data is collected data in the past. This data could be results from the event processing or raw data (but not limited to these). Basically, the DR is used for pattern mining and other analysis
Component Configuration Repository CR
Functionality This component maintains Configuration data, which includes all data necessary to configure the internal components of the COOPERaTE system including COOPERaTE consumer profile information.
Component Interfaces/Adapters IA
Functionality Adapters support receiving notifications, events or data from external systems devices as well as querying of same. It is possible to forward data and trigger actions to external systems. Each adapter provides an interface that allows another Layer to query for data from external systems. Several types of adapter and several instance of each adapter type may exist.
Component Data Broker Br
Functionality The purpose of the Br is to deliver content/messages to the consumers that is actors or systems components.
Component Gateway G
Functionality The G component is responsible for providing a subset of the COOPERaTE system functionality but on a compute constrained device. The G will be utilized with respect to edge v cloud processing or rather a compute-centric approach whereby compute processing occurs where most appropriate.

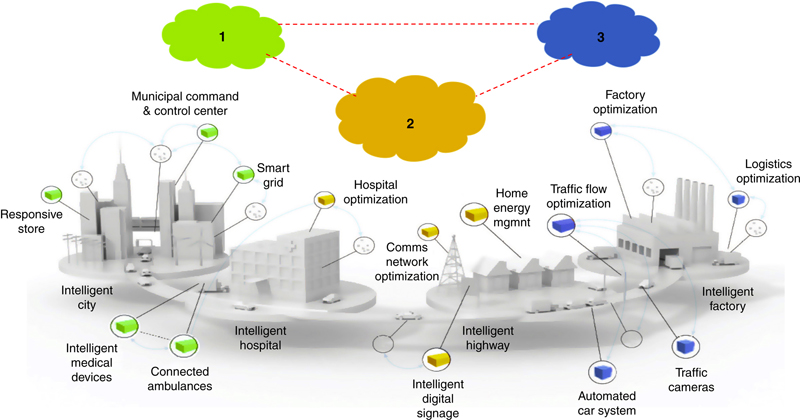
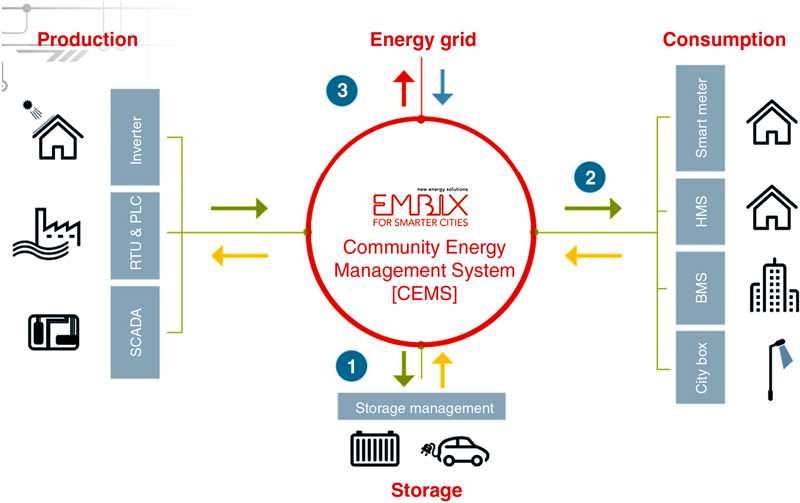
3.2. A System-of-Systems Approach

An EPN is challenged with integrating the many local monitoring and control functions prevalent in urban neighborhoods with the power, flexibility, and scalability of cloud computing platforms in order to delivery energy and other valued services at the district level. This level of scale, Heterogeneity and multiownership is significant and is why end-to-end system approaches, such as those referenced in Section 3.1 are unlikely to be adopted. An EPN must acquire, aggregate, analyze, and act on data from disparate and dispersed sources, but must always do so on the basis of agreed cooperation from system owners. Hence an EPN must have ICT systems that allow for federation of information set against a hybrid-cloud landscape whereby public and private clouds, remote hosted and on-premise, can exchange data, while at the same time ensuring data privacy and security is maintained. In this regard, the overarching premise posited by COOPERaTE is that by

“allowing for interoperability at the data level and by leveraging existing solutions via common communication interfaces, one can produce a loosely coupled integrated solution that goes beyond the current state of the art and which is likely to be adopted given an existing brownfield reality”.

This is defined as a “System-of-Systems” (SoS) approach. This approach allows systems to both act independently and to interoperate based on an agreed semantic meaning. The COOPERaTE Neighborhood Information Model (NIM) (Look & Greifenberg, 2013a) is an example for achieving such common semantic meaning. The SoS approach is pragmatic in addressing barriers to adoption due to ownership, control, security, and privacy concerns within and across districts. The approach ensures flexibility whilst minimizing impact as individual downstream systems retain decision making capability that is, these systems may or may not take action based on suggestions provided upstream by NIM enabled logic. This approach is effectively a recommender system whereby recommendations are subject to associated business/service level agreements. Fig. 5.10 illustrates the SoS scenario whereby different systems control different physical assets within a neighborhood. Information regarding these different assets maybe required for EPN level services. However, there is often a reluctance to share information and more understandably an averseness to allowing any external system control those assets. Therefore the approach proposed here is to allow for federation of data and information whereby the existing systems continue to execute their established control and have the degrees of freedom to implement any aspect of the technologies discussed in Section 2. However, more importantly from an EPN perspective an approach that offers such systems the opportunity to cooperate in a neighborhood level process, by opting to carry out recommendations. The “red dashed line” of Fig. 5.10 represents the NIM type service, which is a proposed means of permitting this cooperation to happen. The NIM is presented in the following section.
image
Figure 5.10 System-of-systems (SoS) approach to EPN.

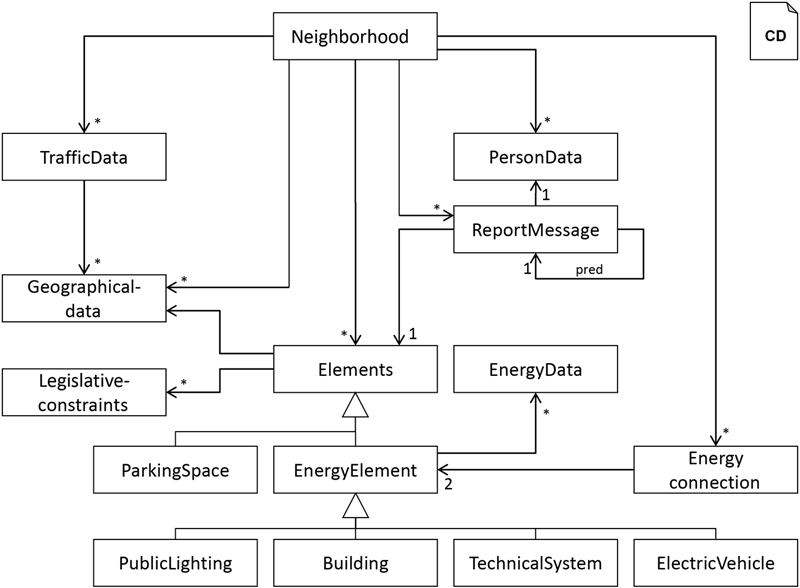
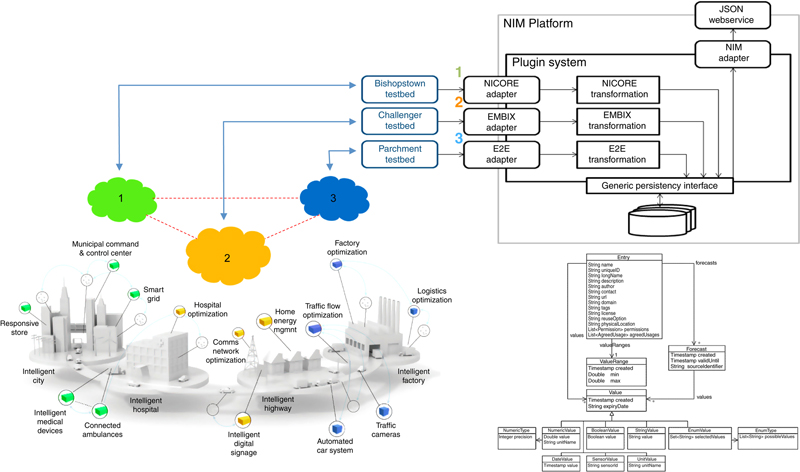
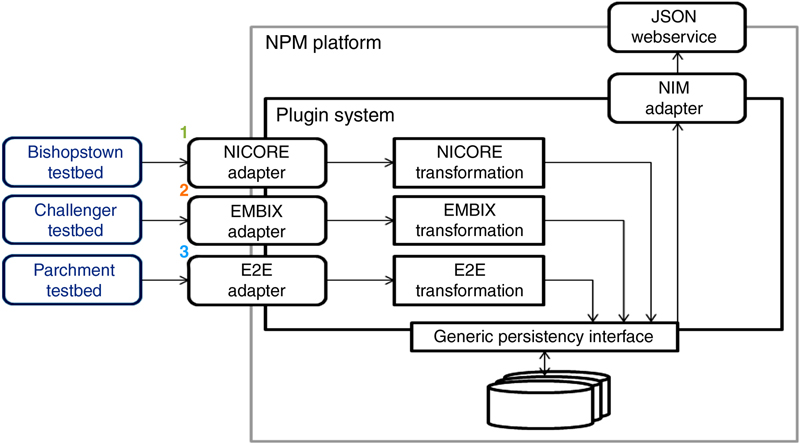
4. A NIM Enabled System-of-Systems

4.1. Overview

The approach adopted in the COOPERaTE project in realizing a SoS was to focus on semantic interoperability at the data and service level, rather than insisting on a single standardized system architecture with selected M2M communication standards. The concept of the Neinghborhood Information Model (NIM), the integration of heterogeneous data models, the security and privacy issues as well as a prototype implementation has already been discussed in (Greifenberg, Look, Rumpe, & Ellis, 2014).
In the previous chapters the existing technologies, data models, and protocols for devices, neighborhoods, buildings, or M2M communication have been presented. Here the focus is on the integration of existing heterogeneous data models into a common data model that can be used by all participants, such as users, services, or sensors. This integration of heterogeneous models is necessary, since a holistic approach to model every aspect of a neighborhood is unfeasible. There has been put a lot of effort into the creation of ontologies for different parts and components of buildings and neighborhoods within the eeSemantics Community. (eeSemantics (Login required), 2016). These ontologies can be used as specific data models. If the features of the data model do not suffice, that is, due to new requirements, it has to be extended to a new version of the ontology. This leads to a plethora of different data models and extensions that cannot be integrated into a unified data model since this would also require extensibility and would therefore have the same problems.
The neighborhood information model (NIM) (Look & Greifenberg, 2013a,b,c) aims at solving these issues. It has been developed following a metamodel based approach. Relying on a metamodel makes use of its generic character and is easily extendible at runtime and is able to integrate heterogeneous data models. For the integration a Domain Specific Language (DSL) is used to define a mapping between the NIM elements and the data model to be integrated. Furthermore, we make use of generative engineering techniques in order to generate adapters between different data models. Thus, the NIM allows for semantic interoperability of different systems via data model integration. Albeit being rather generic, the NIM makes a distinction between different types of data that is stored and exchanged.
These data types include:
Measured sensor data that changes frequently, close to real time, stored as time series data.
Infrequently changing data, that provides information on systems in a building or a neighborhood.
Non-changing, constant data, that does not change, such as latitude and longitude of a neighborhood.
Apart from the different types the data may be historical, real-time or forecasted. The sources of the data include measurements, third-party services or simulation services. Metadata, such as the source of the data and different value ranges are also allowed. By using the DSL, defined by a context free grammar, small simple chunks of the different data models are easily described. This description can be reused by other models. Overall, data of the described data models, used in a neighborhood can be integrated into the overall NIM. The concept of DSLs is a well established instrument in model based software engineering to enable the expression of domain knowledge by experts. The DSL puts domain specific concepts into the foreground while simultaneously creating a formal description of each used data model within a neighborhood. Thus, the complete data of the neighborhood can be integrated. This enables the development and implementation of value-added services since they are able to access the complete neighborhood data. As said before, the models are used as input for code generators generating concrete adapters from the more abstract mapping descriptions. The extension at runtime is dome, by simply adding a new model to the set of existing models and by generating a new adapter between the involved data models. Thus, the new data can be transformed into already existing and vice versa. Introducing a NIM to a new neighborhood can be done quickly, by describing the existing data models, automatically inferring them from different standards or reusing already existing models of a different neighborhood. By packaging the existing models into libraries this be enhanced even more. Apart from the integration of existing data models the implementation of new value-added services at the SoS level follows a similar approach as shown in Section 5.
The employed model based and generative software engineering techniques, such as the aforementioned DSLs (Fowler, 2010) are created with the MontiCore framework (Krahn, Rumpe, & Völkel, 2010). MontiCore processes context free grammars as language definitions and creates a DSL out of them. To achieve this, MontiCore generates necessary infrastructure, such as a parser, a prettyprinter, editors, context condition checking support and code generation capabilities (Völkel, 2011). For implementing the code generators, generating the adapters the template engine freemarker is used. While the DSL provides an abstraction from a technical to a domain problem space the code generator provides the transformation back from the domain to the problem domain space. The designed data model DSL within the NIM approach follows a set of other languages provided by MontiCore, namely the UML/P (Rumpe, 2011Rumpe, 2012Schindler, 2012), a slightly modified derivate of the UML (OMG, 2011).
As stated before, the code generation transforms the domain problem space back into the technical problem space by creating technology specific source code out of the model. As target platform in the NIM Java is used to provide a prototype implementation for the COOPERaTE project. While creating a code generator and defining a DSL typically requires a lot of effort it is worth it, since the DSL can be used in different neighborhoods with different requirements and scenarios. The effort for creating a DSL and code generators can be reduced if certain guidelines are followed (Karsai et al., 2009).

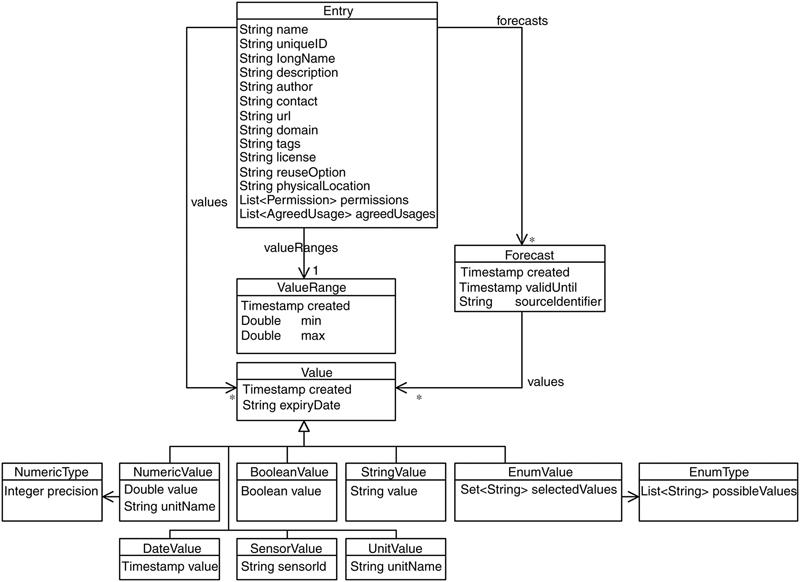
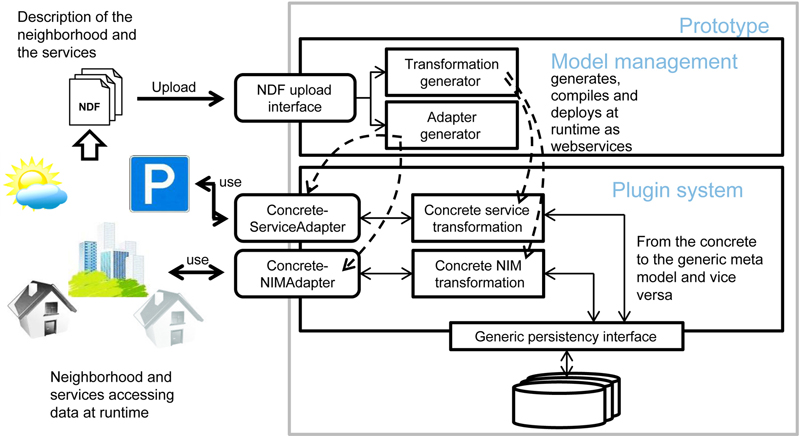
4.2. Technical NIM Description

The design of the NIM makes use of two different information sources. In (Pesch et al., 2013) requirements of an EPN based on identified use cases were presented and taken into account during the NIM design. Furthermore, the design of existing data models within the building domain (Corrado & Ballarini, 2012) has been analyzed and the outcome included in the NIM design. The NIM design aims at providing a common data understanding of the complete neighborhood to enable value-added services to be implemented inside an EPN. The prototype NIM implementation uses this flexible approach going beyond simply using a fixed integration model since extensibility of the platform and the therefore the service landscape of the EPN is important and necessary. The concrete data model providing available data fields is detailed in the following. Consequently the abstraction of the aforementioned concrete data model used as COOPERaTE domain model is shown. After that, the DSL and the code generators are introduced.
The concrete data model is an extension of the SEMANCO data model (Corrado & Ballarini, 2012). The SEMANCO data model is a basic ontology for newly implemented services. It was extended by additional categories. These categories, as well as additional entries and data model details can be found in the COOPERaTE project Deliverable D1.2 (Look & Greifenberg, 2013a). Fig. 5.11 shows that the neighborhood element is a composite element that consists of several other elements.
image
Figure 5.11 Concrete data model. (Greifenberg, T., Look, M., Rumpe, B., & Ellis, K. (2014). Integrating Heterogeneous Building and Periphery Data Models at the District Level: The NIM Approach. In: Proc. 5th Workshop on eeBuilding Data Models (eeBDM) (part of 10th European Conference on Product & Process Modelling (ECPPM) 2014). Vienna, Austria).
The information persons, geographical information, energy grid connections, reports, and traffic have been added due to the requirements shown in Deliverable D1.1 (Pesch et al., 2013). This information is modeled as a subclass hierarchy of the Elements class. Further information, such as energy data, public lighting, building, technical systems, parking spaces, energy elements, and electric vehicles are contained in the model. The energy grid connection links to two energy elements in order to store necessary information on energy connections in the neighborhood. Such a connection information is needed when thinking about scenarios where there is no underlying grid but direct connections.
In the background a meta model is used to integrate the heterogeneous data entries from different existing data models into the NIM. This generic model is the underlying basis to the aforementioned concrete NIM. The generic NIM, as shown in Fig. 5.12 consists if several NIM-Components which make use of a composite design pattern (Gamma, Helm, Johnson, & Vlissides, 1994). These components are divided into entries and categories, where the latter can contain other components. A link relation can be established between categories to support cross referencing between categories. Additionally, privacy enabling files and metadata, such as a unit and a name are included. An entry may have different information on values can be stored: values, forecast data, meta information, value ranges, and historical data.
image
Figure 5.12 A UML class diagram detailing the generic NIM. (Greifenberg, T., Look, M., Rumpe, B., & Ellis, K. (2014). Integrating Heterogeneous Building and Periphery Data Models at the District Level: The NIM Approach. In Proc. 5th Workshop on eeBuilding Data Models (eeBDM) (part of 10th European Conference on Product & Process Modelling (ECPPM) 2014). Vienna, Austria).
As mentioned earlier a value might be calculated, measured, or manual inserted into an entry. Timestamps are used for the values where the actual value of an entry shows the most recent timestamp. Older values are available too and are considered as historical data available for an entry. The value field in the value element stores the value itself. Data, that a said to be present in the future at a given timestamp is called Forecast data modeled as an explicit element in the NIM. This is different from the historical data that is inferred by the timestamps. For Forecasts this is not possible since there should be multiple forecasts regarding the same point in time available. This enables that each forecast is stored separately together with its source that differentiates different forecast sources by an identifier. Upper and Lower bound of valid values are stored by value ranges.
Security aspects concerning the data are directly built into the model. Such aspects include that only authorized users or systems may access or store other users or systems data. Furthermore, forgetting a value is enabled by introducing an “expiry date” for each value. This field should be used to delete expired data. This is especially important since historical data is stored. In order to not keep the data forever users and systems can mark the data as expired in order to specify the lifetime. Additionally the “agreed usage” field has been introduced as additional information. This field describes the entities that might use the data. Therefore, it should be checked, if an accessing person, service identifier or role is contained in the field. A list of all possible users is not possible in a neighborhood setting. Thus, role based access control (RBAC) is used to assign the same role to several users. The roles can be used within the “agreed usage” field.
The “physical location” field is also embedded into the data model as a security mechanism. It specifies the geographical location where the data entry might be stored. Due to legislative constraints this information may become necessary in order to be compliant. This field can be used by, for example, data centers to determine the actual physical storage place. Apart from providing necessary information to storage provider it can also be used by users to decide which information should be uploaded to a platform which uses the NIM as data format.
The claimed adaptability and extensibility required a mechanism that enables the overall system to store data unknown beforehand. Due to its generic nature the data model supports this by transforming the data into the meta model. This leads to the drawback that the data model, developers have to use for their implementation is quite generic, does not provide type safety and is in general very inconvenient. Also data from other data models has to be transformed into the meta model leading to a huge manual implementation effort, if done for each data model within the neighborhood. Additionally, this extension would not be possible at runtime of the system. As a solution a plugin based architecture has been used within the NIM implementation. This architecture allows the addition of new plugins at runtime. Furthermore, the plugins are generated by a code generator using models of the previously mentioned DSL as input. The code generation, as well as compilation and plugin instantiation is done at runtime. The transformation from a data model into the meta model is put into the generated code.The DSL is used to create models that describe concrete NIM data models in a NIM data format (NDF). This NDF describes a data format not actual data. Fig. 5.13 shows the overall approach and methodology to configuring the running prototype.
image
Figure 5.13 Plugin based implementation of the NIM. (Greifenberg, T., Look, M., Rumpe, B., & Ellis, K. (2014). Integrating Heterogeneous Building and Periphery Data Models at the District Level: The NIM Approach. In Proc. 5th Workshop on eeBuilding Data Models (eeBDM) (part of 10th European Conference on Product & Process Modelling (ECPPM) 2014). Vienna, Austria).
The prototype implementation consists of a Model Management component and the Plugin System. The Model Management component processes the NDF models and generates new adapters containing new transformation code. The Plugin System incorporates the overall system that is used by services and neighborhood elements for accessing the data. Three steps are necessary to connect new participants, such as a new neighborhood or a new service to the platform(Greifenberg et al., 2014). First the NDF model has to be created in its textual syntax and uploaded to the system. Analysis and context condition checking is done by the Model Management component. If it is valid, it is passed on to the transformation and the adapter generator which in turn generate the necessary transformation and plugin code. After generation the plugin is automatically deployed and made accessible. In a second step the newly connection service or neighborhood may use the adapter for operating on the defined data Model. In the third consecutive step the data is transformed between the concrete data model and the generic data model. Again, this is threefold: first the transformation from a concrete to the generic data model is considered which is relatively straight forward. A “Room” element would become a category with name “room” in the generic data model. The name of the room would be represented by an entry contained in the category. This entry has the name “roomName”. The actual name of the room, not present in the NDF since it defines a data format, but available in the uploaded data, becomes the value of the entry. The NDF allows the definition of hierarchical data types within other data types which can be reflected via the composition pattern used inside the categories. The second case is the transformation from the generic data model back to the concrete data model. If the meta model data belongs to the concrete model it should be transformed, this is straight forward and simply the inverse of the previously described first case. The third case is the most complex one and reflects the transformation of data from different concrete models. This is probably the most common case since this reflects interoperability between services. For a service requiring data about buildings from two existing services, there are two possibilities:
Making use of the already existing adapters and collect the data separately.
Describing the desired data in its own NDF containing a mapping.
Figs. 5.14 and 5.15 provide a high level depiction of the role the NIM plays in integrating cooperating neighborhood management platforms within the COOPERaTE project prototypes and their associated services. The NIM is implemented here as a service, providing a demonstrator platform and a common data format, which is applied to data from the 3 COOPERaTE demonstration sites (neighborhoods). Alternatively, a platform could implement a NIM compliant adapter/parser, which simply means that data made available via their API would be made available in NIM format. Here the NIM acts as a standard data exchange service.
image
Figure 5.14 NIM acting as a translation service for 3 cloud based neighborhood management systems.
image
Figure 5.15 Integrating heterogeneous platforms and services.
The data made available via the NIM was used in what was essentially an abstraction service (Fig. 5.16) whereby the NIM was used to translate between different cooperating systems data models/formats. As such, one can appreciate how energy services developed and implemented within the three cooperating platforms (Section 5) can by complying with the NIM enable the project use-cases, namely:
near-real-time (NRT) monitoring
run day ahead forecasts of electrical/thermal consumption
run day ahead forecasts of renewable sources, such as PV and wind power
optimize the power purchase versus on-site generation
use the neighborhood flexibility to participate in DR programs
image
Figure 5.16 Multiplatform services enabled via NIM.

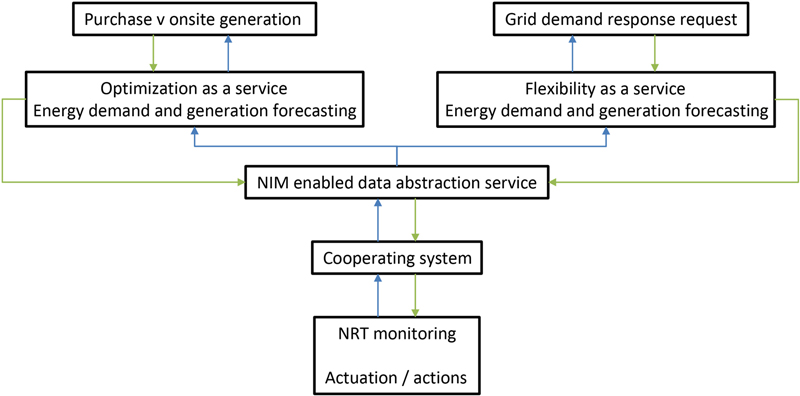
5. Example Neighborhood Services

A number of example energy management and decision support services were adapted and/or developed in the COOPERaTE project based on a prototype implementation of the COOPERaTE architecture and the NIM service. The services were implemented within the three test-bed environments available in the project, the CIT Bishopstown Campus (commercial neighborhood), the Parchment Square student village (residential neighborhood), and the Bouguyes Challenger Campus (industrial neighborhood).

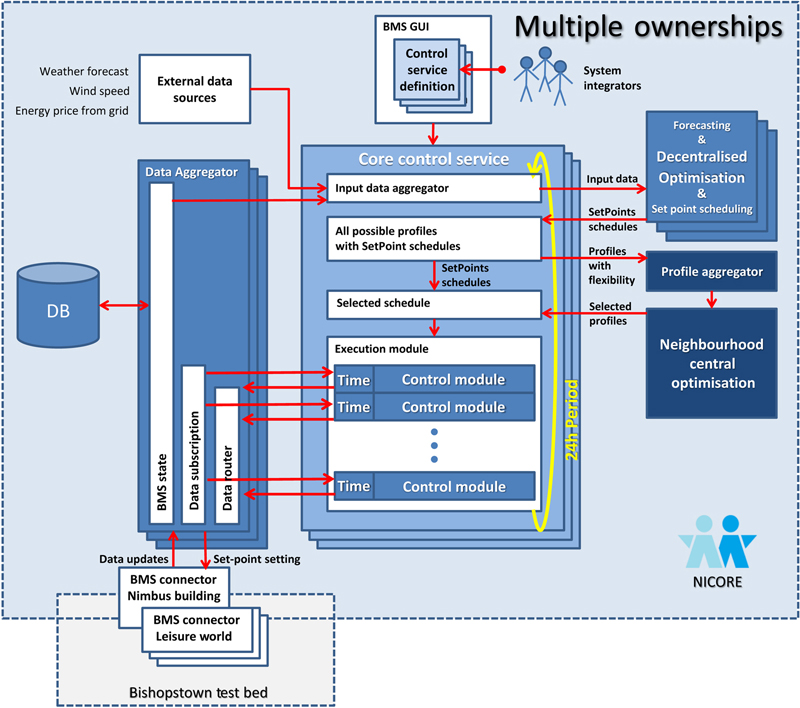
5.1. Energy Services—Commercial

The COOPERaTE energy services deployed for the CIT Bishopstown Campus neighborhood were implemented on the CIT NICORE IoT application enablement platform (McGibney, Beder, & Klepal, 2012). These services are a set of reusable software components that are run in NICORE. These services facilitate implementation and execution of neighborhood energy management and forecasting algorithms, usage scheduling, and setpoint profiles, as well as forecasting and estimation algorithms. The energy services address the neighborhood energy management services that were identified by the COOPERaTE consortium (Pesch et al., 2013). Three main enabling prototype services supporting real-time monitoring and actuation have been developed within NICORE, namely:
a Building Management System (BMS) Connector service
a Core Control service
a Data Aggregator service
Figs. 5.17 and 5.18 show the NICORE energy services for the two main usage scenarios for example, the single-owner and multiowner case. Fig. 5.19 illustrates the Command module.
image
Figure 5.17 Control service in single ownership neighborhood scenario.
image
Figure 5.18 Control service in multiple ownerships neighborhood scenario.
image
Figure 5.19 Command Module.
The BMS Connectors service acts as an interface between each embedded building monitoring and control system and the NICORE platform. In the Bishopstown test-bed, there are two interfacing technologies used by the respective BMS, (OLE for Process Control) OPC, or web services. Both technologies provide read/write capabilities thus enabling the reading of and controlling of BMS states. When a BMS Connector receives a BMS state from a BMS, OPC, or web service interface, it requests provisioning of a Data Aggregator instance from the NICORE platform manager in the cloud. The Data Aggregator caches the BMS state, forwards the state updates to the subscribed Control Modules of the Control Services and store changes in a database.
In addition, a number of Forecasting and Optimization Services were developed and provided by neighborhood and building system integrators. These services are uploaded to the NICORE platform Service Repository and instantiated on the request of a Core Control Service in the cloud. The Core Control Service is the central component of the NICORE energy services. There can be multiple Control Services in a neighborhood system. For example, if two BMS subsystems in a building were to be optimized independently, two separate Core Control Service instances would be created to execute their control tasks independently. More often, however, in the case of the single ownership neighborhood only single Core Control Service is required to run and act on the results of the Centralized Neighborhood Optimization. In the case of the multiownership neighborhood, a separate Core Control Service is required for each of the Decentralized Optimizations additionally to the Neighborhood Central Optimization, Fig. 5.17.
The operation process is the following:
1. Based on a Control Service Definition provided by the Neighborhood System Integrator, the Core Control Service interrogates the Data Aggregator and External Resources for input data for the Neighborhood Forecasting and Optimization component.
2. Optimization returns set point schedule for each building equipment (for the next 24 h with 15 min interval, for example), upon which the Core Control Service instantiates a new Execution Module.
3. The Execution Module processes the received schedule into a sorted sequential list of Control Modules, which are sequentially executed at scheduled time. Each Control Module (Fig. 5.19) contains a list of Commands and list of Conditions.
4. Each of the commands contains single set point specification and a reference to a Calculator which calculates the set point value based on the current BMS state. The calculated set point value is then sent to the BMS Router which forward it to the right a BMS Connector.
5. The set of Conditions in the Control Module insures that the certain BMS state is achieved after applying the set points and that all the Conditions are met before moving to the next Command Module in the sequence. The Conditions are evaluated in an Evaluator and they have to be met within a predefined maximum waiting period.
When all Control Modules are successfully executed (after 24 h, for example), the Core Control Service repeats the new operation process starting from the point 1 again.
In the case of a multiownership neighborhood there is a Core Control Service running at every separately owned premise of the neighborhood. The overall system architecture and the Core Control Service were designed with reusability in mind when the same Core Control Service together with all other services can operate in both single and multiple ownership scenarios. In the multiple ownership case, the Core Control Service requests a full list of possible set point schedules from the Decentralized Optimization. It then anonymizes schedule profiles and forwards them to the neighborhood Profile Aggregator, which collects all schedules from the neighborhood before the Neighborhood Central Optimization selects the best schedule profile for each owner. The Core Control Service discards all schedules but the selected one and the operation process continue the same way as in the single ownership neighborhood scenario.

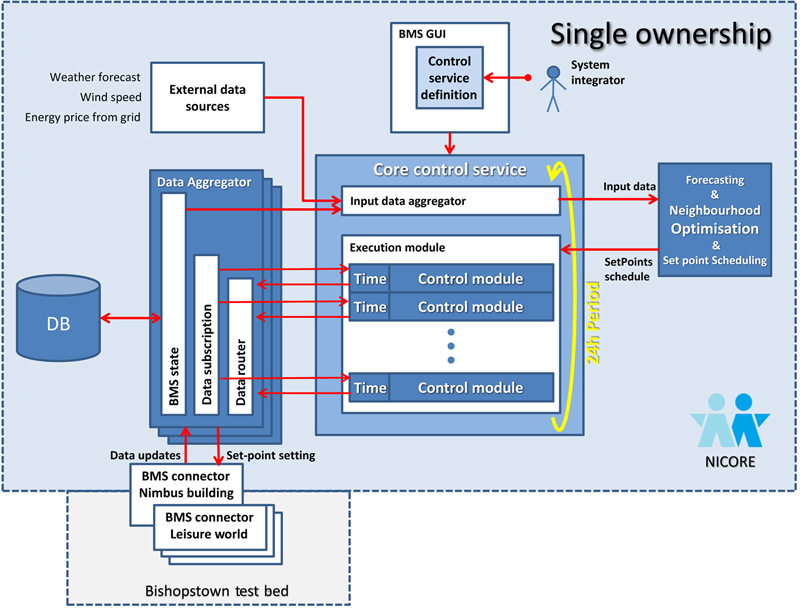
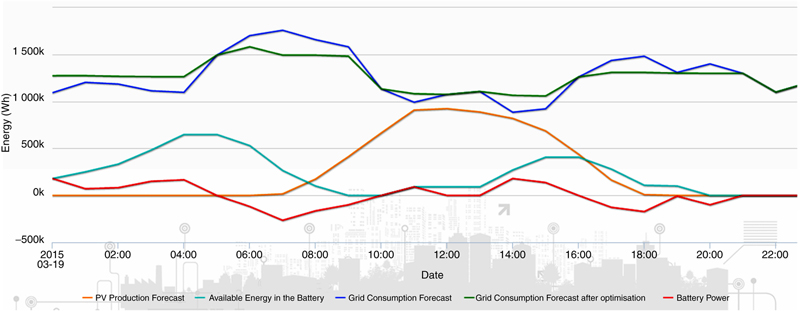
5.1.1. Forecasting Services

For the forecasting services a number of key energy performance related variables, for example, thermal and electrical loads, indoor temperatures, microgrid power generation and so on, can be forecasted based on available historical and weather data ranging from a few hours to days or years. In the COOPERaTE project the following variables were considered for example:
Thermal loads
Electrical loads
Building Indoor temperatures
The forecasts can be obtained by the building and neighborhood energy managers on request or implemented in real-time in the NICORE platform to support energy optimization services based on the architecture given in the previous section. For the NIMBUS and Leisure World buildings of the COOPERaTE Bishopstown demo-site, the day-ahead forecasts are obtained by using previous day historical data of the electricity and thermal power consumption, indoor temperatures, and outdoor weather data (such as outdoor temperatures and wind speed). The forecasting algorithms allow for, the period of the prediction, as well as the range and period of historical data, to be selected by the system integrator. The forecasts can also be utilized by the energy optimization and DR services (described later) for the coordination and management of the optimal profiles, schedules and setpoints of the neighborhood and building electrical and thermal assets (thermal storage, batteries, energy microgrid).

5.1.2. Optimization Service

The Optimization service developed addresses both types of single-owner and multiowner neighborhoods. The objectives of the optimization service can vary between:
Whole neighborhood energy cost optimization (electricity and thermal bill)
Whole neighborhood CO2 emissions optimization
Combination of the aforementioned objectives
It can also be used to address both the building-level energy optimization and neighborhood energy optimization scenarios. The optimization service aims to optimize the neighborhood power purchase versus on-site generation, taking into account prices, current measurements (from the real-time monitoring service), load and weather forecasts (from the forecasting service), and provide predictions of the on-site neighborhood generation over a period of time that can meet the neighborhood objectives aforementioned.
For the single-owner case, the service uses single-owner optimization to collectively optimize the optimal profiles, schedules, and setpoints of the microgrid and thermal system assets of the neighborhood. In this prototype service, the objective of the optimization service has been set to optimize the overall neighborhood energy cost. The service can be used in two ways:
as a service to the neighborhood or building energy managers to determine the optimal power and energy generation of the neighborhood for a day or longer period time, or
as a real-time optimization service that automatically sets the optimal profile and setpoints of the neighborhood assets. It can also be used to determine the neighborhood or buildings flexibilities for example batteries and microgird generation profiles.
For the multiowner neighborhood type where data privacy issues between the various owners of buildings and distributed energy sources (including district renewables, district-level generation etc.), the energy service utilizes multiowner neighborhood optimization. It receives the flexibilities (a number of generation, storage, and renewable profiles) from each building or district power generation owner/user and determines the optimal selection of power generation and consumption profiles for the neighborhood that both optimizes the global neighborhood and individual actors benefits simultaneously. The objective chosen for this prototype example was the whole neighborhood CO2 emissions reduction but equally the overall neighborhood energy cost could be selected. The service is offered to the neighborhood energy manager and building facilities managers to determine the optimal power and energy generation of the neighborhood and buildings respectively. Finally, the energy service can be offered for the energy optimization of each individual building. Currently the energy optimization service has been implemented and demonstrated in the CIT Bishopstown demo-site.

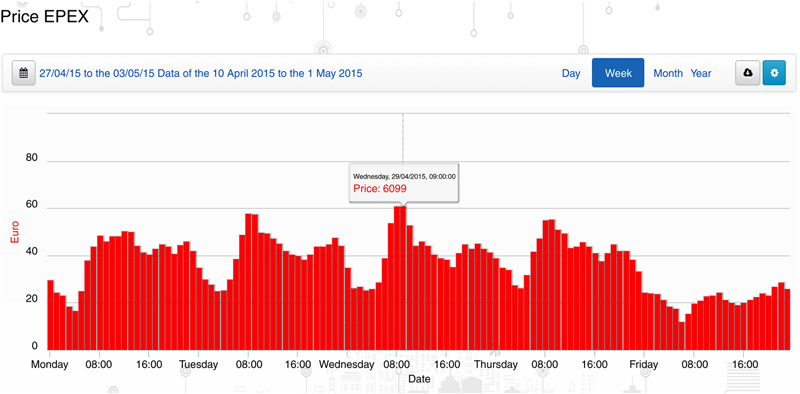
5.1.3. Demand Response Service

A DR service was created by using an external data sources interface. The external data sources interfaces to a number of external date relevant to neighborhood energy management including DR, such as real-time energy prices from an aggregator or grid operator and weather forecasts including wind speed and solar irradiation measurements and forecasts. Typical external data sources for the Bishopstown test-site are the Single electricity Market Operator (SEMO, http://www.sem-o.com) web-site sources and the Met Eireann (www.met.ie) and Weather Analytics services (www.weatheranalytics.com) for weather data and forecasts. In this case the control service interrogates the external resources as well as the data aggregator (similarly to step one of the operation process described previously) for input data related DR. such as real-time energy prices that can be used in a DR scenario.

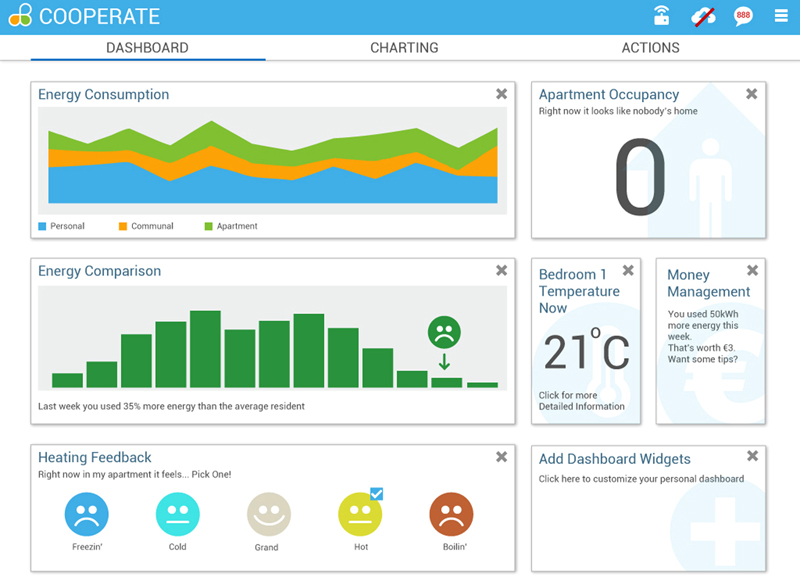
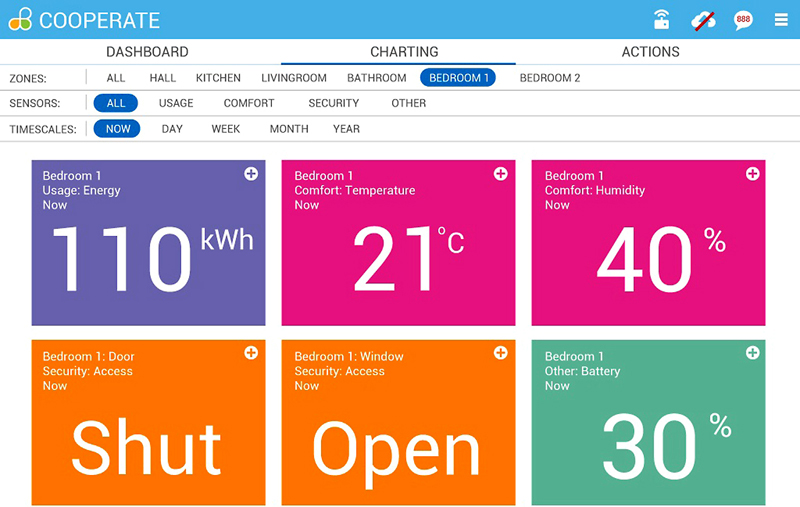
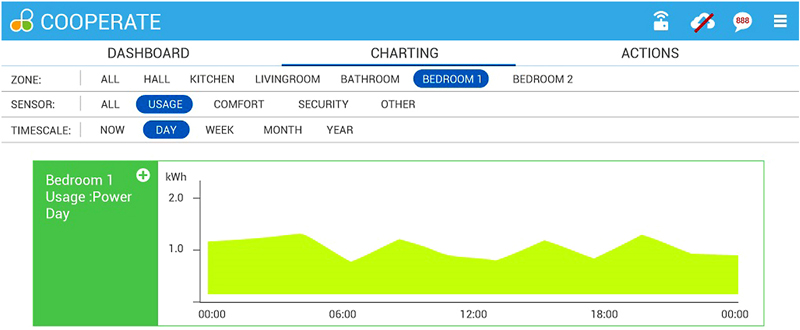
5.1.4. Visualization Service

A data aggregator management GUI has been implemented on NICORE for the visualization of the various data point in the individual BMS and neighborhood systems (Fig. 5.20). The data aggregator management GUI connects to the NICORE middleware and provides a list of all available data points. The available data points are listed on the left-hand side of Fig. 5.20 and the data point reading history over a period of time is presented in a graph on the right-hand side.
image
Figure 5.20 Data aggregator management GUI.

5.2. Energy Services—Residential

This section details services implemented for an apartment complex in the Bishopstown test-bed, Parchment square. The section elaborates on how these services address the COOPERaTE use-cases. More generally the section illustrates the enabling impact an IoT based energy management system can have in residential environments with respect to demand-side management (DSM) and DR.
In the absence of any monitoring and/or control technology an end-to-end system was deployed to support DSM and DR services, Sections 5.2.2 and 5.2.3. The solution deployed precedes and partly aligns to the Intel IoT reference model and utilizes many of the same commercially available assets. The Intel IoT reference model is an end-to-end reference model and family of Intel products that works with third party solutions to provide a foundation for connecting devices and delivering trusted data to the cloud. The reference model consists of an “edge” gateway platform (left of Fig. 5.21) as well as a representative backend “cloud” management system (right of Fig. 5.21). It is also aligned to the conceptual IIC layers as outlined in Section 2. More information available at:
image
Figure 5.21 Intel’s IoT reference model
(Intel, 2015).
The focus within COOPERaTE was primarily the edge tier/layer for example, the gateway as a mechanism for enabling edge based intelligence (as in locally hosted compute and services) and as a link to cloud hosted compute and services. Fig. 5.22 later gives a more specific system overview of the solution deployed. It is this system that support the data tagging service outlined in Section 2.2 and energy services outlined in Section 5.2.3. The approach leverages API’s and the NIM service when communicating beyond the boundaries of the deployed system as part of the wider EPN.
image
Figure 5.22 System overview.

5.2.1. User Defined Data Access

At the time of deployment and to a large degree at the time of writing, many IoT solution vendors in the built environment, particularly residential, focus on providing full service stacks (sensors to cloud applications) in narrow verticals (security, utilities control, lighting etc.). However, the approach here was driven by the trends toward increasingly ubiquitous multivendor wireless sensing and maturing data privacy legislation, and thus the likely decoupling of sensors and services. This decoupling will likely require gateway devices and data management software that provides a user with greater control over their data and configuration. This transition from tightly coupled narrow vertical solutions to more loosely coupled solutions is challenged by problems 1–5 listed below.
Problem 1: Currently, IoT solutions, in the built environment, typically assume either local or cloud based services and do not support selective setting of access levels for individual data types.
Problem 2: Typically, IoT solutions do not separate user generated data from operational data required to maintain the solution.
Problem 3: Currently IoT solutions typically assume single ownership and centralized control of resources.
Problem 4: Typically, in IoT home solutions there is no support for user-driven dynamic change in service plan.
Problem 5: Currently, IoT solutions often do not use the location of the client device to dynamically choose between a cloud-based or locally hosted version of a service.
A user defined data access service utilizing the architecture and system of Fig. 5.22 was developed to address such issues. How the deployed system and service addresses these issues is beyond the scope of this chapter and is dealt with in detail in the COOPERaTE deliverable (D3.3 Report detailing dynamic cloud/edge workload exchange strategies, 2015). Here it suffices to say that the system/service mitigates these problems and strengthens the adoption potential for IoT offerings. It supports data privacy by supporting locally hosted services (e.g., lighting control). It allows for locally hosted services to ingest required data without impacting data privacy. It provides third party service providers with a means to communicate the value of their services in the context of the end-users data while maintaining data privacy (e.g., community level utility usage). This approach can therefore be used to incentives end-users to share access to their data with third party service providers who can provide value added services (e.g., energy DR) which is essential for EPNs.

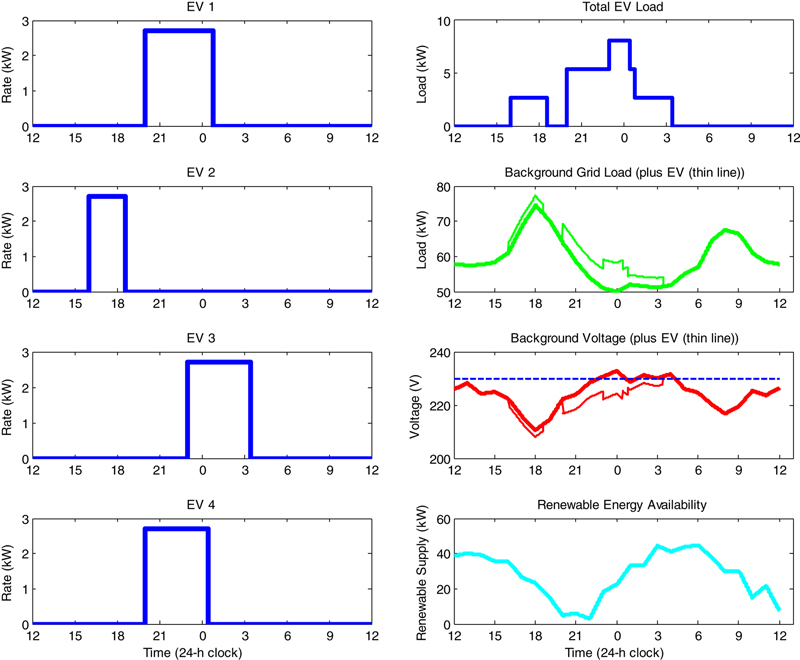
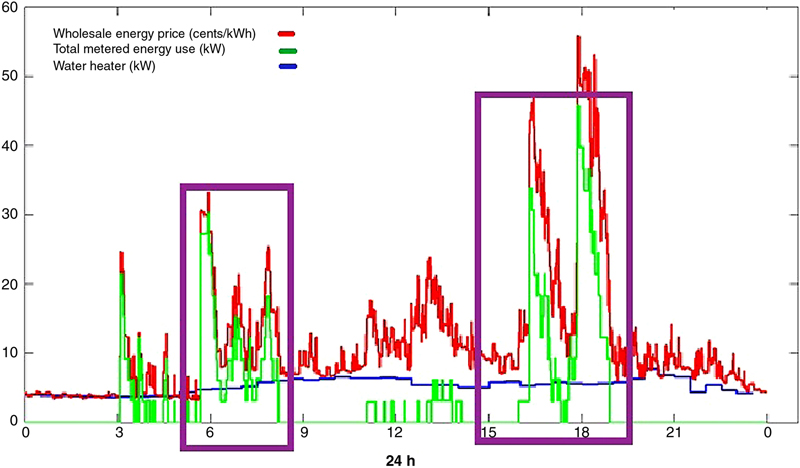
5.2.2. Demand Side Management Services

This subsection outlines the energy services enabled by the system Fig. 5.22 and the data access service of Section 2.2. All services are utilized through an end-user mobile application. The same application service can run globally that is, in the cloud or locally that is, on the gateway and supports user identified preferences for example, privacy. What follows describes some of the basic supported services.
Fig. 5.23 shows the configurable dashboard of the GUI. The user can choose from the different metrics charted and send that specific metric-widget to their dashboard. This allows the user to view the information most relevant to them.
image
Figure 5.23 User configurable dashboard view.
Fig. 5.24, illustrates the NRT monitoring capability of the solution. Within the test-bed the following metrics are supported as required by the defined COOPERaTE use-cases—Temperature, Humidity, Motion status, Door/window status, Power, Energy, Relay status, and Battery charge.
image
Figure 5.24 Charting “now” view, highlighting real-time monitoring.
Actuation is also supported for relevant end-nodes for example, the electrical relay switches. This data is grouped in terms of “zones”, “sensors”, and “timescales”. “Sensors” are aligned to four categories namely—“usage, comfort, security, and other”.
Top right of the home bar, the “cloud strike-through” icon informs the user if they are purely private/local with respect to data egest or if some data types are cloud bound. The “gateway” allows them to switch between gateways should the residence be a larger building with multiple gateway zone. The “notifications” icon indicates if there are events of note for example, “bedroom window is open, temp is below setpoint”, “your building management company needs to gain access to your apartment on Tuesday at 1100”, or “there is a pending energy actuation event from your energy aggregator today from 1400–1430”.
Fig. 5.25, illustrates the charting capability which allows the user to graph metrics for day, week, month, and year. The approach taken, even when in private mode, is to allow for data ingest which supports services for example, wholesale market pricing for locally run optimization service on the gateway, average neighborhood consumption of users for benchmarking functionality. The only difference between users that are in “private” versus users that are in “shared” mode is the ability of the latter to capitalize on DR, flexibility or other external transaction services. This approach is discussed further in (D3.3 Report detailing dynamic cloud/edge workload exchange strategies, 2015). The overall solution can also utilizes other services for example, existing opensource OpenHAB bindings. The overall functionality of the system and the service described above addresses use-case 1 “real-time monitoring” and use-case 4 “DR” with respect to the residential elements of the test-bed. Use-cases 2 and 3 are partly addressed by the overall system functionality and the optimization service described below, these use-cases are addressed in full, when interfaced to the COOPERTE SoS specifically the NIM/services.
image
Figure 5.25 Charting “Day” view, plotting power.

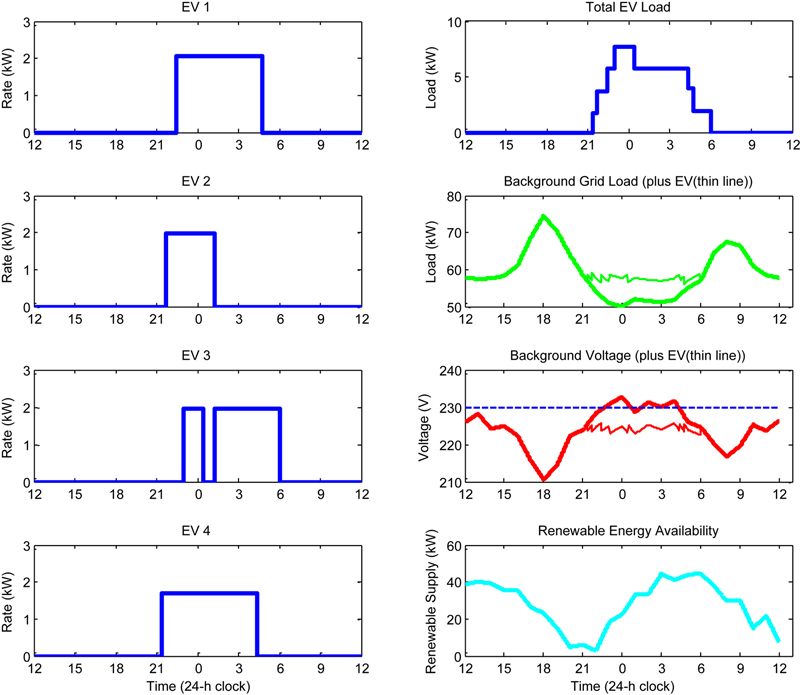
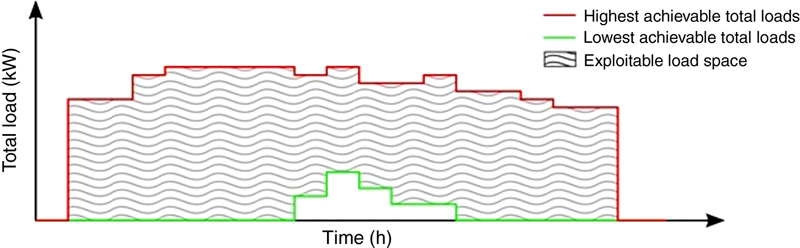
5.2.3. Optimization/Flexibility Service

The optimization service utilizes an algorithmic service developed outside the COOPERaTE project. The service interface was adapted to accommodate the COOPERaTE test-bed specifics. It decides upon the optimal charge plans for a community of devices to achieve some desired aggregate grid behavior, for example, water heater on, slab heating on. In essence it allows for flexibility services via the NIM to the grid that is, DR services.
Consider the following generic example: four devices (Electric Vehicles EVs, storage heaters, etc.), charging as soon as possible would present the behavior outlined in Fig. 5.26. This naïve charging behavior is detrimental to the grid as it increases the load at peak load times and decreases the voltage levels at critical voltage times. This increases the necessity of further investment in the grid, especially as more and more loads come online. To facilitate an increasing number of loads on the grid without incurring further investment in the grid, one can take a community-centric approach of deciding on the optimal charge plan for each controllable device to achieve an appropriate shape on the aggregate load.
image
Figure 5.26 The effect of naive charging on the entire electricity neighborhood.
Fig. 5.27 illustrates the aggregate grid behavior one can achieve when the start time and charge rate for all devices in the community are controllable and are informed by a metaheuristic optimization technique. The objective of the optimization technique can incorporate any phenomena that can be mathematically described; for example, eliminating increases in peak load, reducing the overall load levels, eliminating reductions in minimum voltage, maximizing the overall voltage levels, increasing renewable consumption, and so on. The narrow lines in Fig. 5.26 and 5.27 indicate the effect of the devices on the grid load and grid voltage.
image
Figure 5.27 Effect of load-optimized charging on the grid.
For this particular implementation the optimization service was configured to minimize the wholesale energy cost. In such a configuration, the optimization server utilizes Irish whole-island energy wholesale data as one of the inputs to the optimization objective function. The objective is to select the charge parameters for each house, which minimize the total cost of charging, subject to all users’ time constraints. Hence, by delegating control of their predictably flexible loads to an external party the end-user can experience a cost saving, proportional to the cost benefit which utility stakeholder experiences.
Fig. 5.28 gives a COOPERaTE specific example of how the service can deliver value. The figure graphs the “total power consumption” “water Heater”, and “wholesale energy price” for one day in Parchment square. Highlighted by the rectangle boxes one can see it would be cheaper to charge a few hours earlier. This would be automatically moved to cheaper charging periods by the service. Fig. 5.28 is a simplification for illustration and assumes the water heaters are well insulated and the heat energy loss is negligible over 3 h. If loss can’t be treated as negligible one can “cost-in” energy loss of the water heaters so that the optimized charge plans would cause more charging in cheaper energy periods while ensuring enough energy remains at the required time, only when doing so would result in a lower net cost of charging.
image
Figure 5.28 Day view parchment square.
The service can inform third party aggregators via the NIM about the flexibility in the total energy consumption levels that can be achieved by our energy aggregator service. This can be done by sending complete information about individual controllable device’s availability and usage requirements, or by presenting aggregate profiles. These aggregate profiles represent the highest and lowest possible loads that could be achieved at any particular time based on the charge requirements of all participating devices. An energy aggregator can choose a total power level in the exploitable load space Fig. 5.29 that the optimization service will be able to achieve on behalf of the aggregator. Any such flexibility request will require a reoptimization and a dispatch of new charge plans to relevant devices.
image
Figure 5.29 Opportunity space for demand response (DR).

5.3. Energy Services—Industrial

This section describes the energy services developed in EMBIX’s meter data management platform and implemented specifically within the Bouguyes Challenger industrial test-bed. The EMBIX’s platform presents an open API that exposes data to other services, such as the NIM or any other services developed by a third party, such as forecasting module, analytics module, and so on. Error! Reference source not found illustrates an example whereby the system interfaces to a forecasting module (Figs. 5.30 and 5.31).
image
Figure 5.30 EMBIX’s platform connecting to external forecasting module.
image
Figure 5.31 UrbanPower architecture.

5.3.1. Visualization Service

To enable any type of analytics it is desirable to have a visualization service available. As such, a tool box (Fig. 5.32) for standard data visualization was developed to allow graphing of stored datasets.
image
Figure 5.32 Example of the visualization with the tool visualization box.
To raise awareness of energy consumption issues and to allow people to act in an informed and “good way”, specific dashboards based on the Urban Power open API were also developed specifically for COOPERaTE proof of concept (see details in Chapter 7). Fig. 5.33 is another example of a visualization service developed within the COOPERaTE project.
image
Figure 5.33 Challenger Consumption and Production Overview.

5.3.2. Load and Production Forecast

Once extensive historical data is available about energy consumption and production, forecast services can be provided with high accuracy (Fig. 5.34). Forecasts can be made for many usages, such as defining day-ahead flexibility management or the day-ahead market purchase services. For photovoltaic production forecast, different methods have been applied.
image
Figure 5.34 Consumption forecast versus real consumption.
Through the open EMBIX’s platform API, third parties can access historical datasets to analyze and forecast with their own method. The result of the forecasts can then be ingested and visualized within the EMBIX platform.

5.3.3. Flexibility Management Service

A flexibility service allows a campus or neighborhood manager to identify where energy savings can be made and how energy can be traded between different buildings and consumers within the neighborhood or between the neighborhood and the grid. Flexibilities that have been identified include
Cooling and Heating
Battery Storage
Electrical cars
A prototype flexibility service was developed to flatten the grid consumption curve by sending a charge plan every day to the battery system. Fig. 5.35 shows in red the battery power planning and the result on the grid consumption curve (Blue: before optimization and Green: after optimization).
image
Figure 5.35 Battery planning management.
Another flexibility service was tested with the objective to reduce the site electricity bill by considering day-ahead market constraint predictions (Fig. 5.36).
image
Figure 5.36 Electricity Price for Day-Ahead market.

6. Conclusions

This chapter has presented a case and a prototype for an IoT based SoS approach to implementing an EPN. The current IoT landscape includes a myriad of M2M communication standards, IoT architecture models, reference platforms, and data formats. In order to create an ICT platform for EPNs.
It was proposed by the COOPERaTE project that a single standardized platform was unlikely to be adopted as a solution at distinct scale. Therefore, in order to create interoperability across the multiple platforms and communication standards, a data driven semantic operability approach was chosen in the form of the Neighborhood Information Model (NIM) service. The NIM provides interoperability at the data level and can be provided within a single platform, across platforms and also as a service provision by third parties.
A prototype implementation of the NIM was presented followed by a description of example services implemented across three neighborhood management platforms as part of the EU FP7 COOPERaTE project. The efforts of the project demonstrate the feasibility of the chosen approach and how such an approach can create a SoS management architecture and platform to enable EPN.
Some further commentary on the experiences relating to the proposed approach are given in Chapter 8 “Barriers, Challenges, and Recommendations related to development of Energy Positive Neighborhoods and Smart Energy Districts’.

Acknowledgments

The authors are grateful for the inputs provided by all partners in the Cooperate project, and to the European commission for the funding support under grant no. 600063 (Cooperate).

References

Boardman, J., Sauser, B. (2006). System-of-systems—the meaning of. System-of-systems Engineering, 2006 IEEE/SMC International Conference on, Los Angeles, CA, USA.

Bonagura, N, Folco G, Kolding M, & Laurini, G. (2012). Analysis of the demand of cloud computing services in Europe and barriers to uptake. Available from http://ec.europa.eu/information_society/newsroom/cf/dae/document.cfm?doc_id=3983

Bradshaw, D, Folco, G, Cattaneo, G, & Kolding, M. (2012). Quantitative Estimates of the Demand for Cloud Computing in Europe and the Likely Barriers to Take-up. Available from http://cordis.europa.eu/fp7/ict/ssai/study-cc_en.html

BSI Smart city concept model- guide to establishing a model for data interoperability. London, UK: British Standards Institute; 2014.

BuildingSmart, IFC4 Add1 Release. (2016a). Available from: http://www.buildingsmart-tech.org/specifications/ifc-releases/ifc4-add1-release

BuildingSmart, ifcXML releases. (2016b). Available from: http://www.buildingsmart-tech.org/specifications/ifcxml-releases

BuildingSmart, ifcOWL. (2016c). Available from: http://www.buildingsmart-tech.org/future/linked-data/ifcowl

Carrez, F., Bauer, M., Boussard, M., Bui, N., Jardak, C., De Loof, J., Magerkurth, C., Meissner, S., Nettsträter, A., Olivereau, A., Thoma, M., Walewski, J.W., Stefa, J., & Salinas, A. (2013). Internet of Things—architecture IoT—A Final architectural reference model for the IoT v3.0. http://www.iot-a.eu/public/public-documents/d1.5/at_download/file

Cisco. (2013). Building the Internet of Things. (pp. 2013–2014), IoT World Forum Reference Model.

CityGML.| OGC. Available: http://www.opengeospatial.org/standards/citygml. [Accessed: 18-Jan-2016].

Compton M, Barnaghi P, Bermudez L, García-Castro R, Corcho O, Cox S, Graybeal J, Hauswirth M, Henson C, Herzog A, Huang V, Janowicz K, Kelsey WD, Le Phuoc D, Lefort L, Leggieri M, Neuhaus H, Nikolov A, Page K, Passant A, Sheth A, Taylor K. The SSN ontology of the W3C semantic sensor network incubator group. Web Semantic Science Service Agents World Wide Web. 2012;17:2532.

Corrado, V., & Ballarini, I. (2012). Report on the Accessible Energy Data. FP7 SEMANCO project public deliverable 3.1. http://semanco-project.eu/index_htm_files/SEMANCO_D3.1_20120921-1.pdf

Fowler M. Domain-specific languages. Pearson Education; 2010.

Gamma E, Helm R, Johnson R, Vlissides J. Design patterns: Elements of reusable object-oriented software. Pearson Education; 1994.

Greifenberg, T., Look, M., Rumpe, B., & Ellis, K. (2014). Integrating Heterogeneous Building and Periphery Data Models at the District Level: The NIM Approach. In: Proc. 5th Workshop on eeBuilding Data Models (eeBDM) (part of 10th European Conference on Product & Process Modelling (ECPPM) 2014). Vienna, Austria.

Guibene, W., Nolan, K.E., & Kelly, M.Y. (2015). Survey on Clean Slate Cellular-IoT Standard Proposals. Computer and Information Technology; Ubiquitous Computing and Communications; Dependable, Autonomic and Secure Computing; Pervasive Intelligence and Computing (CIT/IUCC/DASC/PICOM), IEEE International Conference on, Liverpool, UK, pp. 1596–1599.

Krcmar, H., Reussner, R, & Rumpe, B (Eds.), (2014). Trusted Cloud Computing. Springer International, Schweiz.

IEC 61970-501:2006. (2016). IEC Webstore. Available from: https://webstore.iec.ch/publication/6215

Industrial Internet Consortium, 2015. Industrial Internet Reference Architecture. Available from: http://www.iiconsortium.org/IIRA.htm

Intel, 2015. Intel IoT Reference Model. Available from: http://download.intel.com/newsroom/kits/iot/insights/2014/gallery/images/INTEL_04_iot-01-1-01.jpg

International Electrochemical Commission, CIM Standards, Geneva, Switzerland. Available from: http://www.iec.ch/smartgrid/standards/.

ITU-T Recommendation Series Y: Global Information Infrastructure, Internet Protocol Aspects and Next Generation Networks. Geneva, Switzerland: International Telecommunications Union; 2012.

Karsai, G. et al. (2009). Design guidelines for domain specific languages. In: Proc. of 9th OOPSLA workshop on domain-specific modeling. Orlando, FL, USA (pp. 7–13).

Krahn H, Rumpe B, Völkel S. MontiCore: a framework for compositional development of domain specific languages. International Journal on Software Tools for Technology Transfer. 2010;12(5):353372.

Look, M. & Greifenberg, T. (2013). D1.2 Report detailing Neighbourhood Information Model Semantics. COOPERATE Control and Optimisation for energy positive Neighbourhoods. http://www.cooperate-fp7.eu/files/cooperate/downloads/COOPERATE_D12.pdf: s.n.

Look, M. & Greifenberg, T. (2013). D1.5 Report on validation site refined Neighbourhood Information Model. COOPERATE Control and Optimisation for energy positive Neighbourhoods. http://www.cooperate-fp7.eu/files/cooperate/downloads/COOPERATE_D15.pdf: s.n.

Look, M. & Greifenberg, T. (2013). D1.7 Report detailing final Neighbourhood Information Model architecture. COOPERATE Control and Optimisation for energy positive Neighbourhoods. http://www.cooperate-fp7.eu/files/cooperate/downloads/COOPERATE_D17.pdf: s.n.

McGibney, A., Beder, C., & Klepal, M. (2012). MapUme Smartphone Localisation as a Service—a cloud based architecture for providing indoor localisation services. In: Proc. International Conference on Indoor Positioning and Indoor Navigation (IPIN), Sydney, Australia.

OMG, (2011). UML 2.4.1 Infrastructure. Available from: http://www.omg.org/spec/UML/2.4.1/Infrastructure/PDF/

Open Interconnect Consortium. (2015). Oic Core Candidate Specification Project B.

OWL 2 Web Ontology Language Document Overview. 2015. Available from: http://www.w3.org/TR/2009/WD-owl2-overview-20090327/

Pesch, D., Ellis, K., Kouramas, K. & Assef, Y. (2013). D1.1 Report on Requirements and Use Cases Specification. COOPERATE Control and Optimisation for energy positive Neighbourhoods, http://www.cooperate-fp7.eu/files/cooperate/downloads/COOPERATE_D11.pdf: s.n.

Postscapes. 2015. IoT Alliances round-up. Available from: http://postscapes.com/internet-of-things-alliances-roundup/.

RDF Schema 1.1. Available from: https://www.w3.org/TR/2014/REC-rdf-schema-20140225/

Rumpe B. Modellierung mit UML: Sprache, Konzepte und Methodik. Berlin, Germany: Springer Verlag; 2011.

Rumpe B. Agile Modellierung mit UML: Codegenerierung, Testfälle, Refactoring. Berlin, Germany: Springer Verlag; 2012.

Schindler, M. (2012). Eine Werkzeuginfrastruktur zur agilen Entwicklung mit der UML/P. Ph.D. thesis. Shaker Verlag.

eeSemantics (Login required). (2016). Available from https://webgate.ec.europa.eu/fpfis/wikis/display/eeSemantics/Home

SPARQL Query Language for RDF. Available from: http://www.w3.org/TR/rdf-sparql-query/#basicpatterns

SWRL: A Semantic Web Rule Language Combining OWL and RuleML. Available from: https://www.w3.org/Submission/SWRL/

Völkel, S. 2011. Kompositionale Entwicklung domänenspezifischer Sprachen. Ph.D. thesis. Shaker Verlag, Aachen, Germany.

Yan L, Zhang Y, Yang LT, Ning H. The Internet of Things: From RFID to the Next-Generation Pervasive Networked Systems. Boca Raton, FL, USA: CRC Books, Auerbach Publ; 2008.

Zimmermann, H. 1980. OSI Reference Model—The ISO Model of Architecture for Open Systems Interconnection. IEEE Transactions on Communications COM-28, No. 4.

..................Content has been hidden....................

You can't read the all page of ebook, please click here login for view all page.
Reset
18.117.154.219