
Chapter Seven
Real Life Experience—Demonstration Sites
M. Boudon*
E. L’Helguen*
L. De Tommasi**
J. Bynum**
K. Kouramas**
Abstract
This section describes the results of the different optimization processes implemented in terms of energy savings and demonstrates the viability and feasibility of the COOPERaTE platform in two test sites. Indeed, COOPERaTE is not only a theoretical project: it was decided to illustrate the proposed COOPERaTE energy management approaches and services through two test sites: the Bishopstown site in Ireland and the Challenger site in France.
After exposing the methodology and use cases, a description and an evaluation of the KPIs is completed. This evaluation enables to compare the baseline and the reporting period; and enhance the real savings and impact on the two neighborhoods and potentially the impact on energy positive neighborhoods through the demonstration of the main four use-cases.
Keywords
KPI
demo sites
energy savings
performance assessment
baseline
reporting period
This chapter focuses on the implementation of the energy services in two demo sites. It describes the energy use-cases developed in COOPERaTE and outlines the evaluation methodology. A significant portion of the chapter is devoted to the presentation of the main results and details the energy-saving estimations.
Even if it was key to understand the results of COOPERaTE services on specific demo sites, the focus of these real-life experiences was to apply the COOPERaTE method having a system of systems approach. There was a clear focus on defining a baseline and a reporting period to make sure that the characteristics of each demo site would not have a too high impact on the COOPERaTE results. Appling the SUDA process (see Chapter 3) helped in understanding the obstacles and opportunities of each site and to make the most of them designing specific services, keeping in mind the overall purpose of the Energy Positive Neighborhood.
1. Site Description
The CIT Campus Bishopstown is a multiownership neighborhood which includes three main buildings: NIMBUS, Leisure world, and Parchment square (Fig. 7.1).

Figure 7.1 The Bishoptown Campus demo site.
They feature the energy consumption, production, and storage components listed in Table 7.1.
Table 7.1
Energy components on the Bishoptown demo site
| Energy Consumption Components | ||
| NIMBUS | Leisure world | Parchment square |
Aggregated Electrical Load: • Heating Load
• Computational Load
• Lighting Load
• Electrical Load
|
Aggregated Electrical Load (measurements only available since February 2015) | Aggregated Electrical Load (measurements not available for all the periods) |
| Energy Generation Components | |||||
| NIMBUS | Leisure world | Parchment square | |||
| Wind power | Combined Heat and power | Gas Boilers | Combined Heat and power | Gas Boilers | (Not existing) |
| Energy Storage Components | |||
| NIMBUS | Leisure world | Parchment square | |
| Battery | Thermal Storage (Water Tanks, PCM) | (Not existing) | (Not existing) |

Being a decentralized optimization approach, each building of the CIT Campus Bishopstown performs optimal scheduling of flexible energy generation and storage components. From the three buildings composing the demo site, NIMBUS is a great example of a building with flexible generation (e.g., CHP), electrical storage, and renewable energy production (Wind) installed on-site.
The Challenger single-ownership demo site (Fig. 7.2) features the energy consumption, production, and storage components listed in Table 7.2. The electrical storage installed on-site is used as energy optimization potential of the demo site.
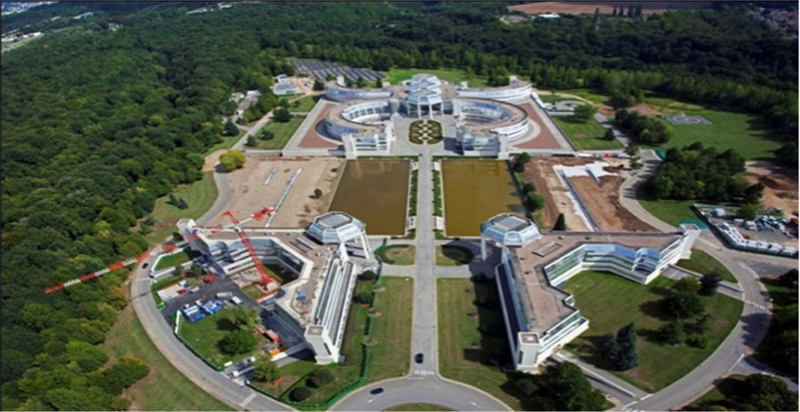
Figure 7.2 The Challenger Campus demo site.
Table 7.2
Energy components on the Challenger demo site
| Energy Consumption Components | ||||
| Heating/Cooling Load | Computational Load | Lighting Load | Electrical Load | Special Uses Load |
| Energy Generation Components | ||
| Photovoltaics | (Reversible) Heat pumps | Electric Heating Rods |
| Energy Storage Components | |
| Battery | Thermal Storage (Water Tanks) |

The ability to store electrical energy on site is used by the neighborhood energy centralized optimization algorithm, developed by EMBIX, to provide flexibility, and balance the generation and consumption of the site. The size of the installed storage system capacity (66 kWh) is less compared to the size of the site’s local generation [e.g., Photovoltaics approx. 3585 (kWp)] but was essential to understand complex mechanisms.
2. Energy Use Cases
The energy use-cases and the way they are assessed in the demonstration sites are summarized in this section.
The selected energy use-cases were intended to demonstrate the energy services and the functionality of the energy optimization algorithms described in Chapter 4. A subset of these use cases was validated via simulation. The four energy-related neighborhood use cases and application services are (Deliverable D1.1, 2013):
• UC1 Real-Time Monitoring of the Consumption of a Neighborhood: Measure, aggregate, and visualize the consumption of the neighborhood in real-time.
• UC2 Energy Demand and Power Generation Forecasting: Forecasting the consumption of the neighborhood and the local generation, hourly ahead, day ahead, or year ahead helps the neighborhood to manage efficiently the energy cost, the interaction with the grid and the market.
• UC3 Optimization of Power Purchases Versus On-Site Generation (implemented only in Bishoptown site): The Neighborhood is able to make the right decision at any time, between importing power from the grid and using the local generation.
• UC4 Demand Response (implemented only in Challenger site): The Neighborhood is providing a flexibility service to the energy market, participating to Demand Response programs, as a single entity, generating additional revenue.
Eight services have been implemented in the demonstration sites to test the different configurations of the use-cases.
| Irish sites | Challenger site |
|
• Real-Time Actuation of Optimized Set-Points enabled at Bishopstown Nimbus Building (Supervisory Control Service)
• Decision Support Service at Bishopstown Leisure-world Building
• Analysis Service for Building Upgrade at Bishopstown Parchment Square
|
• Real-Time data acquisition (more than 2 years of data)
• Forecast Service (PV production, load)
• Optimization Service for batteries
• Energy flow representation
• Demand response Service
|

In the Bishopstown demo site the prototype energy services based on the forecasting and optimization algorithms were evaluated. The optimization services are tailored to the neighborhood type and include the following for this demonstration site:
• Access to weather forecasts.
• Access to energy price forecasts.
• Anonymized aggregated residual demand.
• Partial ability to store and use historical data of the neighborhood usage (restricted to anonymized data).
• Ability to provide optimal schedules for flexible generation and storage components.
All of these functionalities are included as part of the CIT Bishopstown optimization services. Since real-time and historical data are required, use-case scenario UC1 was first implemented [see Deliverable D1.1 (2013) and Deliverable D1.2 (2013)].
Several additional features are also proposed for inclusion in the full-scale demonstration:
• Different energy profiles for working and nonworking days load forecasts.
• A method of including Parchment Square in demand response.
The first proposed functionality regarding different weekday and weekend energy profiles has been added to the optimization services. This was accomplished through the forecasting algorithm discussed in Chapter 4 (by implementing use-case UC2) to distinguish previous days of the same type (working/nonworking days). This functionality also implements use-case scenario UC3 (Deliverable D1.1, 2013).
The second functionality to enable demand response (use-case scenario UC4) can be realized both with the prototype optimization (Chapter 4) and with the Intel E2E platform (Deliverable D3.4, 2015). The prototype optimization addresses demand–response for the neighborhood level. The Intel E2E platform addresses the building-level demand response by exploiting the flexibility of the thermal load provided by the large building thermal mass and controlling the water heater installed in the building.
Currently at the CIT Bishopstown site energy injected into the grid is not rewarded. Additionally, the demo site does not participate in a demand–response scheme—such a case is not allowed by the current TSO/DSO and grid regulations. Therefore, services, such as selling energy to the grid or other actors in the neighborhood, and demand response that are relevant to the UC4 is limited and not possible to be evaluated. It tried to complement the UC4 demonstration by (1) demonstrating how the battery and local generation (CHP) in NIMBUS can help reduce or shift the electricity load based on energy prices, (2) revisiting the capability of the E2E platform to provide demand response based on the water heater controls in Deliverable D3.4 (2015) and (3) by showing here a day-ahead battery optimization in Parchment Square. Currently, there is no battery available in Parchment Square; however, an analysis of how a battery could be used is provided for day-ahead demand response services in Parchment Square, as this was also proved effective in the project by early demonstration in NIMBUS. It is expected that if both these current operational and regulatory limitations are surpassed there will be additional benefits to the demo site by exploiting the services described in UC4. A detailed analysis of the current regulatory and operational barriers, and cost/benefits analysis is given in Chapters 2 and 6.
The forecasting and optimization algorithms developed determine the optimal profiles, schedules, and equipment set-points for the Bishopstown neighborhood based on real-time and historical building data and prices gathered from the neighborhood. They are deployed in the NICORE platform as an optimization service at CIT (Fig. 7.3). Real-time and historical data necessary for the optimization are gathered by the CIT NICORE platform from NIMBUS and Leisure World, and the Intel E2E platform from Parchment Square, by first implementing Use-case UC1 (Deliverable D1.1, 2013). All real measurements are made available to the energy optimization algorithm via the NIM. The optimization results are sent either directly for the actuation of the building equipment or are stored in the relevant data-base and could potentially be leveraged as decision-support services to provide awareness and actionable information to the facility managers and the NEM. The data gathered from the demonstration were stored in NICORE and E2E platforms and used for the evaluation and testing.
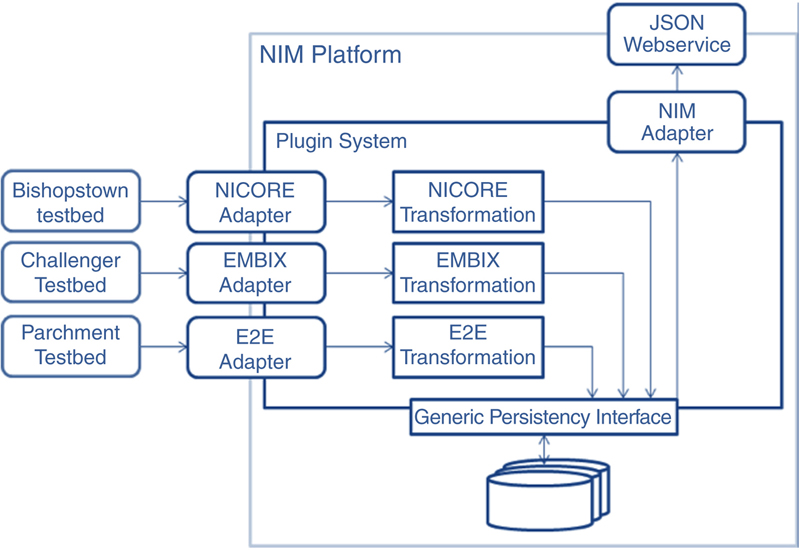
Figure 7.3 Integrating platform and services of COOPERaTE.
In the Challenger demo site, the optimization services were tailored to the neighborhood type and include the following for this demonstration site:
• Access to weather forecasts.
• Access to energy price forecasts.
• Real-time neighborhood monitoring of local energy generation, energy consumption, and energy storage components (via the EMBIX’s meter data management platform).
• Ability to provide optimal schedules for flexible local generation and storage components.
All of these functionalities are included as part of the Challenger optimization services. The integration of the EMBIX’s meter data management platform with the COOPERaTE SoS is also shown in Fig. 7.3. The demonstration in the Challenger demo site includes all four use-case scenarios detailed earlier.
3. Evaluation Methodology
The suggested KPIs for assessing the performance of an energy positive neighborhood are summarized in Table 7.3 (Deliverable D4.4, 2015). These KPIs were used in COOPERaTE to assess the performance of the energy services.
Table 7.3
COOPERaTE energy KPIs
Energy
Total energy consumption (kWh/day)
Local energy generation (kWh/day)
Max. power demand (kW)
Max. grid power demand (kW)
Environment
Energy savings (%, kWh)
Share of local and renewable energy generation (kWh, %/year)
Economics
Energy purchased from the grid (kWh)
Energy sold to the grid (kWh)
The evaluation effort focused on demonstrating how each of the KPIs is impacted in each neighborhood.
In the remainder of this section, the methodology for comparing the demonstration results against the baseline and the process for selecting the baseline and reporting periods based on the particular needs and limitations of the demo sites is explained.
In order to evaluate the savings in the two demonstration sites, the International Performance Measurement and Verification Protocol (IPMVP) was selected. It enables before and after intervention measurement and comparison. It involves the collection of data during a baseline period and then compares to a reporting period. Savings are defined as baseline period use—reporting period use ± adjustments.
The energy baseline for both sites was based on a 12-month historical data for each of the buildings in the neighborhood. For Bishopstown site, historical data of the NICORE platform was considered to determine day-ahead forecasts for the electrical and thermal consumption used to optimize the system. For Parchment Square (residential) data was pulled from the Intel system via the NIM into NICORE for evaluation.
Then a reporting period has been defined. In the Bishopstown demo site, for a neighborhood-level demonstration one needs to have access to all the buildings of the neighborhood during the same period of time and hence we look for a time window where all the buildings are accessible in terms of available data or actuation (where enabled).
The analysis was performed, based on real neighborhood data, for different periods covering high and low building demand. The following results section is focused on a representative example of performance assessment.
The scope of the energy study during the reporting period for Challenger is the whole set of buildings in the Challenger campus. A full year reporting period was used. The reporting period lasts from October 2014 to October 2015.
4. KPI Evaluation and Assessment
The KPI evaluation for CIT Bishopstown demonstration site will focus on a 1-week reporting period that corresponds to high heating demand (winter). The outcomes of the demonstration and the optimization implementation are explained later in the chapter. The overall objective as described in Section 1, is to minimize the energy cost for the overall neighborhood and for each of the individual buildings in it. Therefore, the overall neighborhood energy cost is optimized by optimizing the total energy cost of the three buildings collectively.
The KPIs are calculated and demonstrated both for the individual buildings and neighborhood as a whole. The main KPI in this case is of course the energy cost savings, nevertheless estimates of other KPIs listed in Table 7.1 is given to offer a more rigorous and comprehensive evaluation of the performance of the energy services in the neighborhood. Recommendations for the optimal operation of the equipment in the two main buildings of NIMBUS and Leisure World is discussed, where a significant capability for local heat and electricity generation and storage is installed. Potential demand response benefits in Parchment Square are also detailed here, as this building has a significant load shifting capability, due to the large thermal mass and number of apartments. These recommendations could potentially be used to optimize the future operation of the system.
In certain cases the on-line optimization of the NIMBUS battery and CHP is considered with the optimization service acting as an on-line optimization module, while the optimization of the Leisure World and Parchment equipment is performed off-line with the optimization services acting as a decision support tool rather than on-line optimization module.
The week from 13th to 17th February 2015 was chosen to demonstrate the energy benefit analysis. The baseline for this scenario is established considering the measured consumption for the chosen period. The reporting period results for all three buildings in this case are the results of the application of the energy optimization algorithm. Energy savings are evaluated as the optimized component set-points were implemented for the same period.
For the Nimbus building, the analysis is performed using real consumption data from the building, and the optimization algorithm working both for real-time actuation of the battery and the CHP, and as decision-support tool. All of the system components are active including the CHP since the heating demand is large enough to operate the CHP during the selected period.
Figs. 7.4–7.6 show the results of application of the energy optimization algorithm. In particular, it shows the electrical powers and the electrical storage state of charge. They are: the building load, the battery charging/discharging power, and the CHP power.
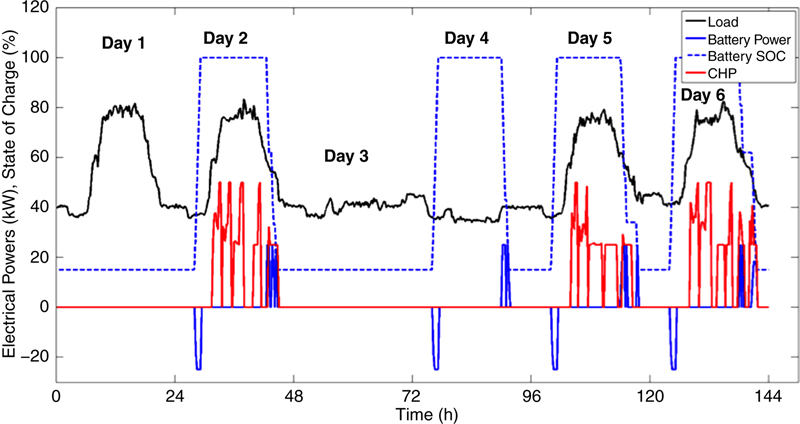
Figure 7.4 Electric Power consumption and generation for Nimbus.

Figure 7.5 Heat load and generation for Nimbus.
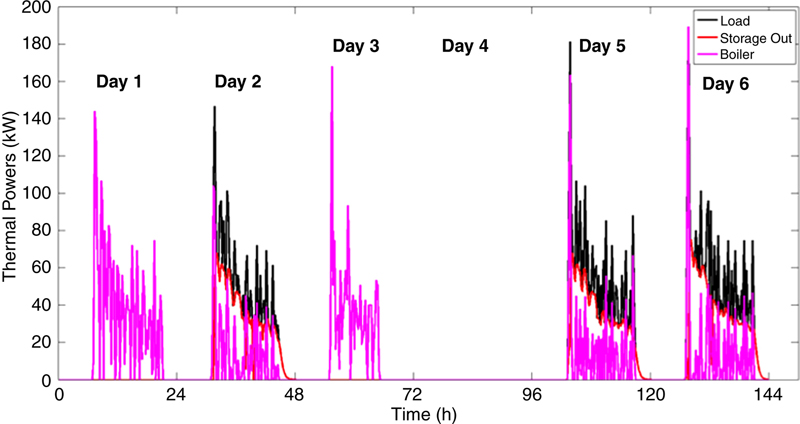
Figure 7.6 Thermal storage output power and energy stored, and CHP output power for Nimbus.
Fig. 7.5 shows the thermal powers that supply the building load. They are the boiler power and the output power of the CHP thermal storage. Fig. 7.4 shows the CHP thermal storage operation. The CHP thermal power is the thermal storage input power. Power balance (difference between storage input and output powers) and energy losses determine the stored energy variations.
In order to compute the thermal load forecasts that have been used for optimizing the CHP set-point, the measured thermal demand of the building was considered. For most of the days of the selected period the CHP was not running. In particular, it was found from recorded data that only on February 13th the CHP was running for a few hours. This way of operating the system is likely to be an indicator of nonoptimal system operation. Furthermore, the supply of the thermal load using the boiler can give thermal load with several spikes and large variations in the supplied power—possibly showing that neither minimum output power nor minimum running time constraints which characterize the CHP operation are fulfilled. In order to optimize the CHP set-point, forecasts of the electrical and thermal consumption obtained were used by combining from 1 to 3 previous days of the same type (e.g., working or nonworking days) (Table 7.4).
Table 7.4
Comparison of baseline and reporting period for NIMBUS
| Baseline | Reporting period | |
| Energy | ||
| Total energy consumption (kWh/day) | 1641 | 1641 |
| Local energy generation (kWh/day) | 20 elec, 35th | 182 elec, 326th |
| Max. power demand (kW) | 83 | 83 |
| Max. power grid power demand (kW) | 83 | 83 |
| Environment | ||
| Energy savings (%, kWh) | — | 0, 0 |
| Share of local and renewable energy generation (%) | 3.3% | 31.0% |
| Economics | ||
| Grid energy consumption and cost (kWh, €) | 5867 kWh, €553.27 | 5053 kWh, €458.20 |
| Energy cost savings (%,€) | — | 4.9%, €33.00 |

For the LeisureWorld building, due to the presence of swimming pools, the heating load for this building is a constant base load and is not only dependent on the weather conditions; therefore the CHP can operate for much more of the year than in the Nimbus. For this building, however, it is not possible to send control signals to the equipment to modify their operation/actuation and the analysis was done offline.
The amount of thermal load allows a significant contribution of CHP to thermal and electrical load supply—with continuous operation for several hours of the day. Application of the proposed energy management tools enables to operate the CHP to achieve cost savings with respect to the building baseline. The building baseline considered here is the CHP operated in the standard thermal load following mode.
The reporting period, includes a weekend. The different energy profiles for working days and nonworking days load forecasts are considered separately in the optimization algorithm; it has been verified that this reduces the forecasting errors. On 12th February (1 day before the chosen reporting period), data gathering happened for forecasting purposes. The actual optimization started on 13th February. On that day the optimized operation of the CHP enabled to supply the thermal base-load and the electrical load for most of the hours of the day. The amount of electricity injected to the grid (not rewarded) is limited by the optimization—still present though—given the CHP output power constraints and load forecasting errors (although forecasts are pretty accurate since the load profiles are rather similar from one day to another).
On 14th February the daily consumption pattern changes because it is a weekend. The optimizer will gather data in order to forecast next weekend days. The next day (15th February) the actual optimization starts again and the CHP again supplies a significant fraction of the load. On 16th and 17th of February the data gathered in the previous days are used to forecast building consumption and optimize the CHP operation. It can be seen that the thermal load is higher than on weekend days and that is reflected in a longer utilization of the CHP. Application of the energy optimization resulted in energy cost reduction of approximately 15% over the period 13–17th with respect to the baseline (CHP operated in thermal load following mode). The reason for such savings is the fact that the optimizer takes into account energy prices and load forecasts to minimize the energy cost, thereby avoiding operating the CHP in a way such that a big amount of electrical energy is injected into the grid, since such energy export is currently not rewarded.
KPIs evaluations are summarized in Table 7.5. Fig. 7.7 shows the electrical and thermal powers for the period February 12–17th. Note that CHP is not operating on the 12th (data collection, first working day) and 14th (data collection, first weekend day).
Table 7.5
Comparison of baseline and reporting period for LeisureWorld
| Baseline | Reporting period | |
| Energy | ||
| Total energy consumption (kWh/day) | 4243 | 4243 |
| Local energy generation (kWh/day) | 1567 elec, 2267th | 744 elec, 1077th |
| Max. power demand (kW) | 91 | 91 |
| Max. power grid power demand (kW) | 75 | 91 |
| Environment | ||
| Energy savings (%, kWh) | — | — |
| Share of local and renewable energy generation (%) | 90.4 | 42.9 |
| Economics | ||
| Grid energy consumption and cost (kWh, €) | 1261 kWh, €95.46 | 2972 kWh, €263.95 |
| Energy cost savings (%, €) | — | 15.26%, €175.64 |

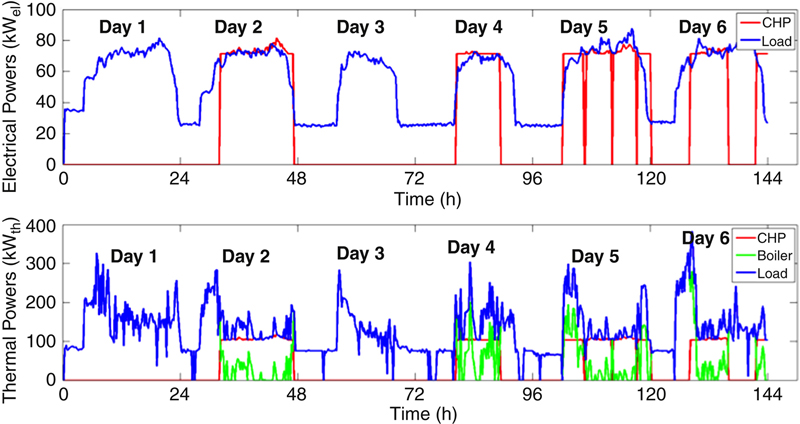
Figure 7.7 Electrical and thermal demand and generation for Leisure World.
For the Parchment Square buildings, there is no on-site electricity generation. Therefore, the local energy generation metric is not relevant as the maximal power used and maximal power asked to the grid are equal. As a result, for the energy metrics only the total site consumption and the maximal site power use are presented later in the chapter. Similarly, for the environment metrics the local resource utilization is not presented.
The energy optimization algorithm was used to analyze the demand response potential and related apartment-level energy benefits which can be achieved by installing a battery unit in one of the apartments of Parchment Square. More specifically, the scenario of using a battery of adequate size for a single apartment was investigated to provide load-shifting capabilities that can support demand response services for Parchment Square. This supports the demonstration of the potential of UC4 scenario.
Economic considerations apply for the sizing, including purchasing costs and corresponding energy savings. This method has been proved effective in the project by the demonstration in the Nimbus. It does not require any modification of the consumption behavior of the building users. Furthermore, it has no impact on the thermal comfort (the building heating system is electric).
Addition of electrical storage further increases the flexibility needed to enable effective demand response services thereby enhancing load flexibility provided by water heaters and the slab heating. Furthermore, the use of electric storage (implying alteration of electric heating system temperature set-points to enable flexibility or hot water availability) does not decrease the thermal comfort of inhabitants.
Fig. 7.8 shows the electrical load and storage charging and discharging powers for the reporting period. A fixed three stages electrical tariff was used (Chapter 4). It shows that the battery is charged when the grid tariff is low (0.0583 €/kWh) and discharged when the tariff is high (0.0942 and 0.1453 €/kWh) to support the demand. The results show that the adoption of a battery of proper size can support the daily load of an apartment and lead to a sensible energy cost reduction. The optimization algorithm has been used to determine the optimal charging/discharging powers for a given load profile to minimize the energy cost (Fig. 7.8). Battery size considered is 9 kWh, which provides a reasonable load support. Corresponding energy cost reduction evaluated over the considered reporting period is about 13%. The previous analysis, is for a single apartment; however, it is expected that if extrapolated for all 171 apartments in the Parchment Square complex the benefits will be significantly higher in terms of total consumption.
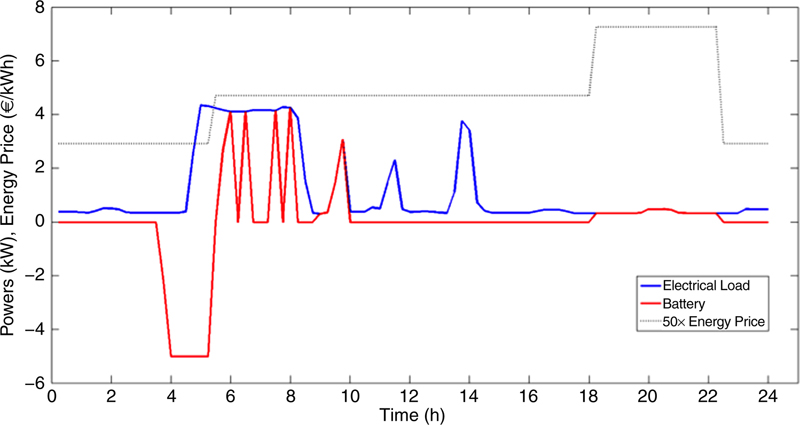
Figure 7.8 Electrical load and electrical storage power for Parchment Square.
KPIs evaluations for Parchment Square are illustrated in Table 7.6.
Table 7.6
Comparison of baseline and reporting period for Parchment Square
| Baseline | Reporting period | |
| Energy | ||
| Total energy consumption (kWh/day) | 26.78 | 26.78 |
| Max. power demand (kW) | 4.34 | 9.34 |
| Environment | ||
| Energy savings (%, kWh) | — | |
| Economics | ||
| Grid energy consumption and cost (kWh, €) | 26.78 kWh, €2.41 | 26.78 kWh, €2.08 |
| Energy cost savings (%, €) | — | 13.7%, €0.33 |

This section shows the evaluation results for the overall optimization of the neighborhood. As described before, the neighborhood objective is to minimize the overall energy cost (electricity and gas), thus combining all energy cost objectives of the three buildings in one single optimization objective (Table 7.7).
Table 7.7
Comparison of baseline and reporting period for CIT Bishopstown Neighborhood
| Baseline | Reporting period | |
| Energy | ||
| Total energy consumption (kWh/day) | 5884 | 5884 |
| Local energy generation (kWh/day) | 1587 elec 2302th |
927 elec 1403th |
| Max. power demand (kW) | 175 | 175 |
| Max. power grid power demand (kW) | 159 | 175 |
| Environment | ||
| Energy savings (%, kWh) | — | 0, 0 |
| Share of local and renewable energy generation (%) | 66.1 | 39.6 |
| Economics | ||
| Grid energy consumption and cost (kWh, €) | 7128 kWh, €648.73 | 8031 kWh, €722.15 |
| Energy cost savings (%, €) | — | 11.34%, €207.03 |

Concerning the Challenger demo site, the optimization process was a two parts process: first, EMBIX optimized the existing building systems (lighting, heating, cooling, ventilation, temperature, etc.) looking for the best operating point and schedule, then, the process was completed by the addition of an energy storage management system.
An example of improvement EMBIX provided is the regulation of the cooling system EMBIX optimized some of the existing systems in Challenger, such as the regulation of the cooling system. After the renovation, the need for cooling was lower. Thus, the regulation of the cooling system needed a finer adjustment in order to achieve significant savings. By shutting down the cooling system during the night and the weekends and having a better control during the day, a clear impact was stressed. In Fig. 7.9, the first weeks are late October 2014 (baseline) then the regulated weeks are the first weeks of the Reporting period. The estimated savings are calculated in the next section.
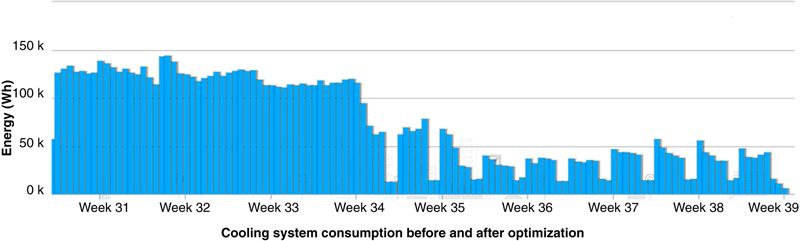
Figure 7.9 Cooling system consumption before and after fine regulation.
When the opportunity showed to work with batteries’ storage (66 kWh capacity) installed at Challenger, EMBIX decided to explore the possibilities offered by this system. The complementarity between storage, renewable energy production and regulation actions was an interesting direction to study within the COOPERaTE program. The COOPERaTE tools developed until now were used in addition with new ones to tackle this issue. Mainly, actions of energy optimization and flexibility were conducted.
Firstly, batteries enable to reduce the power peak and consequently reduce the contract power. To do so, EMBIX developed an optimization module. The module generates a smoothed curve of the power requested from the grid everyday taking into account sunshine and occupancy.
Then, the EMBIX module is able to generate battery power set values [see Fig. 7.10 (adapted to the parameters of each batteries)]. On the same chart, it is possible to visualize the real power of the battery, following the set value.
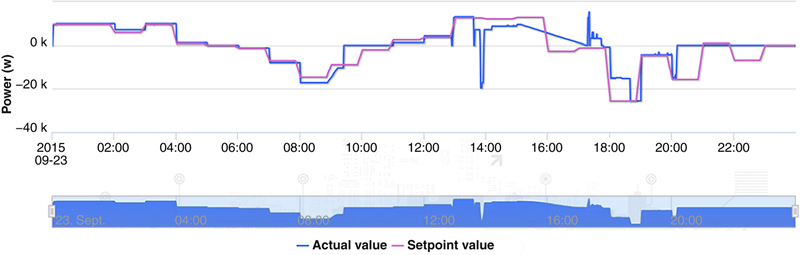
Figure 7.10 Batteries set value versus real power.
Doing so, it is possible to reduce the amount of power ask to the grid. However, it should be recalled that the size of the batteries was too small to see a big impact on the consumption. Even if the batteries are small, the modules EMBIX developed are adjustable and helped having a better understanding of the process of reducing the power peaks.
In the Challenger demo site was also treated the demand response issue. Very linked to the regulatory framework, demand response is about pricing the flexibility of a site. The Challenger site can be flexible thanks to batteries and also thanks to peak shaving and peak shifting. EMBIX developed a module able to generate demand response possibilities according to the consumption, PV production, and batteries’ conditions. These possibilities are generated for the duration of 1 h. The first chart in Fig. 7.11 shows the current load (orange line) and the forecast load (pink line). The second chart displays the demand response possibilities in the 1-h time frame. The last chart displays the PV production (orange line) and forecast (pink line).
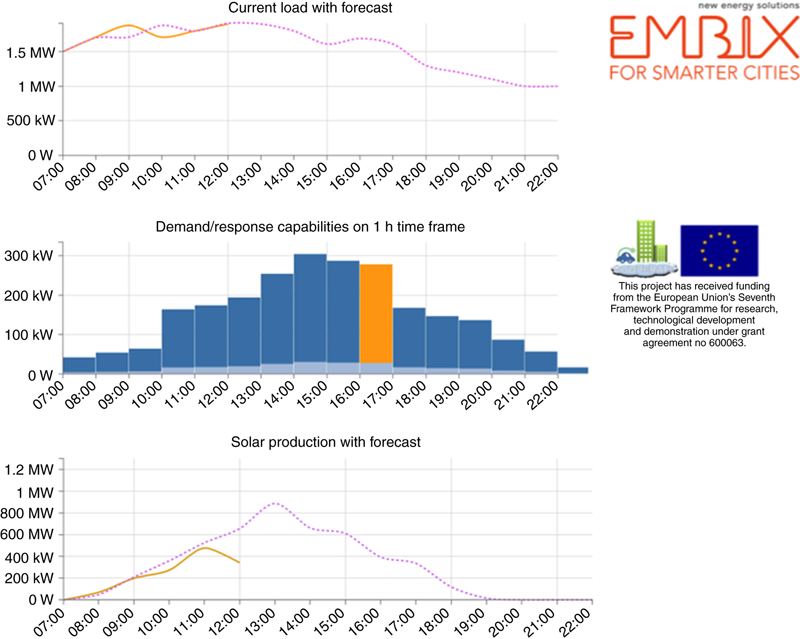
Figure 7.11 Platform of demand response by EMBIX.
To go further, apart from reducing the peak power and helping pricing the flexibility of a site, batteries help in grasping new opportunities.
• The batteries generate arbitrage opportunities across the spot market. According to the price of electricity on the spot market and the selling price of PV electricity, charging and discharging cycles can be optimized. Concerning France, on 1st January 2016 every PV site >500 kW will have to sell its electricity on the spot market (Obersv’er, 2015). Thanks to the expertise developed through COOPERaTE, EMBIX is able to develop a module collecting the spot price and so to optimize in real time the electricity sales and purchases.
• Batteries, as PV inverters, enable to stabilize the voltage of the site by compensating the reactive energy required from the site. This can be valued on the market.
• Equipped with batteries and PV, the site can help to balance the grid at a national level. At the national level, it is crucial to balance electricity consumption and generation, particularly using primary, secondary, and tertiary reserves. It could be interesting to define the Challenger campus as a tertiary reserve valuable on the ancillary market. Nowadays, in France, a producer/consumer must have at least 10 MW to participate in the reserves system. It is not the case of Challenger but EMBIX estimates that projects like COOPERaTE are the occasion to discuss and challenge regulatory frameworks. It stimulates discussion and can lead to change.
Other actions were considered but as the campus was just renovated, these actions were already taken into account. For example, scaling of the boilers, all triggered in late afternoon every day (see the peaks from boilers in Fig. 7.12), was implemented and globally, energy consumptions were divided by 10 (from 310 to 31 kWhpe/m2/year).
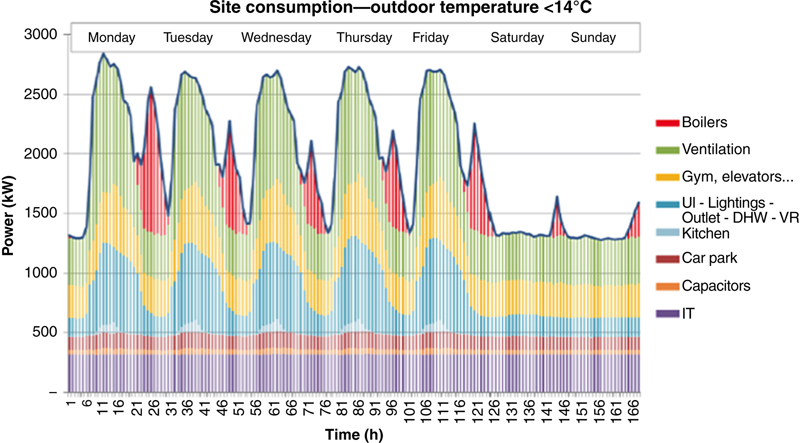
Figure 7.12 Challenger site electrical energy consumption.
To sum up, in the Challenger site, two COOPERaTE actions were implemented:
• Cooling system optimization
• Batteries storage management
In this part, the KPIs defined earlier are evaluated. Table 7.8 summarizes the main numbers and shows the differences between baseline and reporting period (October 2013–October 2014 and October 2014–October 2015). Then, a description of the calculation during the reporting period is proposed.
Table 7.8
Summary of the KPIs, comparison baseline/reporting period
| Baseline | Reporting period | |
| Energy | ||
| Total energy consumption (GWh/an) | 12.6 | 11.8 |
| Local energy generation (GWh/an) | 2.48 | 2.53 |
| Max. power demand (kW) | 3800 | 2600 |
| Max. power grid power demand (kW) | 3600 | 2700 |
| Environment | ||
| Energy savings (%) | 44.16 MWh, 0.4% | |
| Share of local and renewable energy generation (%) | 19.7 | 21.5 |
| Economics | ||
| Grid energy consumption and cost (GWh) | 10.1 | 8.7 |
| Energy and cost of energy sold to grid (MWh) | 133 | 123 |

Hereafter, the consumption of Challenger: close to 11.8 GWh during the whole reporting period. Fig. 7.13 shows the level of consumptions for every month for the period October 2014–October 2015. In green is the energy from the grid, in yellow the energy from PV and the black line represents the overall energy consumptions. Fig. 7.14 shows the level of consumption per day for two weeks in September 2015. The green line shows the energy from the grid, the yellow line the energy from PV, and the black line the total consumptions.
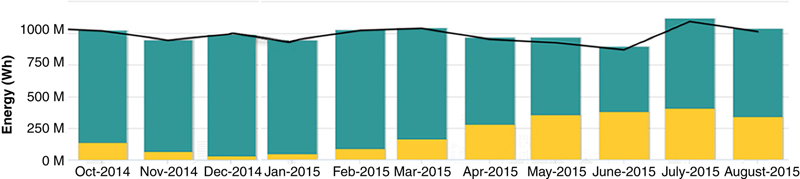
Figure 7.13 Levels of consumption per month.
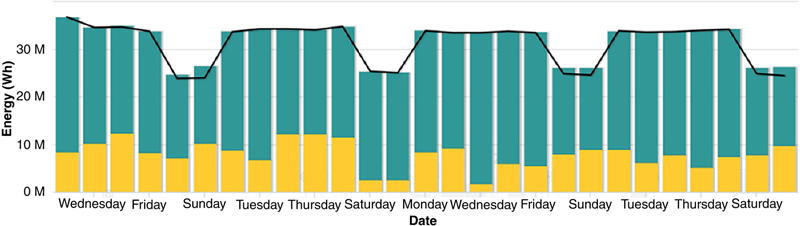
Figure 7.14 Levels of consumption per day.
Here is a focus on the local energy generation by solar panels. As a reminder, there are 21,500 m2 of photovoltaic panels (2.5 MWpeak). Thanks to the EMBIX’s meter data management platform, it is known that the KPI is 2.3 GWh for the reporting period (see Fig. 7.15). Fig. 7.16 shows the total PV energy generation per day in September, which amounts to approximately 10 MWh per day.
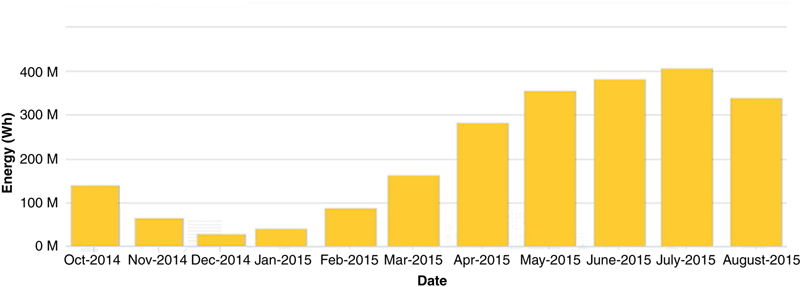
Figure 7.15 Local PV energy generation during the reporting period.
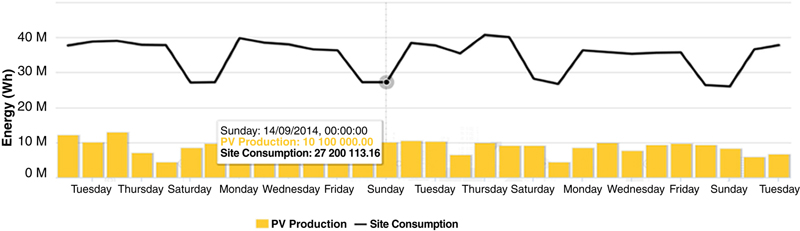
Figure 7.16 Local PV energy generation in September.
Hereafter is the power consumption of Challenger site for the first week of September 2015 (maximal power use: 2.2 MW). For the whole reporting period, the maximum consumption of power was 2.6 MW on 3rd July 2015.
• Results of the savings by controlling the cooling system: a 70% decrease in the consumption (from 58 to 16 MWh).
• Results of the savings by the batteries: in 2015 (batteries were installed in May 2015), Challenger received 1.68 MWh from the batteries (Fig. 7.17).
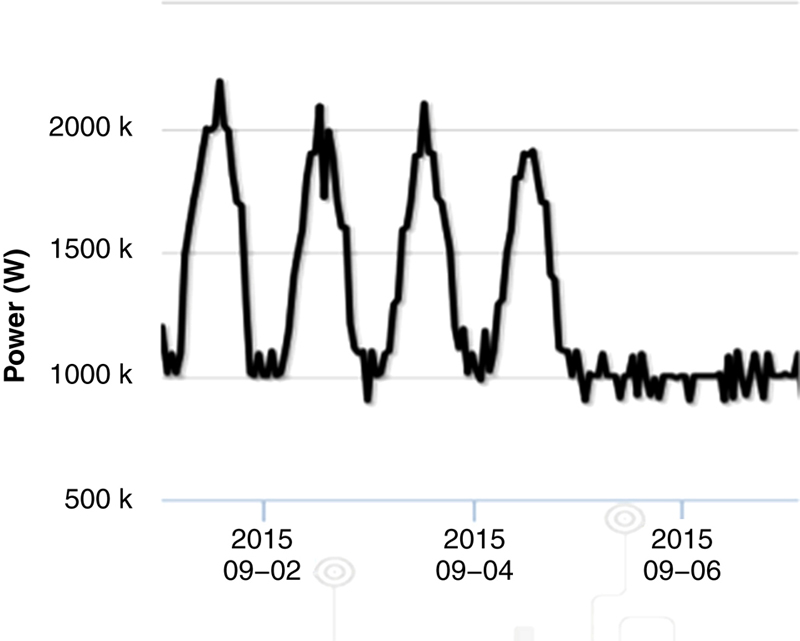
Figure 7.17 Maximum power consumption for Challenger in July 2015.
The total energy savings achieved in Challenger both from the consumption of batteries and from managing the cooling system are 44.16 MWh.
The local resources utilization for Challenger during the reporting period was up to 21.5%.
78.5% of the energy consumed on the Challenger Campus during the reporting period was purchased from the grid and amounts up to 8.7 GWh, as shown in Fig. 7.18.
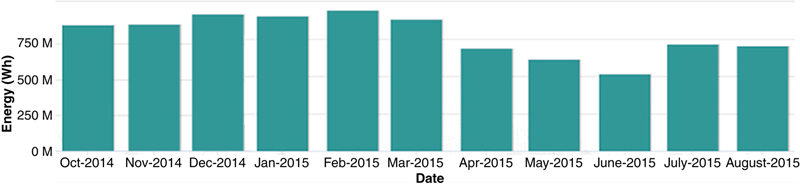
Figure 7.18 Energy purchased from the grid during the reporting period.
On the Challenger campus, energy is sold to the grid when the PV production exceeds consumptions. During the reporting period, 123 MWh have been sold to the grid (Fig. 7.19).
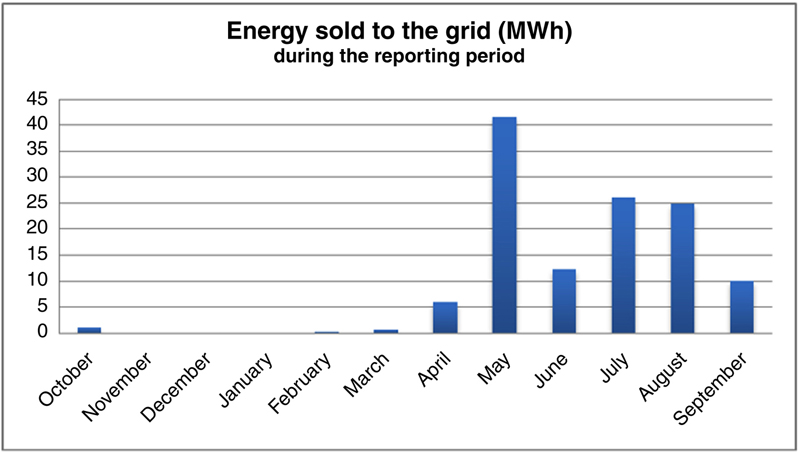
Figure 7.19 Energy sold to the grid.
5. User Awareness
User awareness is also part of deploying services to demo sites. The user impact on energy consumptions is key to reach EPN goals, there is no further need to justify it. To address the user awareness issue, designing user interfaces was a part of the COOPERaTE project. In Challenger demo site, the users working in the campus can follow in real time the consumption of the site and the nature of energy flows (from the grid, from solar panels, from batteries, etc.).
The first user interface EMBIX designed (Deliverable D4.3, 2014) was showing the consumption of the buildings with details (multiple graphic elements), the local production and the main information about the building (meteo, events, etc.). The interface was displayed in the main hall of the building (general public) and in the facilities management offices (technical public).
This interface was appreciated by the users, mainly by the technical staff. EMBIX decided to go further by distinguishing the user interface for technical and general public. A new user interface was designed with a simplified message. This second interface showed in real time the energy consumption distribution. A screenshot of this platform is shown in Fig. 7.20. It is easier to understand it in a few seconds, the timeframe adapted to employees crossing the main hall many times during the day.
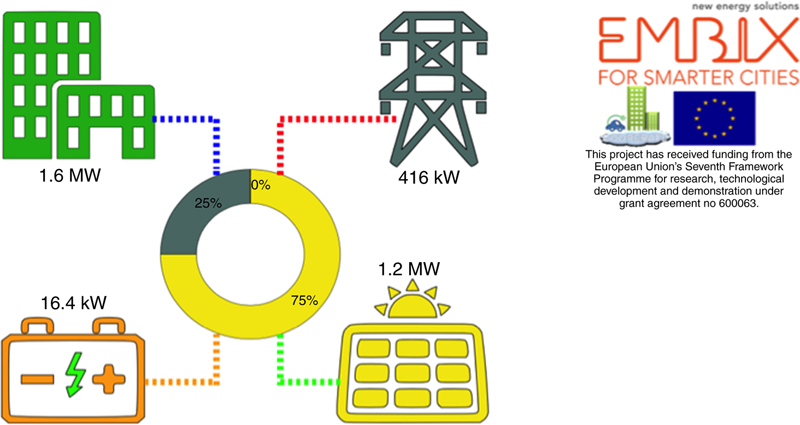
Figure 7.20 Improved neighborhood energy visualization platform for Challenger.
The interface is animated in order to catch the attention of the employees. It is easy to understand and piques curiosity. In a glance, the interface informs about the consumption of the site and where the energy is from (in the example, 75% from solar panels and 25% from the grid, the batteries are charging).
Brainstorming with the future users is key to adapt the interface to their needs: it helps in increasing the awareness and the understanding of the project and approach.
6. Going Further
EMBIX applied the outputs of COOPERaTE in real life projects in order to test the technical and economical value. As an example, on a 240,000-m2 neighborhood, EMBIX may expect a solid business model with a decent ROI in the incoming years (6 years). The energy savings may reach 15% on the energy bill, notably thanks to the energy from batteries becoming affordable (300€–400 €/MWh today) (Figs. 7.21 and 7.22).
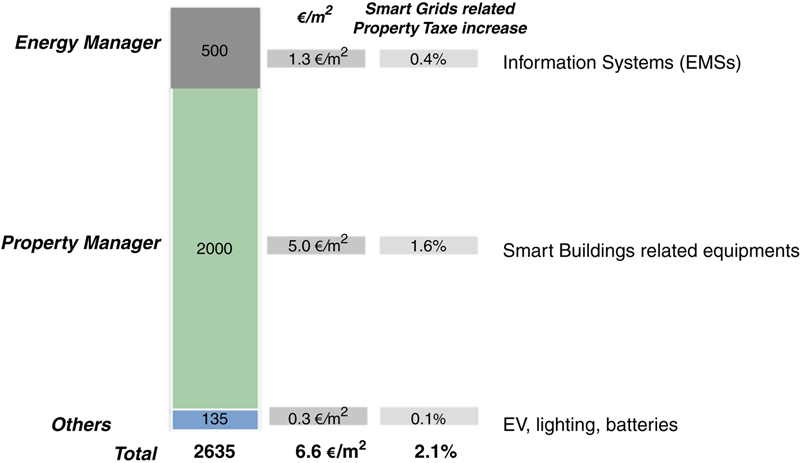
Figure 7.21 Real life example—EMBIX project.
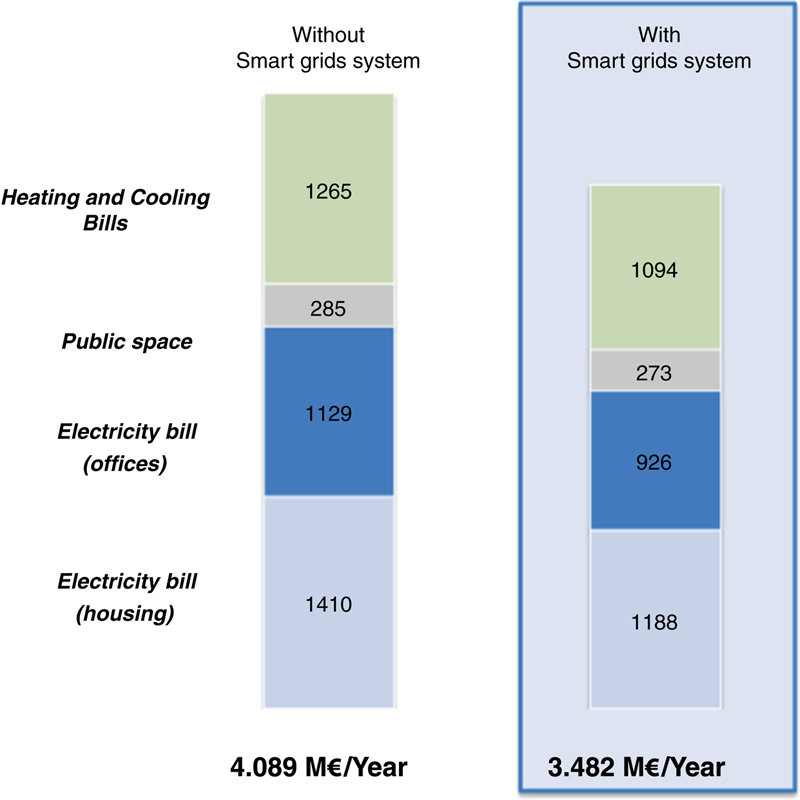
Figure 7.22 Real life example—EMBIX project: 15% energy savings.
7. Conclusions
This section presents the evaluation of the energy savings achieved from the demonstration of the COOPERaTE energy optimization services in the two project demo sites. This work not only demonstrated the potential to achieve energy savings in the two demo sites, but also the benefits of the COOPERaTE System-Of-Systems (SoS) ICT approach for the delivery of energy services to the neighborhood. The energy optimization algorithms offer improved performance for the demo sites in terms of the key energy KPIs for a neighborhood, and can be used for energy optimization both at the building and neighborhood level. The key to this is the optimized coordination of building-level and neighborhood-level supply, demand, and storage, based on energy prices and load and weather forecasts.
The integrated services platform, that was developed in this project by implementing the COOPERaTE SoS approach, has been key to the integration, implementation, deployment, and demonstration of the energy services. The platform allows the integration of different ICT platforms (such as NICORE, E2E, and the EMBIX’s meter data management platform) and BMS systems currently available in the demo sites, and to deploy energy services in such a multitude of heterogeneous systems. It ensures that real measurements and historical data available in the neighborhood can be leveraged through the real-time monitoring, forecasting, and energy optimization services to improve neighborhood energy performance.
Overall, based on the demonstration results, it is fair to conclude that the proposed COOPERaTE SOS approach and energy services can impact positively the energy performance of a neighborhood toward establishing an EPN. This can be done first by maximizing the usage of local, renewable generation and storage resources to improve the energy benefit for the neighborhood and second by optimizing the performance of the neighborhood in order to participate in demand–response services. The key to this are the advanced energy optimization algorithms that were developed in this project and which were tested both in simulations and in real demonstrations.
..................Content has been hidden....................
You can't read the all page of ebook, please click here login for view all page.