Chapter 12
Network Troubleshooting
Objectives
Upon completion of this chapter, you will be able to answer the following questions:
How is network documentation developed and used to troubleshoot network issues?
What troubleshooting methods use a systematic, layered approach?
What are the different networking troubleshooting tools?
How do you determine the symptoms and causes of network problems by using a layered model?
How do you troubleshoot a network by using the layered model?
Key Terms
This chapter uses the following key terms. You can find the definitions in the Glossary.
network topology diagram page 503
physical topology diagram page 503
logical topology diagram page 504
bottom-up troubleshooting page 518
top-down troubleshooting page 519
divide-and-conquer troubleshooting page 521
network management system (NMS) tool page 524
digital multimeter (DMM) page 525
time-domain reflectometer (TDR) page 527
optical time-domain reflectometer (OTDR) page 527
portable network analyzer page 528
Network Analysis Module (NAM) page 528
Introduction (12.0)
Who is the best network administrator that you have ever seen? Why do you think this person is so good at it? Likely, it is because this person is really good at troubleshooting network problems. Good network administrators are typically experienced administrators, but that is not the whole story. Good network troubleshooters generally go about troubleshooting in a methodical fashion, and they use all of the tools available to them.
The truth is that the only way to become a good network troubleshooter is to always be troubleshooting. It takes time to get good at this. But luckily for you, there are many, many tips and tools that you can use. This chapter covers the different methods for network troubleshooting and all of the tips and tools you need to get started. This chapter also has two really good Packet Tracer activities to test your new skills and knowledge. Maybe your goal should be to become the best network administrator that someone else has ever seen!
Network Documentation (12.1)
In this section, you will learn how network documentation is developed and used to troubleshoot network issues.
Documentation Overview (12.1.1)
With network troubleshooting or any other complex activity, you need to start with good documentation. Accurate and complete network documentation is required to effectively monitor and troubleshoot networks.
Common network documentation includes the following:
Physical and logical network topology diagrams
Network device documentation that records all pertinent device information
Network performance baseline documentation
All network documentation should be kept in a single location, either as hard copy or on the network on a protected server. Backup documentation should be maintained and kept in a separate location.
Network Topology Diagrams (12.1.2)
Network topology diagrams keep track of the location, function, and status of devices on a network. There are two types of network topology diagrams: physical topology and the logical topology.
Physical Topology
A physical network topology shows the physical layout of the devices connected to a network. You need to know how devices are physically connected to troubleshoot physical layer problems. Information recorded on the physical topology diagram typically includes the following:
Device name
Device location (address, room number, rack location)
Interface and ports used
Cable type
Figure 12-1 shows a sample physical topology diagram.

Figure 12-1 Example of a Physical Topology
Logical IPv4 Topology
A logical topology diagram illustrates how devices are logically connected to the network. This refers to how devices transfer data across the network when communicating with other devices. Symbols are used to represent network components, such as routers, switches, servers, and hosts. In addition, connections between multiple sites may be shown but do not represent actual physical locations.
Information recorded on a logical network topology may include the following:
Device identifiers
IP addresses and prefix lengths
Interface identifiers
Routing protocols/static routes
Layer 2 information (for example, VLANs, trunks, EtherChannels)
Figure 12-2 displays a sample logical IPv4 network topology.
Figure 12-2 Example of a Logical IPv4 Topology
Logical IPv6 Topology
Although IPv6 addresses could also be displayed in the same IPv4 logical topology used in Figure 12-2, for the sake of clarity, we have created a separate logical IPv6 network topology in Figure 12-3.

Figure 12-3 Example of a Logical IPv6 Topology
Network Device Documentation (12.1.3)
Network device documentation should contain accurate, up-to-date records of the network hardware and software. Documentation should include all pertinent information about the network devices.
Many organizations create documents with tables or spreadsheets to capture relevant device information.
The following sections look at router, switch, and end device documentation.
Router Device Documentation
The table in Figure 12-4 shows sample network device documentation for two interconnecting routers.
Figure 12-4 Router Device Documentation
LAN Switch Device Documentation
The table in Figure 12-5 shows sample device documentation for a LAN switch.

Figure 12-5 LAN Switch Device Documentation
End-System Documentation Files
End-system documentation focuses on the hardware and software used in servers, network management consoles, and user workstations. An incorrectly configured end system can have a negative impact on the overall performance of a network. For this reason, having access to end-system device documentation can be very useful when troubleshooting.
The table in Figure 12-6 shows an example of information that could be recorded in an end-system device document.

Figure 12-6 End-System Documentation Files
Establish a Network Baseline (12.1.4)
The purpose of network monitoring is to watch network performance in comparison to a predetermined baseline. A baseline is used to establish normal network or system performance to determine the “personality” of a network under normal conditions.
Establishing a network performance baseline requires collecting performance data from the ports and devices that are essential to network operation.
A network baseline should answer the following questions:
How does the network perform during a normal or average day?
Where are the most errors occurring?
What part of the network is most heavily used?
What part of the network is least used?
Which devices should be monitored, and what alert thresholds should be set?
Can the network meet the identified policies?
Measuring the initial performance and availability of critical network devices and links allows a network administrator to determine the difference between abnormal behavior and proper network performance as the network grows or as traffic patterns change. The baseline also provides insight into whether the current network design can meet business requirements. Without a baseline, no standard exists to measure the optimum nature of network traffic and congestion levels.
Analysis after an initial baseline also tends to reveal hidden problems. The collected data shows the true nature of congestion or potential congestion in a network. It may also reveal areas in the network that are underutilized; quite often this information can lead to network redesign efforts, based on quality and capacity observations.
The initial network performance baseline sets the stage for measuring the effects of network changes and subsequent troubleshooting efforts. Therefore, it is important to plan for it carefully.
Step 1—Determine What Types of Data to Collect (12.1.5)
When conducting the initial baseline, start by selecting a few variables that represent the defined policies. If too many data points are selected, the amount of data can be overwhelming, making analysis of the collected data difficult. Start out simply and fine-tune along the way. Some good starting variables are interface utilization and CPU utilization.
Step 2—Identify Devices and Ports of Interest (12.1.6)
Use the network topology to identify the devices and ports for which performance data should be measured. Devices and ports of interest include the following:
Network device ports that connect to other network devices
Servers
Key users
Anything else considered critical to operations
A logical network topology can be useful in identifying key devices and ports to monitor. In Figure 12-7, the network administrator has highlighted the devices and ports of interest to monitor during the baseline test.

Figure 12-7 Logical Topology with Highlighted Ports of Interest
The devices of interest include PC1 (the admin terminal), and the two servers (Srv1 and Svr2). The ports of interest typically include router interfaces and key ports on switches.
Shortening the list of ports that are polled keeps the results concise and minimizes the network management load. Remember that an interface on a router or switch can be a virtual interface, such as a switch virtual interface (SVI).
Step 3—Determine the Baseline Duration (12.1.7)
The length of time for which the baseline information is gathered must be long enough to form a “normal” picture of the network. It is important to monitor for daily trends of network traffic. It is also important to monitor for trends that occur over a longer period, such as weekly or monthly. For this reason, when capturing data for analysis, the period specified should be at least seven days.
Figure 12-8 displays examples of several screenshots of CPU utilization trends captured over daily, weekly, monthly, and yearly periods.
In this example, notice that the workweek graphs are too short to reveal the recurring utilization surge every weekend on Saturday evening, when a database backup operation consumes network bandwidth. This recurring pattern is revealed in the monthly graph. A yearly graph, as shown in the figure, may include too much information to provide meaningful baseline performance details. However, it may help identify long-term patterns that should be analyzed further.
Typically, a baseline needs to last no more than six weeks, unless specific long-term trends need to be measured. Generally, a two- to four-week baseline is adequate.
Baseline measurements should not be performed during times of unique traffic patterns because the data would provide an inaccurate picture of normal network operations. Conduct an annual analysis of the entire network or baseline different sections of the network on a rotating basis. Analysis must be conducted regularly to understand how the network is affected by growth and other changes.

Figure 12-8 Baselines for CPU Utilization
Data Measurement (12.1.8)
When documenting a network, it is often necessary to gather information directly from routers and switches. Obvious useful network documentation commands include ping, traceroute, and telnet, as well as the show commands.
Table 12-1 lists some of the Cisco IOS commands most commonly used for data collection.
Table 12-1 IOS Commands for Data Collection
Command |
Description |
show version |
|
show ip interface [brief] show ipv6 interface [brief] |
|
show interfaces |
|
show ip route show ipv6 route |
|
show cdp neighbors detail |
|
show arp show ipv6 neighbors |
|
show running-config |
|
show vlan |
|
show port |
|
show tech-support |
|
Manual data collection using show commands on individual network devices is extremely time-consuming and is not a scalable solution. Manual collection of data should be reserved for smaller networks or limited to mission-critical network devices. For simpler network designs, baseline tasks typically use a combination of manual data collection and simple network protocol inspectors.
Sophisticated network management software is typically used to baseline large and complex networks. These software packages enable administrators to automatically create and review reports, compare current performance levels with historical observations, automatically identify performance problems, and create alerts for applications that do not provide expected levels of service.
Establishing an initial baseline or conducting a performance-monitoring analysis may require many hours or days to accurately reflect network performance. Network management software or protocol inspectors and sniffers often run continuously over the course of the data collection process.
Check Your Understanding—Network Documentation (12.1.9)

Refer to the online course to complete this activity.
Troubleshooting Process (12.2)
In this section, you will learn about the general troubleshooting process.
General Troubleshooting Procedures (12.2.1)
Troubleshooting can be time-consuming because networks differ, problems differ, and troubleshooting experience varies. However, experienced administrators know that using a structured troubleshooting method will shorten overall troubleshooting time.
Therefore, the troubleshooting process should be guided by structured methods. Well-defined and well-documented troubleshooting procedures can minimize wasted time associated with erratic hit-and-miss troubleshooting. However, these methods are not static. The troubleshooting steps taken to solve a problem are not always the same or executed in the exact same order.
Several troubleshooting processes can be used to solve a problem. Figure 12-9 shows the logic flowchart of a simplified three-stage troubleshooting process. Although this is a good starting point, sometimes a more detailed process may be more helpful in solving a network problem.

Figure 12-9 A Troubleshooting Flowchart
Seven-Step Troubleshooting Process (12.2.2)
Figure 12-10 shows a more detailed seven-step troubleshooting process. Notice how some steps interconnect. This is because some technicians may be able to jump between steps, based on their level of experience.

Figure 12-10 The Seven-Step Troubleshooting Flowchart
Define the Problem
The goal of the first stage is to verify that there is a problem and then properly define what the problem is. Problems are usually identified by a symptom (such as the network being slow or not working). Network symptoms may appear in many different forms, including alerts from the network management system, console messages, and user complaints.
While gathering symptoms, it is important to ask questions and investigate the issue in order to localize the problem to a smaller range of possibilities. For example, is the problem restricted to a single device, a group of devices, or an entire subnet or network of devices?
In an organization, problems are typically assigned to network technicians as trouble tickets. These tickets are created using trouble ticketing software that tracks the progress of each ticket. Trouble ticketing software may also include a self-service user portal to submit tickets, access to a searchable trouble tickets knowledge base, remote control capabilities to solve end-user issues, and more.
Gather Information
In the information gathering step, targets (such as hosts and devices) to be investigated must be identified, access to the target devices must be obtained, and information must be gathered. During this step, the technician may gather and document more symptoms, depending on the characteristics that are identified.
If the problem is outside the boundary of the organization’s control (for example, lost internet connectivity outside the autonomous system), contact an administrator for the external system before gathering additional network symptoms.
Analyze Information
Possible causes must be identified. The gathered information can be interpreted and analyzed using network documentation, network baselines, searching organizational knowledge bases, searching the internet, and talking with other technicians.
Eliminate Possible Causes
If multiple causes are identified, then the list must be reduced by progressively eliminating possible causes to eventually identify the most probable cause. Troubleshooting experience is extremely valuable to quickly eliminate causes and identify the most probable cause.
Propose Hypothesis
When the most probable cause has been identified, a solution must be formulated. Troubleshooting experience is very valuable when proposing a plan.
Test Hypothesis
Before testing a solution, it is important to assess the impact and urgency of the problem. For instance, could the solution have an adverse effect on other systems or processes? The severity of the problem should be weighed against the impact of the solution. For example, if a critical server or router must be offline for a significant amount of time, it may be better to wait until the end of the workday to implement the fix. Sometimes, a workaround can be created until the problem is resolved.
Create a rollback plan identifying how to quickly reverse a solution. This may prove to be necessary if the solution fails.
Implement the solution and verify that it has solved the problem. Sometimes a solution introduces an unexpected problem. Therefore, it is important that a solution be thoroughly verified before proceeding to the next step.
If the solution fails, the attempted solution needs to be documented and the changes removed. The technician must now go back to the information gathering step and isolate the issue.
Solve the Problem
When the problem is solved, inform the users and anyone involved in the troubleshooting process that the problem has been resolved. Other IT team members should be informed of the solution. Appropriate documentation of the cause and the fix will assist other support technicians in preventing and solving similar problems in the future.
Question End Users (12.2.3)
Many network problems are initially reported by end users. However, the information provided is often vague or misleading. For example, users often report problems such as “the network is down,” “I cannot access my email,” or “my computer is slow.” In most cases, additional information is required to fully understand the problem. This usually involves interacting with the affected user to discover the “who,” “what,” and “when” of the problem.
The following recommendations should be employed when communicating with users:
Speak at a technical level they can understand and avoid using complex terminology.
Always listen or read carefully what the user is saying. Taking notes can be helpful when documenting a complex problem.
Always be considerate and empathize with users while letting them know you will help them solve their problems. Users reporting a problem may be under stress and anxious to resolve the problem as quickly as possible.
When interviewing a user, guide the conversation and use effective questioning techniques to quickly ascertain the problem. For instance, use open questions (that require detailed response) and closed questions (that is, yes-or-no questions and those that require single-word answers) to discover important facts about the network problem.
Table 12-2 provides some questioning guidelines and sample open-ended end-user questions.
When you are done interviewing a user, repeat your understanding of the problem to the user to ensure that you both agree on the problem being reported.
Table 12-2 Open-Ended User Question Guidelines
Guideline |
Examples of Open-Ended End-User Questions |
Ask pertinent questions. |
|
Determine the scope of the problem. |
|
Determine when the problem occurred/occurs. |
|
Determine whether the problem is constant or intermittent. |
|
Determine whether anything has changed. |
|
Use questions to eliminate or discover possible problems. |
|
Gather Information (12.2.4)
To gather symptoms from networking devices, use Cisco IOS commands and other tools such as packet captures and device logs.
Table 12-3 describes Cisco IOS commands commonly used to gather the symptoms of network problems.
Table 12-3 IOS Commands to Gather Information
Command |
Description |
ping {host | ip-address} |
|
traceroute destination |
|
telnet {host | ip-address} |
|
ssh -l user-id ip-address |
|
show ip interface brief show ipv6 interface brief |
|
show ip route show ipv6 route |
|
show protocols |
|
debug |
|
Note
Although the debug command is an important tool for gathering symptoms, it generates a large amount of console message traffic, and the performance of a network device can be noticeably affected. If the debug must be performed during normal working hours, warn network users that a troubleshooting effort is under way and that network performance may be affected. Remember to disable debugging when you are done.
Troubleshooting with Layered Models (12.2.5)
The OSI and TCP/IP models can be applied to isolate network problems when troubleshooting. For example, if symptoms suggest a physical connection problem, the network technician can focus on troubleshooting the circuit that operates at the physical layer.
Figure 12-11 shows some common devices and the OSI layers that must be examined during the troubleshooting process for each device.

Figure 12-11 Common Devices at Each Layer of the OSI Model
Notice that routers and multilayer switches are shown at Layer 4, the transport layer. Although routers and multilayer switches usually make forwarding decisions at Layer 3, ACLs on these devices can be used to make filtering decisions using Layer 4 information.
Structured Troubleshooting Methods (12.2.6)
Several structured troubleshooting approaches can be used. Which one to use depends on the situation. Each approach has advantages and disadvantages. This section describes various methods and provides guidelines for choosing the best method for a specific situation.
Bottom-Up
In bottom-up troubleshooting, you start with the physical components of the network and move up through the layers of the OSI model until the cause of the problem is identified, as shown in Figure 12-12.

Figure 12-12 Bottom-Up Troubleshooting and the OSI Model
Bottom-up troubleshooting is a good approach to use when a physical problem is suspected. Most networking problems reside at the lower levels, so implementing the bottom-up approach is often effective.
The disadvantage with the bottom-up troubleshooting approach is that it requires you to check every device and interface on the network until the possible cause of the problem is found. Remember that each conclusion and possibility must be documented, so there can be a lot of paperwork associated with this approach. A further challenge is determining which devices to start examining first.
Top-Down
As shown in Figure 12-13, top-down troubleshooting starts with the end-user applications and moves down through the layers of the OSI model until the cause of the problem has been identified.
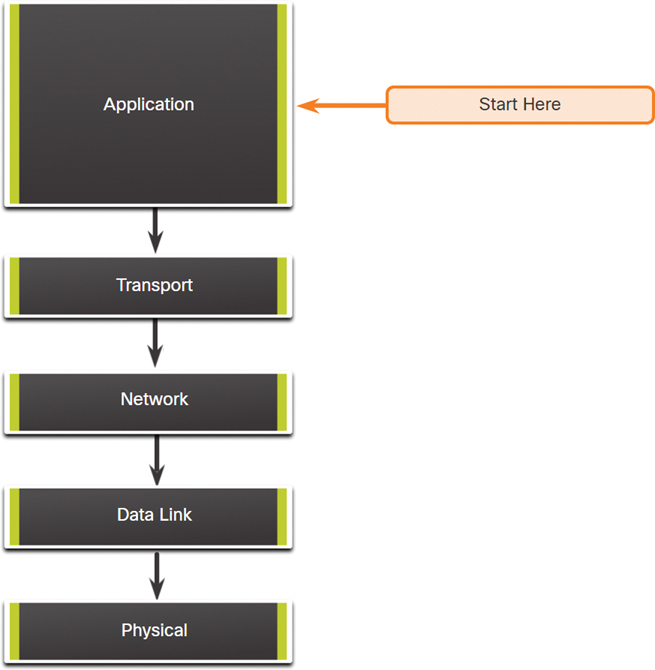
Figure 12-13 Top-Down Troubleshooting and the OSI Model
End-user applications of an end system are tested before the more specific networking pieces are tackled. Use this approach for simpler problems or when you think the problem is with a piece of software.
The disadvantage with the top-down approach is that it requires you to check every network application until the possible cause of the problem is found. Each conclusion and possibility must be documented. The challenge is to determine which application to start examining first.
Divide-and-Conquer
Figure 12-14 shows the divide-and-conquer approach to troubleshooting a networking problem.

Figure 12-14 Divide-and-Conquer Troubleshooting and the OSI Model
In divide-and-conquer troubleshooting, the network administrator selects a layer and tests in both directions from that layer. You start by collecting user experiences of the problem, document the symptoms, and then, using that information, make an informed guess about which OSI layer should be the starting point for your investigation. When a layer is verified to be functioning properly, it can be assumed that the layers below it are functioning. The administrator can work up the OSI layers. If an OSI layer is not functioning properly, the administrator can work down the OSI layer model. For example, if users cannot access the web server, but they can ping the server, then the problem is above Layer 3. If pinging the server is unsuccessful, then the problem is likely at a lower OSI layer.
Follow-the-Path
The follow-the-path approach is one of the most basic troubleshooting techniques. With this approach, you first discover the traffic path all the way from source to destination. The scope of troubleshooting is reduced to just the links and devices that are in the forwarding path. The objective is to eliminate the links and devices that are irrelevant to the troubleshooting task at hand. This approach usually complements one of the other approaches.
Substitution
The substitution approach is also called swap-the-component because you physically swap the problematic device with a known working one. If using the replacement device fixes the problem, you know the problem is with the removed device. If the problem remains, then the cause may be elsewhere.
In specific situations, this can be an ideal method for quick problem resolution, such as with a critical single point of failure. For example, if a border router goes down, it may be more beneficial to simply replace the device and restore service than to troubleshoot the issue.
If a problem lies within multiple devices, it may not be possible to correctly isolate the problem.
Comparison
The comparison approach is also called the spot-the-differences approach because it involves attempting to resolve the problem by changing the nonoperational elements to be consistent with the working ones. You compare configurations, software versions, hardware, or other device properties, links, or processes between working and nonworking situations and spot significant differences between them.
The weakness of this method is that it might lead to a working solution without clearly revealing the root cause of the problem.
Educated Guess
The educated guess approach is also called the shoot-from-the-hip troubleshooting approach. This is a less-structured troubleshooting method that involves making an educated guess based on the symptoms of the problem. The success of this method varies based on the administrator’s troubleshooting experience and ability. Seasoned technicians are more successful because they can rely on their extensive knowledge and experience to decisively isolate and solve network issues. With a less-experienced network administrator, this troubleshooting method may be more like random troubleshooting.
Guidelines for Selecting a Troubleshooting Method (12.2.7)
To quickly resolve network problems, take the time to select the most effective network troubleshooting method. Figure 12-15 illustrates which methods could be used when certain types of problem are discovered.
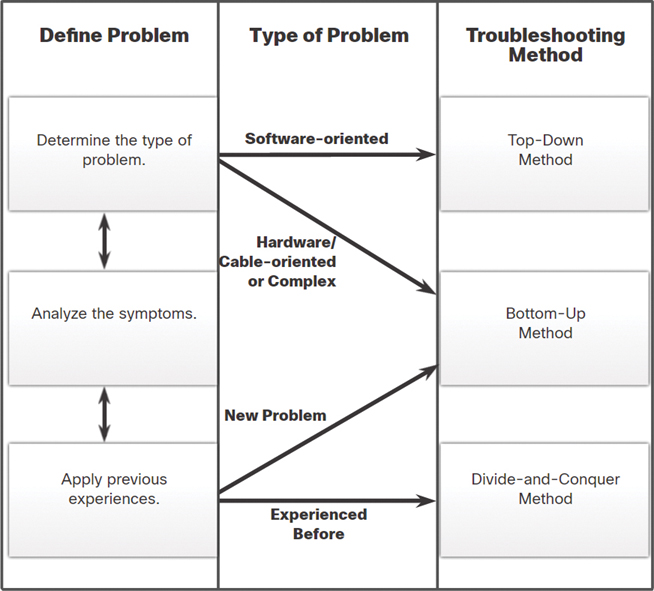
Figure 12-15 Flowchart for Selecting a Troubleshooting Method
For instance, software problems are often solved using a top-down approach, while hardware-based problems are often solved using the bottom-up approach. New problems may be solved by an experienced technician using the divide-and-conquer method. Otherwise, the bottom-up approach may be used.
Troubleshooting is a skill that is developed by doing it. Every network problem you identify and solve is added to your skill set.
Check Your Understanding—Troubleshooting Process (12.2.8)
Refer to the online course to complete this activity.
Troubleshooting Tools (12.3)
As you know, networks are made up of software and hardware. Therefore, troubleshooting tools are available for both software and hardware. In this section, you’ll learn about different networking troubleshooting tools.
Software Troubleshooting Tools (12.3.1)
A wide variety of software tools are available to make troubleshooting easier. These tools may be used to gather and analyze symptoms of network problems. They often provide monitoring and reporting functions that can be used to establish the network baseline.
Network Management System Tools
Network management system (NMS) tools include device-level monitoring, configuration, and fault-management tools. These tools can be used to investigate and correct network problems. Network monitoring software graphically displays a physical view of network devices, allowing network managers to monitor remote devices continuously and automatically. Device management software provides dynamic device status, statistics, and configuration information for key network devices. Search the internet for “NMS Tools” for more information.
Knowledge Bases
Online network device vendor knowledge bases have become indispensable sources of information. Between vendor-based knowledge bases and internet search engines, a network administrator has access to a vast pool of experience-based information.
For example, the Cisco Tools & Resources page can be found at http://www.cisco.com under the Support menu. This page provides tools that can be used for Cisco hardware and software.
Baselining Tools
Many tools for automating the network documentation and baselining process are available. Baselining tools help with common documentation tasks. For example, they can be used to draw network diagrams, help keep network software and hardware documentation up-to-date, and help to cost-effectively measure baseline network bandwidth use. Search the internet for “Network Performance Monitoring Tools” for more information.
Protocol Analyzers (12.3.2)
Protocol analyzers can be used to investigate the contents of packets while the packets are flowing through the network. A protocol analyzer decodes the various protocol layers in a recorded frame and presents this information in a relatively easy-to-use format. Figure 12-16 shows a screen capture of the Wireshark protocol analyzer.
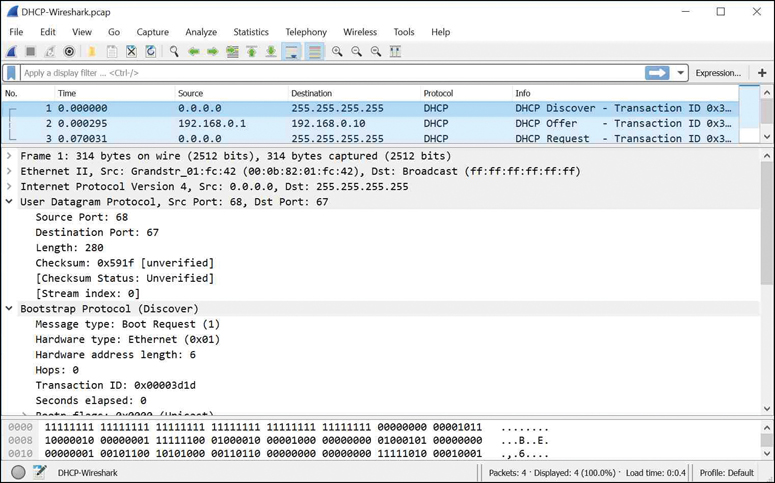
Figure 12-16 Wireshark Capture
The information displayed by a protocol analyzer includes the physical layer bit data, data link layer information, protocols, and descriptions of the frames. Most protocol analyzers can filter traffic that meets certain criteria so that all traffic to and from a device can be captured. Protocol analyzers such as Wireshark can help troubleshoot network performance problems. It is important to have both a good understanding of TCP/IP and how to use a protocol analyzer to inspect information at each TCP/IP layer.
Hardware Troubleshooting Tools (12.3.3)
There are multiple types of hardware troubleshooting tools. The following sections provide detailed descriptions of common hardware troubleshooting tools.
Digital Multimeters
Digital multimeters (DMMs), such as the Fluke 179 shown in Figure 12-17, are test instruments that are used to directly measure electrical voltage, current, and resistance values.

Figure 12-17 Fluke 179 Digital Multimeter
In network troubleshooting, most tests that would need a multimeter involve checking power supply voltage levels and verifying that network devices are receiving power.
Cable Testers
Cable testers are specialized handheld devices designed for testing the various types of data communication cabling. Figure 12-18 shows the Fluke LinkRunner AT Network Auto-Tester.

Figure 12-18 Fluke LinkRunner Cable Tester
Cable testers can be used to detect broken wires, crossed-over wiring, shorted connections, and improperly paired connections. These devices can be inexpensive continuity testers, moderately priced data cabling testers, or expensive time-domain reflectometers (TDRs). TDRs are used to pinpoint the distance to a break in a cable. These devices send signals along the cable and wait for them to be reflected. The time between sending the signal and receiving it back is converted into a distance measurement. The TDR function is normally packaged with data cabling testers. TDRs used to test fiber-optic cables are known as optical time-domain reflectometers (OTDRs).
Cable Analyzers
Cable analyzers, such as the Fluke DTX Cable Analyzer in Figure 12-19, are multifunctional handheld devices that are used to test and certify copper and fiber cables for different services and standards.

Figure 12-19 Fluke DTX Cable Analyzer
More sophisticated tools include advanced troubleshooting diagnostics that measure the distance to a performance defect such as near-end crosstalk (NEXT) or return loss (RL), identify corrective actions, and graphically display crosstalk and impedance behavior. Cable analyzers also typically include PC-based software. After field data is collected, the data from the handheld device can be uploaded so that the network administrator can create up-to-date reports.
Portable Network Analyzers
Portable network analyzers like the Fluke OptiView, shown in Figure 12-20, are used for troubleshooting switched networks and VLANs.

Figure 12-20 Fluke OptiView Portable Network Analyzer
By plugging in a network analyzer anywhere on a network, a network engineer can see the switch port to which the device is connected and the average and peak utilization. The analyzer can also be used to discover VLAN configuration, identify top network talkers (hosts generating the most traffic), analyze network traffic, and view interface details. Such a device can typically output to a PC that has network monitoring software installed for further analysis and troubleshooting.
Cisco Prime NAM
The Cisco Prime Network Analysis Module (NAM) portfolio, shown in Figure 12-21, includes hardware and software for performance analysis in switching and routing environments. The figure displays a Cisco Nexus 7000 Series NAM, a Cisco Catalyst 65xx Series NAM, a Cisco Prime NAM 2300 Series appliance, a Cisco Prime Virtual NAM (vNAM), a Cisco Prime NAM for Cisco Nexus 1110, and a Cisco Prime NAM for ISR G2 SRE.
The NAM includes an embedded browser-based interface that generates reports on the traffic that consumes critical network resources. In addition, the NAM can capture and decode packets and track response times to pinpoint an application problem to a network or server.

Figure 12-21 Cisco Prime Network Analysis Module Portfolio
Syslog Server as a Troubleshooting Tool (12.3.4)
Syslog is a simple protocol used by an IP device known as a syslog client to send text-based log messages to another IP device, the syslog server. Syslog is currently defined in RFC 5424.
Implementing a logging facility is an important part of network security and for network troubleshooting. Cisco devices can log information regarding configuration changes, ACL violations, interface status, and many other types of events. Cisco devices can send log messages to several different facilities. Event messages can be sent to one or more of the following:
Console: Console logging is on by default. Messages log to the console and can be viewed when modifying or testing the router or switch using terminal emulation software while connected to the console port of the network device.
Terminal lines: Enabled EXEC sessions can be configured to receive log messages on any terminal lines. Like console logging, this type of logging is not stored by the network device and, therefore, is valuable only to the user on that line.
Buffered logging: Buffered logging can be useful as a troubleshooting tool because log messages are stored in memory for a time. However, log messages are cleared when the device is rebooted.
SNMP traps: Certain thresholds can be preconfigured on routers and other devices. Router events such as exceeding a threshold can be processed by the router and forwarded as SNMP traps to an external SNMP network management station. SNMP traps are a viable security logging facility but require the configuration and maintenance of an SNMP system.
Syslog: Cisco routers and switches can be configured to forward log messages to an external syslog service. This service can reside on any number of servers or workstations, including Microsoft Windows and Linux-based systems. Syslog is the most popular message logging facility because it provides long-term log storage capabilities and a central location for all router messages.
Cisco IOS log messages fall into one of eight levels, as shown in Table 12-4.
Table 12-4 Cisco IOS Log Message Severity Levels
|
Level |
Keyword |
Description |
Definition |
Highest level |
0 |
Emergencies |
System is unusable |
LOG_EMERG |
1 |
Alerts |
Immediate action is needed |
LOG_ALERT |
|
2 |
Critical |
Critical conditions exist |
LOG_CRIT |
|
3 |
Errors |
Error conditions exist |
LOG_ERR |
|
4 |
Warnings |
Warning conditions exist |
LOG_WARNING |
|
Lowest level |
5 |
Notifications |
Normal (but significant) condition |
LOG_NOTICE |
6 |
Informational |
Informational messages only |
LOG_NFO |
|
7 |
Debugging |
Debugging messages |
LOG_DEBUG |
The lower the level number, the higher the severity level. By default, all messages from level 0 to 7 are logged to the console. While the ability to view logs on a central syslog server is helpful in troubleshooting, sifting through a large amount of data can be an overwhelming task. The logging trap level command (where level is the name or number of the severity level) limits messages logged to the syslog server based on severity. Only messages equal to or numerically lower than the specified level are logged.
In the command output in Example 12-1, system messages from level 0 (emergencies) to 5 (notifications) are sent to the syslog server at 209.165.200.225.
Example 12-1 Configuring Syslog Traps
R1(config)# logging host 209.165.200.225
R1(config)# logging trap notifications
R1(config)# logging on
R1(config)#
Check Your Understanding—Troubleshooting Tools (12.3.5)
Refer to the online course to complete this activity.
Symptoms and Causes of Network Problems (12.4)
Now that you have your documentation, some knowledge of troubleshooting methods, and the software and hardware tools to use to diagnose problems, you are ready to start troubleshooting! This section covers the most common issues that you will find when troubleshooting a network. In it, you will learn how to determine the symptoms and causes of network problems using a layered model.
Physical Layer Troubleshooting (12.4.1)
Issues on a network often present as performance problems. A performance problem means that there is a difference between the expected behavior and the observed behavior, and the system is not functioning as could be reasonably expected. Failures and suboptimal conditions at the physical layer not only inconvenience users but can impact the productivity of the entire company. Networks that experience these kinds of conditions usually shut down. Because the upper layers of the OSI model depend on the physical layer to function, a network administrator must be able to effectively isolate and correct problems at this layer.
Figure 12-22 summarizes the symptoms and causes of physical layer network problems.
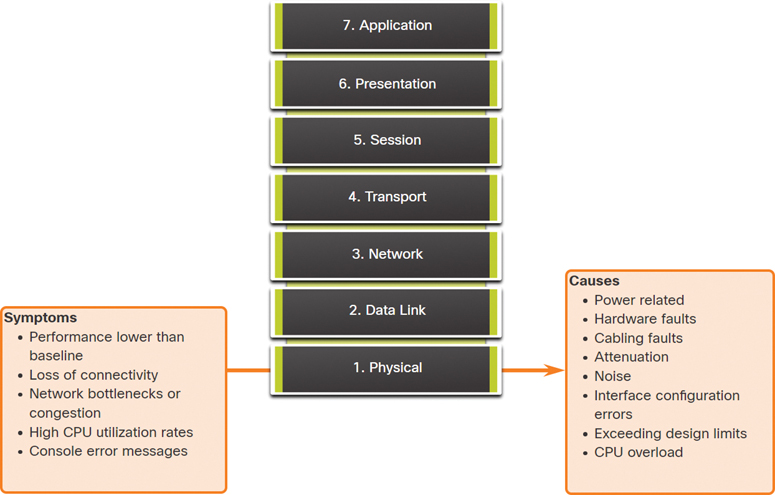
Figure 12-22 Physical Layer Symptoms and Causes
Table 12-5 lists common symptoms of physical layer network problems.
Table 12-5 Physical Layer Symptoms
Symptom |
Description |
Performance lower than baseline |
|
Loss of connectivity |
|
Network bottlenecks or congestion |
|
High CPU utilization rates |
|
Console error messages |
|
Table 12-6 lists issues that commonly cause network problems at the physical layer.
Table 12-6 Physical Layer Causes
Problem Cause |
Description |
Power related |
|
Hardware faults |
|
Cabling faults |
|
|
|
Noise |
|
Interface configuration errors |
|
Exceeding design limits |
|
CPU overload |
|
Data Link Layer Troubleshooting (12.4.2)
Troubleshooting Layer 2 problems can be a challenging process. The configuration and operation of these protocols are critical to creating a functional, well-tuned network. Layer 2 problems cause specific symptoms that, when recognized, can help identify the problem quickly.
Figure 12-23 summarizes the symptoms and causes of data link layer network problems.
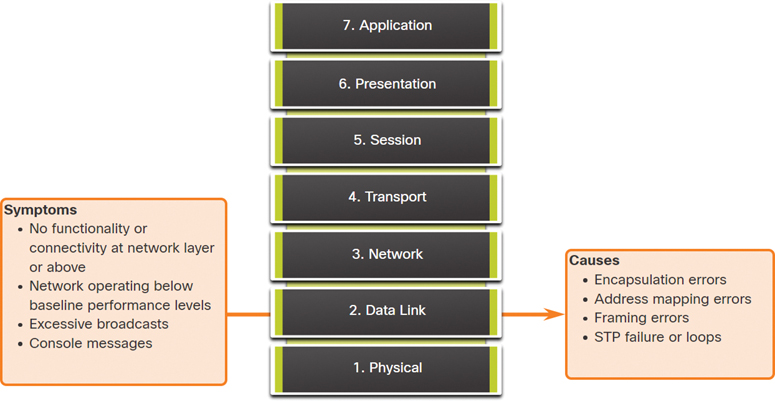
Figure 12-23 Data Link Layer Symptoms and Causes
Table 12-7 lists common symptoms of data link layer network problems.
Table 12-7 Data Link Layer Symptoms
Symptom |
Description |
No functionality or connectivity at the network layer or above |
|
Network is operating below baseline performance levels |
|
Excessive broadcasts |
|
Console messages |
|
Table 12-8 lists issues that commonly cause network problems at the data link layer.
Table 12-8 Data Link Layer Causes
Problem Cause |
Description |
Encapsulation errors |
|
Address mapping errors |
|
Framing errors |
|
STP failures or loops |
|
Network Layer Troubleshooting (12.4.3)
Network layer problems include any problem that involves a Layer 3 protocol, such as IPv4, IPv6, EIGRP, OSPF, and so on. Figure 12-24 summarizes the symptoms and causes of network layer network problems.

Figure 12-24 Network Layer Symptoms and Causes
Table 12-9 lists common symptoms of network layer network problems.
Table 12-9 Network Layer Symptoms
Symptom |
Description |
Network failure |
|
Suboptimal performance |
|
In most networks, static routes are used in combination with dynamic routing protocols. Improper configuration of static routes can lead to less-than-optimal routing. In some cases, improperly configured static routes can create routing loops that make parts of the network unreachable.
Troubleshooting dynamic routing protocols requires a thorough understanding of how the specific routing protocols function. Some problems are common to all routing protocols, while other problems are particular to an individual routing protocol.
There is no single template for solving Layer 3 problems. Routing problems are solved with a methodical process, using a series of commands to isolate and diagnose the problems.
Table 12-10 lists areas to explore when diagnosing Layer 3 routing protocol problems.
Table 12-10 Layer 3 Routing Protocol Causes
Problem Cause |
Description |
General network issues |
|
Connectivity issues |
|
Routing table |
|
Neighbor issues |
|
Topology database |
|
Transport Layer Troubleshooting—ACLs (12.4.4)
Network problems can arise from transport layer problems on a router, particularly at the edge of the network, where traffic is examined and modified. For instance, both access control lists (ACLs) and Network Address Translation (NAT) operate at the network layer and may involve operations at the transport layer, as shown in Figure 12-25.
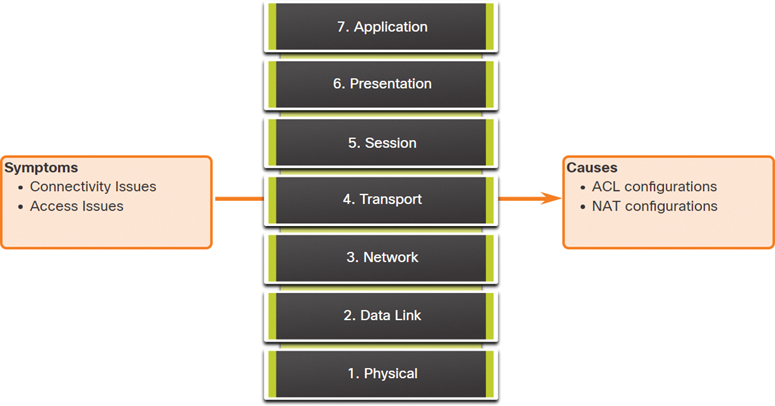
Figure 12-25 Transport Layer—ACL Symptoms and Causes
The most common issues with ACLs are caused by improper configuration, as shown in Figure 12-26.

Figure 12-26 Transport Layer—Common ACL Misconfigurations
Problems with ACLs may cause otherwise working systems to fail. Table 12-11 lists areas where misconfigurations commonly occur.
Table 12-11 Transport Layer—ACL Misconfigurations
Misconfiguration |
Description |
Selection of traffic flow |
|
Order of access control entries |
|
Implicit deny any |
|
Addresses and IPv4 wildcard masks |
|
Selection of transport layer protocol |
|
Source and destination ports |
|
Use of the established keyword |
|
Uncommon protocols |
|
The log keyword is a useful command for viewing ACL operation on ACL entries. This keyword instructs the router to place an entry in the system log whenever that entry condition is matched. The logged event includes details of the packet that matched the ACL element. The log keyword is especially useful for troubleshooting and provides information on intrusion attempts being blocked by the ACL.
Transport Layer Troubleshooting—NAT for IPv4 (12.4.5)
There are several problems with NAT, such as not interacting with services like DHCP and tunneling. These issues can include misconfigured NAT inside, NAT outside, or ACLs. Other issues include interoperability with other network technologies, especially those that contain or derive information from host network addressing in the packet.
Figure 12-27 summarizes common interoperability areas with NAT.

Figure 12-27 Transport Layer—Common Interoperability Areas with NAT
Table 12-12 lists common interoperability areas with NAT.
Table 12-12 Transport Layer Common Interoperability Areas
Protocol |
Description |
BOOTP and DHCP |
|
DNS |
|
SNMP |
|
Tunneling and encryption protocols |
|
Application Layer Troubleshooting (12.4.6)
Most of the application layer protocols provide user services. Application layer protocols are typically used for network management, file transfer, distributed file services, terminal emulation, and email. New user services are often added, such as VPNs and VoIP.
Figure 12-28 shows the most widely known and implemented TCP/IP application layer protocols.

Figure 12-28 Common TCP/IP Application Layer Protocols
Table 12-13 provides a short description of each of these application layer protocols.
Table 12-13 Application Layer Protocols
Protocol |
Description |
SSH/Telnet |
Enables users to establish terminal session connections with remote hosts. |
HTTP |
Supports the exchange of text, graphic images, sound, video, and other multimedia files on the web. |
FTP |
Performs interactive file transfers between hosts. |
TFTP |
Performs basic interactive file transfers, typically between hosts and networking devices. |
SMTP |
Supports basic message delivery services. |
POP |
Connects to mail servers and downloads email. |
SNMP |
Collects management information from network devices. |
DNS |
Maps IP addresses to the names assigned to network devices. |
Network File System (NFS) |
Enables computers to mount drives on remote hosts and operate them as if they were local drives. Originally developed by Sun Microsystems, it combines with two other application layer protocols, External Data Representation (XDR) and Remote Procedure Call (RPC), to allow transparent access to remote network resources. |
The types of symptoms and causes depend on the application.
Application layer problems prevent services from being provided to application programs. A problem at the application layer can result in unreachable or unusable resources when the physical, data link, network, and transport layers are functional. It is possible to have full network connectivity but still see an application be unable to provide data.
Another type of problem at the application layer occurs when the physical, data link, network, and transport layers are functional, but the data transfer and requests for network services from a single network service or application do not meet the normal expectations of a user.
A problem at the application layer may cause users to complain that the network or an application that they are working with is sluggish or slower than usual when transferring data or requesting network services.
Check Your Understanding—Symptoms and Causes of Network Problems (12.4.7)
Refer to the online course to complete this activity.
Troubleshooting IP Connectivity (12.5)
In this section, you will troubleshoot a network using the layered model.
Components of Troubleshooting End-to-End Connectivity (12.5.1)
This section presents a single topology and the tools to diagnose (and in some cases solve) end-to-end connectivity problems. Diagnosing and solving problems is an essential skill for network administrators. There is no single recipe for troubleshooting, and a problem can be diagnosed in many ways. However, by employing a structured approach to the troubleshooting process, an administrator can reduce the time it takes to diagnose and solve a problem.
Throughout this section, the following scenario is used: The client host PC1 is unable to access applications on server SRV1 or server SRV2. Figure 12-29 shows the topology of this network. PC1 uses SLAAC with EUI-64 to create its IPv6 global unicast address. EUI-64 creates the interface ID using the Ethernet MAC address, inserting FFFE in the middle, and flipping the seventh bit.

Figure 12-29 Troubleshooting Reference Topology
When there is no end-to-end connectivity, the administrator may choose to troubleshoot with a bottom-up approach and take the following common steps:
Step 1. Check physical connectivity at the point where network communication stops. This includes cables and hardware. The problem might be with a faulty cable or interface, or it might involve misconfigured or faulty hardware.
Step 2. Check for duplex mismatches.
Step 3. Check data link and network layer addressing on the local network. This includes IPv4 ARP tables, IPv6 neighbor tables, MAC address tables, and VLAN assignments.
Step 4. Verify that the default gateway is correct.
Step 5. Ensure that devices are determining the correct path from the source to the destination. Manipulate the routing information, if necessary.
Step 6. Verify that the transport layer is functioning properly. Telnet can also be used to test transport layer connections from the command line.
Step 7. Verify that there are no ACLs blocking traffic.
Step 8. Ensure that DNS settings are correct. There should be a DNS server that is accessible.
The outcome of this process is operational, end-to-end connectivity. If all the steps have been performed without any resolution, the network administrator may either want to repeat these steps or escalate the problem to a senior administrator.
End-to-End Connectivity Problem Initiates Troubleshooting (12.5.2)
Usually what prompts a troubleshooting effort is the discovery that there is a problem with end-to-end connectivity. Two of the most common utilities used to verify a problem with end-to-end connectivity are ping and traceroute, as shown in Figure 12-30.
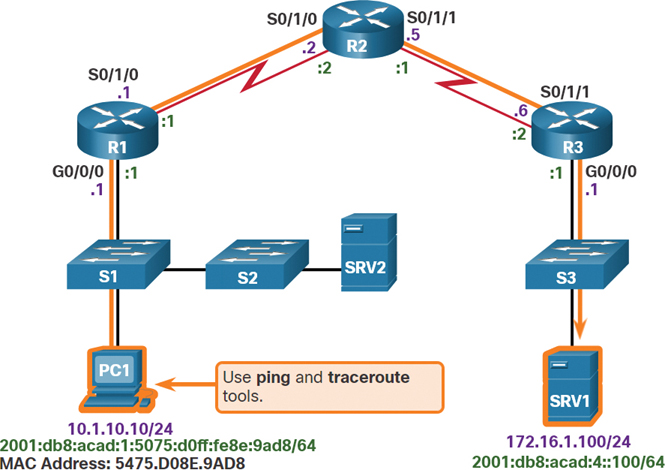
Figure 12-30 ping and traceroute from PC1 to SRV1
IPv4 ping
ping is probably the most widely known connectivity-testing utility in networking and has always been part of Cisco IOS software. It sends out requests for responses from a specified host address. The ping command uses a Layer 3 protocol called ICMP that is a part of the TCP/IP suite. ping uses the ICMP echo request and ICMP echo reply packets. If the host at the specified address receives the ICMP echo request, it responds with an ICMP echo reply packet. ping can be used to verify end-to-end connectivity for both IPv4 and IPv6. The command output in Example 12-2 shows a successful ping from PC1 to SRV1, at address 172.16.1.100.
Example 12-2 Successful IPv4 ping
C:> ping 172.16.1.100
Pinging 172.16.1.100 with 32 bytes of data:
Reply from 172.16.1.100: bytes=32 time=199ms TTL=128
Reply from 172.16.1.100: bytes=32 time=193ms TTL=128
Reply from 172.16.1.100: bytes=32 time=194ms TTL=128
Reply from 172.16.1.100: bytes=32 time=196ms TTL=128
Ping statistics for 172.16.1.100:
    Packets: Sent = 4, Received = 4, Lost = 0 (0% loss),
Approximate round trip times in milli-seconds:
    Minimum = 193ms, Maximum = 199ms, Average = 195ms
C:>
IPv4 traceroute
Like the ping command, the Cisco IOS traceroute command can be used for both IPv4 and IPv6. The tracert command is used with Windows operating systems. The trace generates a list of hops, router IP addresses, and the destination IP addresses that are successfully reached along the path. This list provides important verification and troubleshooting information. If the data reaches the destination, the trace lists the interface on every router in the path. If the data fails at some hop along the way, the address of the last router that responded to the trace is known. This address provides an indication of where the problem or security restrictions reside.
The tracert output in Example 12-3 illustrates the path the IPv4 packets take to reach their destination.
Example 12-3 Successful IPv4 traceroute
C:> tracert 172.16.1.100
Tracing route to 172.16.1.100 over a maximum of 30 hops:
  1     1 ms    <1 ms    <1 ms  10.1.10.1
  2     2 ms     2 ms     1 ms  192.168.1.2
  3     2 ms     2 ms     1 ms  192.168.1.6
  4     2 ms     2 ms     1 ms  172.16.1.100
Trace complete.
C:>
IPv6 ping and traceroute
When using the ping and traceroute utilities, Cisco IOS recognizes whether an address is an IPv4 or IPv6 address and uses the appropriate protocol to test connectivity. The command output in Example 12-4 shows the ping and traceroute commands on router R1 used to test IPv6 connectivity.
Example 12-4 Successful IPv6 ping and traceroute
R1# ping 2001:db8:acad:4::100
Type escape sequence to abort.
Sending 5, 100-byte ICMP Echos to 2001:DB8:ACAD:4::100, timeout is 2 seconds:
!!!!!
Success rate is 100 percent (5/5), round-trip min/avg/max = 56/56/56 ms
R1#
R1# traceroute 2001:db8:acad:4::100
Type escape sequence to abort.
Tracing the route to 2001:DB8:ACAD:4::100
1.   2001:DB8:ACAD:2::2 20 msec 20 msec 20 msec
2.   2001:DB8:ACAD:3::2 44 msec 40 msec 40 msec
R1#
Note
The traceroute command is commonly performed when the ping command fails. If ping succeeds, the traceroute command is commonly not needed because the technician knows that connectivity exists.
Step 1—Verify the Physical Layer (12.5.3)
All network devices are specialized computer systems. At a minimum, these devices consist of a CPU, RAM, and storage space, allowing the device to boot and run the operating system and interfaces. This allows for the reception and transmission of network traffic. When a network administrator determines that a problem exists on a given device, and that problem might be hardware related, it is worthwhile to verify the operation of these generic components. The Cisco IOS commands most commonly used for this purpose are show processes cpu, show memory, and show interfaces. This section discusses the show interfaces command.
When troubleshooting performance-related issues and hardware are suspected to be at fault, the show interfaces command can be used to verify the interfaces through which the traffic passes.
Example 12-5 provides command output of the show interfaces command.
Example 12-5 The show interfaces Command
R1# show interfaces GigabitEthernet 0/0/0
GigabitEthernet0/0/0 is up, line protocol is up
Hardware is CN Gigabit Ethernet, address is d48c.b5ce.a0c0(bia d48c.b5ce.a0c0)
Internet address is 10.1.10.1/24
(Output omitted)
Input queue: 0/75/0/0 (size/max/drops/flushes); Total output drops: 0
Queueing strategy: fifo
 Output queue: 0/40 (size/max)
5 minute input rate 0 bits/sec, 0 packets/sec
5 minute output rate 0 bits/sec, 0 packets/sec
85 packets input, 7711 bytes, 0 no buffer
Received 25 broadcasts (0 IP multicasts)
0 runts, 0 giants, 0 throttles
0 input errors, 0 CRC, 0 frame, 0 overrun, 0 ignored
0 watchdog, 5 multicast, 0 pause input
10112 packets output, 922864 bytes, 0 underruns
0 output errors, 0 collisions, l interface resets
11 unknown protocol drops
0 babbles, 0 late collision, 0 deferred
0 lost carrier, 0 no carrier, 0 pause output
0 output buffer failures, 0 output buffers swapped out
R1#
Input Queue Drops
Input queue drops (and the related ignored and throttle counters) signify that, at some point, more traffic was delivered to the router than it could process. This does not necessarily indicate a problem. It could be normal traffic during peak periods. However, it could also be an indication that the CPU cannot process packets in time, so if this number is consistently high, it is worth trying to spot at which moments these counters are increasing and how this information relates to CPU usage.
Output Queue Drops
Output queue drops indicate that packets were dropped due to congestion on the interface. Seeing output drops is normal for any point where the aggregate input traffic is higher than the output traffic. During peak traffic periods, packets are dropped if traffic is delivered to the interface faster than it can be sent out. However, even if this is considered normal behavior, it leads to packet drops and queuing delays, so applications that are sensitive to those issues, such as VoIP, might suffer from performance issues. Consistent output queue drops can be an indicator that an advanced queuing mechanism is required or the current QoS setting should be modified.
Input Errors
Input errors are errors that are experienced during the reception of a frame, such as CRC errors. High numbers of CRC errors could indicate cabling problems, interface hardware problems, or, in an Ethernet-based network, duplex mismatches.
Output Errors
Output errors indicate errors, such as collisions, that occur during the transmission of a frame. In most Ethernet-based networks today, full-duplex transmission is the norm, and half-duplex transmission is the exception. In full-duplex transmission, operation collisions cannot occur; therefore, collisions (especially late collisions) often indicate duplex mismatches.
Step 2—Check for Duplex Mismatches (12.5.4)
A common cause of interface errors is mismatched duplex mode between two ends of an Ethernet link. In many Ethernet-based networks, point-to-point connections are now the norm, and the use of hubs and the associated half-duplex operation is becoming less common. This means that most Ethernet links today operate in full-duplex mode, and while collisions were normal for Ethernet links, collisions today often indicate that duplex negotiation has failed or that the link is not operating in the correct duplex mode.
The IEEE 802.3ab Gigabit Ethernet standard mandates the use of autonegotiation for speed and duplex. In addition, although it is not strictly mandatory, practically all Fast Ethernet NICs also use autonegotiation by default. The use of autonegotiation for speed and duplex is the current recommended practice.
However, if duplex negotiation fails for some reason, it might be necessary to set the speed and duplex manually on both ends. Typically, this would mean setting the duplex mode to full-duplex on both ends of the connection. If this does not work, running half-duplex on both ends is preferred over a duplex mismatch.
Duplex configuration guidelines include the following:
Autonegotiation of speed and duplex is recommended.
If autonegotiation fails, manually set the speed and duplex on interconnecting ends.
Point-to-point Ethernet links should always run in full-duplex mode.
Half-duplex is uncommon and typically encountered only when legacy hubs are used.
Troubleshooting Example
In the previous scenario, the network administrator needed to add additional users to the network. To incorporate these new users, the network administrator installed a second switch and connected it to the first one. Soon after S2 was added to the network, users on both switches began experiencing significant performance problems connecting with devices on the other switch, as shown in Figure 12-31.

Figure 12-31 Topology for Duplex Scenario
The network administrator notices a console message on switch S2:
*Mar 1 00:45:08.756: %CDP-4-DUPLEX_MISMATCH: duplex mismatch discovered on FastEth-
  ernet0/20 (not half duplex), with Switch FastEthernet0/20 (half duplex).
Using the show interfaces fa 0/20 command, the network administrator examines the interface on S1 that is used to connect to S2 and notices that it is set to full-duplex, as shown in the command output in Example 12-6.
Example 12-6 Checking Duplex Mode on S1 Fa0/20
S1# show interface fa 0/20
FastEthernet0/20 is up, line protocol is up (connected)
Hardware is Fast Ethernet, address is 0cd9.96e8.8a01 (bia 0cd9.96e8.8a01)
MTU 1500 bytes, BW 10000 Kbit/sec, DLY 1000 usec, reliability 255/255, txload
  1/255, rxload 1/255
Encapsulation ARPA, loopback not set Keepalive set (10 sec)
Full-duplex, Auto-speed, media type is 10/100BaseTX

(Output omitted)
S1#
The network administrator now examines the other side of the connection, the port on S2. The command output in Example 12-7 shows that this side of the connection has been configured for half-duplex.
Example 12-7 Checking Duplex Mode on S2 Fa0/20
S2# show interface fa 0/20
FastEthernet0/20 is up, line protocol is up (connected)
Hardware is Fast Ethernet, address is 0cd9.96d2.4001 (bia 0cd9.96d2.4001)
MTU 1500 bytes, BW 100000 Kbit/sec, DLY 100 usec, reliability 255/255, txload
  1/255, rxload 1/255
Encapsulation ARPA, loopback not set Keepalive set (10 sec)
Half-duplex, Auto-speed, media type is 10/100BaseTX

(Output omitted)

S2(config)# interface fa 0/20
S2(config-if)# duplex auto
S2(config-if)#
The network administrator corrects the setting to duplex auto to automatically negotiate the duplex. Because the port on S1 is set to full-duplex, S2 also uses full-duplex.
The users report that there are no longer any performance problems.
Step 3—Verify Addressing on the Local Network (12.5.5)
When troubleshooting end-to-end connectivity, it is useful to verify mappings between destination IP addresses and Layer 2 Ethernet addresses on individual segments. In IPv4, this functionality is provided by ARP. In IPv6, the ARP functionality is replaced by the neighbor discovery process and ICMPv6. The neighbor table caches IPv6 addresses and their resolved Ethernet physical (MAC) addresses.
This section provides an example and explanation of the commands used to verify Layer 2 and Layer 3 addressing.
Windows IPv4 ARP Table
The arp Windows command displays and modifies entries in the ARP cache that are used to store IPv4 addresses and their resolved Ethernet physical (MAC) addresses. As shown in the command output in Example 12-8, the arp Windows command lists all devices that are currently in the ARP cache.
Example 12-8 Windows IPv4 ARP Table
C:> arp -a
Interface: 10.1.10.100 --- 0xd
  Internet Address      Physical Address      Type
  10.1.10.1             d4-8c-b5-ce-a0-c0     dynamic
  224.0.0.22            01-00-5e-00-00-16     static
  224.0.0.251           01-00-5e-00-00-fb     static
  239.255.255.250       01-00-5e-7f-ff-fa     static
  255.255.255.255       ff-ff-ff-ff-ff-ff     static
C:>
The information that is displayed for each device includes the IPv4 address, the physical (MAC) address, and the type of addressing (static or dynamic).
To repopulate the cache with updated information, the cache can be cleared by using the arp -d Windows command.
Note
The arp commands in Linux and Mac OS X have similar syntax.
Windows IPv6 Neighbor Table
The netsh interface ipv6 show neighbor Windows command output in Example 12-9 lists all devices that are currently in the neighbor table.
Example 12-9 Windows IPv5 Neighbor Table
C:> netsh interface ipv6 show neighbor
Internet Address                             Physical Address   Type
-------------------------------------------  -----------------  -----------
fe80::9657:a5ff:fe0c:5b02                    94-57-a5-0c-5b-02  Stale
fe80::1                                      d4-8c-b5-ce-a0-c0  Reachable (Router)
ff02::1                                      33-33-00-00-00-01  Permanent
ff02::2                                      33-33-00-00-00-02  Permanent
ff02::16                                     33-33-00-00-00-16  Permanent
ff02::1:2                                    33-33-00-01-00-02  Permanent
ff02::1:3                                    33-33-00-01-00-03  Permanent
ff02::1:ff0c:5b02                            33-33-ff-0c-5b-02  Permanent
ff02::1:ff2d:a75e                            33-33-ff-2d-a7-5e  Permanent
The information that is displayed for each device includes the IPv6 address, the physical (MAC) address, and the type of addressing. By examining the neighbor table, the network administrator can verify that destination IPv6 addresses map to correct Ethernet addresses. The IPv6 link-local addresses on all interfaces of R1 have been manually configured to fe80::1. Similarly, R2 has been configured with the link-local address fe80::2 on its interfaces, and R3 has been configured with the link-local address fe80::3 on its interfaces. Remember, link-local addresses must be unique on the link or network.
Note
The neighbor table for Linux and Mac OS X can be displayed by using ip neigh show command.
IOS IPv6 Neighbor Table
The show ipv6 neighbors command output in Example 12-10 shows an example of the neighbor table on a Cisco IOS router.
Note
The neighbor states for IPv6 are more complex than the ARP table states in IPv4. For more information, see RFC 4861.
Example 12-10 IOS IPv6 Neighbor Table
R1# show ipv6 neighbors
IPv6 Address                        Age  Link-layer Addr   State  Interface
FE80::21E:7AFF:FE79:7A81              8   001e.7a79.7a81    STALE  Gi0/0
2001:DB8:ACAD:1:5075:D0FF:FE8E:9AD8   0   5475.d08e.9ad8    REACH  Gi0/0
R1#
Switch MAC Address Table
When a destination MAC address is found in the switch MAC address table, the switch forwards the frame only to the port of the device that has that MAC address. To do this, the switch consults its MAC address table. The MAC address table lists the MAC address connected to each port. Use the show mac address-table command to display the MAC address table on the switch (see Example 12-11).
Example 12-11 Switch MAC Address Table
S1# show mac address-table
              Mac Address Table
--------------------------------------------
Vlan      Mac Address         Type     Ports
All       0100.0ccc.cccc      STATIC   CPU
All       0100.0ccc.cccd      STATIC   CPU
10        d48c.b5ce.a0c0      DYNAMIC  Fa0/4
10        000f.34f9.9201      DYNAMIC  Fa0/5
10        5475.d08e.9ad8      DYNAMIC  Fa0/13
Total Mac Addresses for this criterion: 5
S1#
Notice that the MAC address for PC1, a device in VLAN 10, has been discovered along with the S1 switch port to which PC1 attaches. Remember that the MAC address table of a switch only contains Layer 2 information, including the Ethernet MAC address and the port number. IP address information is not included.
Troubleshoot VLAN Assignment Example (12.5.6)
Another issue to consider when troubleshooting end-to-end connectivity is VLAN assignment. In a switched network, each port in a switch belongs to a VLAN. Each VLAN is considered a separate logical network, and packets destined for stations that do not belong to the VLAN must be forwarded through a device that supports routing. If a host in one VLAN sends a broadcast Ethernet frame, such as an ARP request, all hosts in the same VLAN receive the frame; hosts in other VLANs do not. Even if two hosts are in the same IP network, they will not be able to communicate if they are connected to ports assigned to two separate VLANs. In addition, if the VLAN to which a port belongs is deleted, the port becomes inactive. All hosts attached to ports belonging to the VLAN that was deleted are unable to communicate with the rest of the network. Commands such as show vlan can be used to validate VLAN assignments on a switch.
Say, for example, that in an effort to improve the wire management in the wiring closet, your company has reorganized the cables connected to switch S1. Almost immediately afterward, users start calling the support desk, stating that they can no longer reach devices outside their own network.
This section provides an explanation of the process used to troubleshoot this issue.
Check the ARP Table
An examination of the PC1 ARP table using the arp Windows command shows that the ARP table no longer contains an entry for the default gateway 10.1.10.1, as shown in the command output in Example 12-12.
Example 12-12 Checking the ARP Table
C:> arp -a
Interface: 10.1.10.100 --- 0xd
  Internet Address      Physical Address      Type
  224.0.0.22            01-00-5e-00-00-16     static
  224.0.0.251           01-00-5e-00-00-fb     static
  239.255.255.250       01-00-5e-7f-ff-fa     static
  255.255.255.255       ff-ff-ff-ff-ff-ff     static
C:>
Check the Switch MAC Table
There were no configuration changes on the router, so S1 is the focus of the troubleshooting. The MAC address table for S1, as shown in Example 12-13, indicates that the MAC address for R1 is on a different VLAN than the rest of the 10.1.10.0/24 devices, including PC1.
Example 12-13 Checking the Switch’s MAC Table
S1# show mac address-table
              Mac Address Table
--------------------------------------------
Vlan      Mac Address         Type     Ports
All       0100.0ccc.cccc      STATIC   CPU
All       0100.0ccc.cccd      STATIC   CPU
 1        d48c.b5ce.a0c0      DYNAMIC  Fa0/1
10        000f.34f9.9201      DYNAMIC  Fa0/5
10        5475.d08e.9ad8      DYNAMIC  Fa0/13
Total Mac Addresses for this criterion: 5
S1#
Correct the VLAN Assignment
During the recabling, the patch cable for R1 was moved from Fa 0/4 on VLAN 10 to Fa 0/1 on VLAN 1. When the network administrator configures the Fa 0/1 port of S1 to be on VLAN 10, as shown in Example 12-14, the problem is resolved. The MAC address table now shows VLAN 10 for the MAC address of R1 on port Fa 0/1.
Example 12-14 Correcting the VLAN Assignment
S1(config)# interface fa0/1
S1(config-if)# switchport mode access
S1(config-if)# switchport access vlan 10
S1(config-if)# exit
S1#
S1# show mac address-table
               Mac Address Table
--------------------------------------------
Vlan      Mac Address         Type     Ports
All       0100.0ccc.cccc      STATIC   CPU
All       0100.0ccc.cccd      STATIC   CPU
10        d48c.b5ce.a0c0      DYNAMIC  Fa0/1
10        000f.34f9.9201      DYNAMIC  Fa0/5
10        5475.d08e.9ad8      DYNAMIC  Fa0/13
Total Mac Addresses for this criterion: 5
S1#
Step 4—Verify Default Gateway (12.5.7)
If there is no detailed route on a router, or if a host is configured with the wrong default gateway, then communication between two endpoints in different networks does not work. Figure 12-32 illustrates how PC1 uses R1 as its default gateway.

Figure 12-32 PC1 and R1 Default Gateways
Similarly, R1 uses R2 as its default gateway or gateway of last resort. If a host needs access to resources beyond the local network, the default gateway must be configured. The default gateway is the first router on the path to destinations beyond the local network.
Troubleshooting IPv4 Default Gateway Example
In this example, R1 has the correct default gateway, which is the IPv4 address of R2. However, PC1 has the wrong default gateway. PC1 should have the default gateway of R1, 10.1.10.1. This must be configured manually if the IPv4 addressing information was manually configured on PC1. If the IPv4 addressing information was obtained automatically from a DHCPv4 server, then the configuration on the DHCP server must be examined. A configuration problem on a DHCP server usually affects multiple clients.
R1 Routing Table
The command output of the show ip route Cisco IOS command is used to verify the default gateway of R1, as shown in Example 12-15.
Example 12-15 R1’s Routing Table
R1# show ip route | include Gateway|0.0.0.0

Gateway of last resort is 192.168.1.2 to network 0.0.0.0
S* 0.0.0.0/0 [1/0] via 192.168.1.2

R1#
PC1 Routing Table
On a Windows host, the route print Windows command is used to verify the presence of the IPv4 default gateway, as shown in Example 12-16.
Example 12-16 PC1’s Routing Table
C:> route print
(Output omitted)

IPv4 Route Table
=============================================================================
Active Routes:
Network Destination        Netmask        Gateway        Interface   Metric
          0.0.0.0         0.0.0.0         10.1.10.1      10.1.10.10      11
(Output omitted)
Troubleshoot IPv6 Default Gateway Example (12.5.8)
In IPv6, the default gateway can be configured manually by using stateless address autoconfiguration (SLAAC) or by using DHCPv6. With SLAAC, the default gateway is advertised by the router to hosts using ICMPv6 Router Advertisement (RA) messages. The default gateway in the RA message is the link-local IPv6 address of a router interface. If the default gateway is configured manually on the host, which is very unlikely, the default gateway can be set to either the global IPv6 address or to the link-local IPv6 address.
This section provides an example and explanation of troubleshooting an IPv6 default gateway issue.
R1 Routing Table
As shown in Example 12-17, the show ipv6 route Cisco IOS command is used to check for the IPv6 default route on R1. R1 has a default route via R2.
Example 12-17 R1’s Routing Table
R1# show ipv6 route

(Output omitted)

S ::/0 [1/0]
via 2001:DB8:ACAD:2::2
R1#
PC1 Addressing
The ipconfig Windows command is used to verify that a PC1 has an IPv6 default gateway. The output in Example 12-18 shows that PC1 is missing an IPv6 global unicast address and an IPv6 default gateway. PC1 is enabled for IPv6 because it has an IPv6 link-local address. The link-local address is automatically created by the device. Checking the network documentation, the network administrator confirms that hosts on this LAN should be receiving their IPv6 address information from the router using SLAAC.
Note
In this example, other devices on the same LAN using SLAAC would also experience the same problem receiving IPv6 address information.
Example 12-18 PC1’s Addressing
C:> ipconfig
Windows IP Configuration
   Connection-specific DNS Suffix . :
   Link-local IPv6 Address . . . .  : fe80::5075:d0ff:fe8e:9ad8%13
   IPv4 Address . . . . . . . . . . : 10.1.10.10
   Subnet Mask  . . . . . . . . . . : 255.255.255.0
   Default Gateway. . . . . . . . . : 10.1.10.1
C:>
Check R1 Interface Settings
In Example 12-19, the command output of the show ipv6 interface GigabitEthernet 0/0/0 command on R1 reveals that although the interface has an IPv6 address, it is not a member of the All-IPv6-Routers multicast group ff02::2. This means the router is not enabled as an IPv6 router. Therefore, it is not sending out ICMPv6 RAs on this interface.
Example 12-19 Checking R1’s Interface Settings
R1# show ipv6 interface GigabitEthernet 0/0/0
GigabitEthernet0/0/0 is up, line protocol is up
  IPv6 is enabled, link-local address is FE80::1
  No Virtual link-local address(es):
  Global unicast address(es):
    2001:DB8:ACAD:1::1, subnet is 2001:DB8:ACAD:1::/64
  Joined group address(es):
      FF02:: 1
      FF02::1:FF00:1

(Output omitted)
R1#
Correct R1 IPv6 Routing
R1 is enabled as an IPv6 router using the ipv6 unicast-routing command. As shown in Example 12-20, the show ipv6 interface GigabitEthernet 0/0/0 command verifies that R1 is a member of ff02::2, the All-IPv6-Routers multicast group.
Example 12-20 Correcting R1’s IPv6 Routing
R1(config)# ipv6 unicast-routing
R1(config)# exit
R1#
R1# show ipv6 interface GigabitEthernet 0/0/0
GigabitEthernet0/0/0 is up, line protocol is up
  IPv6 is enabled, link-local address is FE80::1
  No Virtual link-local address(es):
  Global unicast address(es):
    2001:DB8:ACAD:1::1, subnet is 2001:DB8:ACAD:1::/64
  Joined group address(es):
      FF02:: 1
      FF02:: 2
      FF02::1:FF00:1
(Output omitted)
R1#
Verify PC1 Has an IPv6 Default Gateway
To verify that PC1 has the default gateway set, use the ipconfig command on the Microsoft Windows PC or the ifconfig command on Linux and Mac OS X. In Example 12-21, PC1 has an IPv6 global unicast address and an IPv6 default gateway. The default gateway is set to the link-local address of router R1, fe80::1.
Example 12-21 Verifying That PC1 Has an IPv6 Default Gateway
C:> ipconfig
Windows IP Configuration
   Connection-specific DNS Suffix . :
   IPv6 Address. . . . . . . . . .  : 2001:db8:acad:1:5075:d0ff:fe8e:9ad8
   Link-local IPv6 Address . . . .  : fe80::5075:d0ff:fe8e:9ad8%13
   IPv4 Address . . . . . . . . . . : 10.1.10.10
   Subnet Mask  . . . . . . . . . . : 255.255.255.0
   Default Gateway. . . . . . . . . : fe80::1
                                        10.1.10.1
C:>
Step 5—Verify Correct Path (12.5.9)
When troubleshooting, it is often necessary to verify the path to the destination network. Figure 12-33 shows the reference topology indicating the intended path for packets from PC1 to SRV1.

Figure 12-33 Reference Topology with the Intended Path from PC1 and SRV1
The routers in the path make the routing decision based on information in the routing tables. Examples 12-22 and 12-23 show the IPv4 and IPv6 routing tables for R1.
Example 12-22 R1’s IPv4 Routing Table
R1# show ip route | begin Gateway
Gateway of last resort is 192.168.1.2 to network 0.0.0.0
O*E2  0.0.0.0/0 [110/1] via 192.168.1.2, 00:00:13, Serial0/1/0
      10.0.0.0/8 is variably subnetted, 2 subnets, 2 masks
C        10.1.10.0/24 is directly connected, GigabitEthernet0/0/0
L        10.1.10.1/32 is directly connected, GigabitEthernet0/0/0
      172.16.0.0/24 is subnetted, 1 subnets
O        172.16.1.0 [110/100] via 192.168.1.2, 00:01:59, Serial0/1/0
      192.168.1.0/24 is variably subnetted, 3 subnets, 2 masks
C        192.168.1.0/30 is directly connected, Serial0/1/0
L        192.168.1.1/32 is directly connected, Serial0/1/0
O        192.168.1.4/30 [110/99] via 192.168.1.2, 00:06:25, Serial0/1/0
R1#
Example 12-23 R1’s IPv6 Routing Table
R1# show ipv6 route
IPv6 Routing Table - default - 8 entries
Codes: C - Connected, L - Local, S - Static, U - Per-user Static route
       B - BGP, R - RIP, H - NHRP, I1 - ISIS L1
       I2 - ISIS L2, IA - ISIS interarea, IS - ISIS summary, D - EIGRP
       EX - EIGRP external, ND - ND Default, NDp - ND Prefix, DCE - Destination
       NDr - Redirect, O - OSPF Intra, OI - OSPF Inter, OE1 - OSPF ext 1
       OE2 - OSPF ext 2, ON1 - OSPF NSSA ext 1, ON2 - OSPF NSSA ext 2
       a - Application
OE2 ::/0 [110/1], tag 1
     via FE80::2, Serial0/1/0
C   2001:DB8:ACAD:1::/64 [0/0]
     via GigabitEthernet0/0/0, directly connected
L   2001:DB8:ACAD:1::1/128 [0/0]
     via GigabitEthernet0/0/0, receive
C   2001:DB8:ACAD:2::/64 [0/0]
     via Serial0/1/0, directly connected
L   2001:DB8:ACAD:2::1/128 [0/0]
     via Serial0/1/0, receive
O   2001:DB8:ACAD:3::/64 [110/99]
     via FE80::2, Serial0/1/0
O   2001:DB8:ACAD:4::/64 [110/100]
     via FE80::2, Serial0/1/0
L   FF00::/8 [0/0]
     via Null0, receive
R1#
The IPv4 and IPv6 routing tables can be populated by the following methods:
Directly connected networks
Local host or local routes
Static routes
Dynamic routes
Default routes
The process of forwarding IPv4 and IPv6 packets is based on the longest bit match or longest prefix match. The routing table process attempts to forward a packet using an entry in the routing table with the greatest number of leftmost matching bits. The number of matching bits is indicated by the prefix length of the route.
Figure 12-34 illustrates the process for both the IPv4 and IPv6 routing tables.

Figure 12-34 Routing Decision Flowchart
Consider the following scenarios, based on the flowchart in the figure. If the destination address in a packet:
Does not match an entry in the routing table, then the default route is used. If there is not a default route that is configured, the packet is discarded.
Matches a single entry in the routing table, then the packet is forwarded through the interface that is defined in this route.
Matches more than one entry in the routing table and the routing entries have the same prefix length, then the packets for this destination can be distributed among the routes that are defined in the routing table.
Matches more than one entry in the routing table and the routing entries have different prefix lengths, then the packets for this destination are forwarded out the interface that is associated with the route that has the longer prefix match.
Troubleshooting Example
Say that devices are unable to connect to the server SRV1 at 172.16.1.100. Using the show ip route command, the administrator should check to see if a routing entry exists to network 172.16.1.0/24. If the routing table does not have a specific route to the SRV1 network, the network administrator must check for the existence of a default or summary route entry in the direction of the 172.16.1.0/24 network. If none exists, then the problem may be with routing, and the administrator must verify that the network is included within the dynamic routing protocol configuration or add a static route.
Step 6—Verify the Transport Layer (12.5.10)
If the network layer appears to be functioning as expected, but users are still unable to access resources, then the network administrator must begin troubleshooting the upper layers. Two of the most common issues that affect transport layer connectivity are ACL configurations and NAT configurations. A common tool for testing transport layer functionality is the Telnet utility.
Caution
While Telnet can be used to test the transport layer, for security reasons, SSH should be used to remotely manage and configure devices.
Troubleshooting Example
A network administrator is troubleshooting a problem that involves inability to connect to a router using HTTP. The administrator pings R2, as shown in Example 12-24.
Example 12-24 Verifying Connectivity to R2
R1# ping 2001:db8:acad:2::2
Type escape sequence to abort.
Sending 5, 100-byte ICMP Echos to 2001:DB8:ACAD:2::2, timeout is 2 seconds:
!!!!!
Success rate is 100 percent (5/5), round-trip min/avg/max = 2/2/3 ms
R1#
R2 responds and confirms that the network layer and all layers below the network layer are operational. The administrator knows the issue is with Layer 4 or up and must start troubleshooting those layers.
Next, the administrator tries to use Telnet to reach R2, as shown in Example 12-25.
Example 12-25 Verifying Remote Access to R2
R1# telnet 2001:db8:acad:2::2
Trying 2001:DB8:ACAD:2::2 ... Open
User Access Verification
Password:
R2> exit
[Connection to 2001:db8:acad:2::2 closed by foreign host]
R1#
The administrator has confirmed that Telnet is running on R2. Although the Telnet server application runs on its own well-known port number 23, and Telnet clients connect to this port by default, a different port number can be specified on the client to connect to any TCP port that must be tested. Using a different port other than TCP port 23 indicates whether the connection is accepted (as indicated by the word “Open” in the output), refused, or timed out. From any of those responses, further conclusions can be made concerning the connectivity. Certain applications, if they use an ASCII-based session protocol, might even display an application banner, and it might be possible to trigger some responses from the server by typing in certain keywords, such as with SMTP, FTP, and HTTP.
For example, the administrator attempts to Telnet to R2 using port 80, as shown in Example 12-26. The output verifies a successful transport layer connection, but R2 is refusing the connection using port 80.
Example 12-26 Verifying Transport Layer Connectivity to R2
R1# telnet 2001:db8:acad:2::2 80
Trying 2001:DB8:ACAD:2::2, 80 ... Open
^C
HTTP/1.1 400 Bad Request
Date: Mon, 04 Nov 2019 12:34:23 GMT
Server: cisco-IOS
Accept-Ranges: none
400 Bad Request
[Connection to 2001:db8:acad:2::2 closed by foreign host]
R1#
Step 7—Verify ACLs (12.5.11)
On routers, there may be ACLs that prohibit protocols from passing through the interface in the inbound direction or the outbound direction.
Use the show ip access-lists command to display the contents of all IPv4 ACLs and the show ipv6 access-list command to display the contents of all IPv6 ACLs configured on a router. The specific ACL can be displayed by entering the ACL name or number as an option for this command. The show ip interfaces and show ipv6 interfaces commands display IPv4 and IPv6 interface information that indicates whether any IP ACLs are set on the interface.
Troubleshooting Example
To prevent spoofing attacks, the network administrator decided to implement an ACL that is preventing devices with source network address 172.16.1.0/24 from entering the inbound S0/0/1 interface on R3, as shown in Figure 12-35. All other IP traffic should be allowed.

Figure 12-35 Reference Topology with ACL Placement Indicated
However, shortly after implementing the ACL, users on the 10.1.10.0/24 network are unable to connect to devices on the 172.16.1.0/24 network, including SRV1.
This section provides an example of how to troubleshoot this issue.
show ip access-lists
The show ip access-lists command output indicates that the ACL is configured correctly, as shown in Example 12-27.
Example 12-27 The show ip access-lists Command
R3# show ip access-lists
Extended IP access list 100
    10 deny ip 172.16.1.0 0.0.0.255 any (108 matches)
    20 permit ip any any (28 matches)
R3#
show ip interfaces
Next, the administrator verifies which interface has the ACL applied by using the show ip interfaces serial 0/1/1 command and the show ip interfaces serial 0/0/0 command. The output in Example 12-28 reveals that the ACL was never applied to the inbound interface on Serial 0/0/1, but it was accidentally applied to the G0/0/0 interface, and it is blocking all outbound traffic from the 172.16.1.0/24 network.
Example 12-28 The show ip interfaces Command
R3# show ip interface serial 0/1/1 | include access list
  Outgoing Common access list is not set
  Outgoing access list is not set
  Inbound Common access list is not set
  Inbound  access list is not set
R3#
R3# show ip interface gig 0/0/0 | include access list
  Outgoing Common access list is not set
  Outgoing access list is not set
  Inbound Common access list is not set
  Inbound  access list is 100
R3#
Correct the Issue
After correctly placing the IPv4 ACL on the Serial 0/0/1 inbound interface, as shown in Example 12-29 output, devices can successfully connect to the server.
Example 12-29 Correcting the Issue
R3(config)# interface GigabitEthernet 0/0/0
R3(config-if)# no ip access-group 100 in
R3(config-if)# exit
R3(config)#
R3(config)# interface serial 0/1/1
R3(config-if)# ip access-group 100 in
R3(config-if)# end
R3#
Step 8—Verify DNS (12.5.12)
The DNS protocol controls DNS, a distributed database with which you can map hostnames to IP addresses. When you configure DNS on a device, you can substitute the hostname for the IP address with all IP commands, such as ping or telnet.
To display the DNS configuration information on a switch or router, use the show running-config command. When there is no DNS server installed, it is possible to enter name-to-IP address mappings directly into the switch or router configuration. Use the ip host command to enter a name to be used instead of the IPv4 address of the switch or router, as shown in Example 12-30.
Example 12-30 Configuring a Name-to-IP Address Mapping
R1(config)# ip host ipv4-server 172.16.1.100
R1(config)# exit
R1#
Now the assigned name can be used instead of using the IP address, as shown in Example 12-31.
Example 12-31 Verifying pings to the Hostname
R1# ping ipv4-server
Type escape sequence to abort.
Sending 5, 100-byte ICMP Echos to 172.16.1.100, timeout is 2 seconds:
!!!!!
Success rate is 100 percent (5/5), round-trip min/avg/max = 4/5/7 ms
R1#
To display the name-to-IP-address mapping information on a Windows-based PC, use the nslookup command.
Packet Tracer—Troubleshoot Enterprise Networks (12.5.13)

This activity uses a variety of technologies you have encountered during your CCNA studies, including routing, port security, EtherChannel, DHCP, and NAT. Your task is to review the requirements, isolate and resolve any issues, and then document the steps you took to verify the requirements.
Summary (12.6)
The following is a summary of the sections in this chapter.
Network Documentation
Common network documentation includes physical and logical network topologies, network device documentation recording all pertinent device information, and network performance baseline documentation. Information included on a physical topology typically includes the device name, device location (address, room number, rack location, and so on), interface and ports used, and cable type. Network device documentation for a router may include the interface, IPv4 address, IPv6 address, MAC address, and routing protocol. Network device documentation for a switch may include the port, access, VLAN, trunk, EtherChannel, native, and enabled. Network device documentation for end systems may include device name, OS, services, MAC address, IPv4 and IPv6 addresses, default gateway, and DNS. A network baseline should answer the following questions:
How does the network perform during a normal or average day?
Where are the most errors occurring?
What part of the network is most heavily used?
What part of the network is least used?
Which devices should be monitored, and what alert thresholds should be set?
Can the network meet the identified policies?
When conducting the initial baseline, start by selecting a few variables that represent the defined policies, such as interface utilization and CPU utilization. A logical network topology diagram can be useful in identifying key devices and ports to monitor. The length of time and the baseline information being gathered must be long enough to determine a “normal” picture of the network. When documenting the network, gather information directly from routers and switches by using the show, ping, traceroute, and telnet commands.
Troubleshooting Process
The troubleshooting process should be guided by structured methods. One method is the seven-step troubleshooting process: (1) Define the problem, (2) gather information, (3) analyze information, (4) eliminate possible causes, (5) propose a hypothesis, (6) test the hypothesis, and (7) solve the problem. When talking to end users about their network problems, ask both open and closed-ended questions. Use the show, ping, traceroute, and telnet commands to gather information from devices. Use the layered models to perform bottom-up, top-down, or divide-and-conquer troubleshooting. Other models include follow-the-path, substitution, comparison, and educated guess. Software problems are often solved using a top-down approach, while hardware-based problems are often solved using the bottom-up approach. An experienced technician may solve new problems by using the divide-and-conquer method.
Troubleshooting Tools
Common software troubleshooting tools include NMS tools, knowledge bases, and baselining tools. A protocol analyzer, such as Wireshark, decodes the various protocol layers in a recorded frame and presents this information in an easy-to-use format. Hardware troubleshooting tools include digital multimeters, cable testers, cable analyzers, portable network analyzers, and Cisco Prime NAM. A syslog server can also be used as a troubleshooting tool. With a logging facility for network troubleshooting, Cisco devices can log information regarding configuration changes, ACL violations, interface status, and many other types of events. Event messages can be sent to one or more of the following: console, terminal lines, buffered logging, SNMP traps, and syslog. The lower the level number, the higher the severity level. The logging trap level command (where level is the name or number of the severity level) limits messages logged to the syslog server based on severity. Only messages equal to or numerically lower than the specified level are logged.
Symptoms and Causes of Network Problems
Failures and suboptimal conditions at the physical layer usually cause networks to shut down. Network administrators must be able to effectively isolate and correct problems at this layer. Symptoms include performance lower than baseline, loss of connectivity, congestion, high CPU utilization, and console error messages. The causes are usually power related, hardware faults, cabling faults, attenuation, noise, interface configuration errors, exceeding component design limits, and CPU overload.
Data link layer problems cause specific symptoms that, when recognized, can help identify the problem quickly. Symptoms include no functionality/connectivity at Layer 2 or above, network operating below baseline levels, excessive broadcasts, and console messages. The causes are usually encapsulation errors, address mapping errors, framing errors, and STP failures or loops.
Network layer problems include any problem that involves a Layer 3 protocol, both routed protocols (such as IPv4 or IPv6) and routing protocols (such as EIGRP or OSPF). Symptoms include network failure and suboptimal performance. The causes are usually general network issues, connectivity issues, routing table problems, neighbor issues, and the topology database.
Transport layer problems can arise from transport layer problems on the router, particularly at the edge of the network, where traffic is examined and modified. Symptoms include connectivity and access issues. Causes are likely to be misconfigured NAT or ACLs. ACL misconfigurations commonly occur at the selection of traffic flow, order of access control entries, implicit deny any, addresses and IPv4 wildcard masks, selection of transport layer protocol, source and destination ports, use of the established keyword, and uncommon protocols. There are several problems with NAT, including misconfigured NAT inside, NAT outside, or ACL. Common interoperability areas with NAT include BOOTP and DHCP, DNS, SNMP, and tunneling and encryption protocols.
Application layer problems can result in unreachable or unusable resources when the physical, data link, network, and transport layers are functional. It is possible to have full network connectivity but still see an application be unable to provide data. Another type of problem at the application layer occurs when the physical, data link, network, and transport layers are functional, but the data transfer and requests for network services from a single network service or application do not meet the normal expectations of a user.
Troubleshooting IP Connectivity
Diagnosing and solving problems is an essential skill for network administrators. There is no single recipe for troubleshooting, and a problem can be diagnosed in many ways. However, by employing a structured approach to the troubleshooting process, an administrator can reduce the time it takes to diagnose and solve a problem.
End-to-end connectivity problems typically prompt troubleshooting efforts. Two of the utilities most commonly used to verify problems with end-to-end connectivity are ping and traceroute. The ping command uses a Layer 3 protocol called ICMP that is a part of the TCP/IP suite. The traceroute command is commonly used when the ping command fails.
Follow these steps when troubleshooting IP connectivity problems:
Step 1. Verify the physical layer. The Cisco IOS commands most commonly used for this purpose are show processes cpu, show memory, and show interfaces.
Step 2. Check for duplex mismatches. A common cause of interface errors is mismatched duplex mode between two ends of an Ethernet link. In many Ethernet-based networks, point-to-point connections are now the norm, and the use of hubs and the associated half-duplex operation is becoming less common. Use the show interfaces interface command to diagnose this problem.
Step 3. Verify addressing on the local network. When troubleshooting end-to-end connectivity, it is useful to verify mappings between destination IP addresses and Layer 2 Ethernet addresses on individual segments. The arp Windows command displays and modifies entries in the ARP cache that are used to store IPv4 addresses and their resolved Ethernet physical (MAC) addresses. The output of the netsh interface ipv6 show neighbor Windows command lists all devices that are currently in the neighbor table. The show ipv6 neighbors command output displays an example of the neighbor table on a Cisco IOS router. Use the show mac address-table command to display the MAC address table on a switch.
VLAN assignment is another issue to consider when troubleshooting end-to-end connectivity. On a host, use the arp Windows command to see the entry for a default gateway. On a switch, use the show mac address-table command to check the switch MAC table and confirm that the port VLAN assignment is correct.
Step 4. Verify the default gateway. The show ip route Cisco IOS command is used to verify the default gateway of a router. On a Windows host, the route print Windows command is used to verify the presence of the IPv4 default gateway.
In IPv6, the default gateway can be configured manually, by using stateless address autoconfiguration (SLAAC) or by using DHCPv6. The show ipv6 route Cisco IOS command is used to check for the IPv6 default route on a router. The ipconfig Windows command is used to verify whether a PC has an IPv6 default gateway. The command output of the show ipv6 interface interface command indicates whether a router is enabled as an IPv6 router. Enable a router as an IPv6 router by using the ipv6 unicast-routing command. To verify that a host has the default gateway set, use the ipconfig command on a Microsoft Windows PC or the ifconfig command on Linux or Mac OS X.
Step 5. Verify the correct path. The routers in the path make routing decisions based on information in the routing tables. Use the show ip route | begin Gateway command for an IPv4 routing table. Use the show ipv6 route command for an IPv6 routing table.
Step 6. Verify the transport layer. Two of the issues that most commonly affect transport layer connectivity are ACL configurations and NAT configurations. A common tool for testing transport layer functionality is the Telnet utility.
Step 7. Verify ACLs. Use the show ip access-lists command to display the contents of all IPv4 ACLs and the show ipv6 access-list command to show the contents of all IPv6 ACLs configured on a router. Verify which interface has an ACL applied by using the show ip interfaces command.
Step 8. Verify DNS. To display the DNS configuration information on a switch or router, use the show running-config command. Use the ip host command to enter a name-to-IPv4 address mapping in the switch or router.
Packet Tracer—Troubleshooting Challenge—Document the Network (12.6.1)
In this Packet Tracer activity, you document a network that is unknown to you:
Test network connectivity.
Compile host addressing information.
Remotely access default gateway devices.
Document default gateway device configurations.
Discover devices on the network.
Draw the network topology.
Packet Tracer—Troubleshooting Challenge—Use Documentation to Solve Issues (12.6.2)
In this Packet Tracer activity, you use network documentation to identify and fix network communications problems:
Use various techniques and tools to identify connectivity issues.
Use documentation to guide troubleshooting efforts.
Identify specific network problems.
Implement solutions to network communication problems.
Verify network operation.
Practice
The following Packet Tracer activities provide practice with the topics introduced in this chapter. The instructions are available in the companion Enterprise Networking, Security, and Automation Labs & Study Guide (CCNAv7) (ISBN 9780136634324). There are no labs for this chapter.
Packet Tracer Activities
Packet Tracer 12.5.13: Troubleshoot Enterprise Networks
Packet Tracer 12.6.1: Troubleshooting Challenge—Document the Network
Packet Tracer 12.6.2: Troubleshooting Challenge—Use Documentation to Solve Issues
Check Your Understanding Questions
Complete all the review questions listed here to test your understanding of the topics and concepts in this chapter. The appendix “Answers to the ‘Check Your Understanding’ Questions” lists the answers.
1. Which statement describes the physical topology for a LAN?
It defines how hosts and network devices connect to the LAN.
It depicts the addressing scheme that is used in the LAN.
It describes whether the LAN is a broadcast or token-passing network.
It shows the order in which hosts access the network.
2. When should a network performance baseline be measured?
After normal work hours to reduce possible interruptions
During normal work hours of an organization
Immediately after the main network devices are restarted
When a denial-of-service attack on the network is detected and blocked
3. In which step of gathering symptoms does a network engineer determine whether the problem is at the core, distribution, or access layer of the network?
Determine ownership.
Determine the symptoms.
Document the symptoms.
Gather information.
Narrow the scope.
4. A network technician is troubleshooting an email connection problem. Which question to the end user will help the technician get clear information to better define the problem?
How big are the emails you tried to send?
Is your email working now?
What kind of equipment are you using to send emails?
When did you first notice your email problem?
5. A team of engineers has identified a solution to a significant network problem. The proposed solution is likely to affect critical network infrastructure components. What should the team follow while implementing the solution to avoid interfering with other processes and infrastructure?
Change-control procedures
Knowledge base guidelines
One of the layered troubleshooting approaches
Syslog messages and reports
6. A network engineer is troubleshooting a network problem and can successfully ping between two devices. However, Telnet between the same two devices does not work. Which OSI layers should the administrator investigate next?
All the layers
From the network layer to the application layer
From the network layer to the physical layer
Only the network layer
7. Which troubleshooting method begins by examining cable connections and wiring issues?
Bottom-up troubleshooting
Divide-and-conquer troubleshooting
Substitution troubleshooting
Top-down troubleshooting
8. An administrator is troubleshooting an Internet connectivity problem on a router. The output of the show interfaces gigabitethernet 0/0 command reveals higher-than-normal framing errors on the interface that connects to the Internet. At what layer of the OSI model is the problem likely occurring?
Layer 1
Layer 2
Layer 3
Layer 4
Layer 7
9. Users report that the new website http://www.company1.biz cannot be accessed. The help desk technician checks and verifies that the website can be accessed with http://www.company1.biz:90. Which layer in the TCP/IP model is involved in troubleshooting this issue?
Application
Internet
Network access
Transport
10. A user reports that after an OS patch of the networking subsystem has been applied to a workstation, the workstation performs very slowly when connecting to network resources. A network technician tests the link with a cable analyzer and notices that the workstation sends an excessive number of frames smaller than 64 bytes and also other meaningless frames. What is the possible cause of the problem?
Cabling faults
Corrupted application installation
Corrupted NIC driver
Ethernet signal attenuation
11. A networked PC is having trouble accessing the Internet, but it can print to a local printer and ping other computers in the area. Other computers on the same network are not having any issues. What is the problem?
The default gateway router does not have a default route.
The link between the switch to which the PC connects and the default gateway router is down.
The PC has a missing or incorrect default gateway.
The switch port to which the PC connects has an incorrect VLAN configured.
12. Which three pieces of information are typically recorded in a logical topology diagram? (Choose three.)
Cable specifications
Device locations
Device models and manufacturers
IP addresses and prefix lengths
Routing protocols
Static routes
13. A company is setting up a website with SSL technology to protect the authentication credentials required to access the website. A network engineer needs to verify that the setup is correct and that the authentication is indeed encrypted. Which tool should be used?
Baselining tool
Cable analyzer
Fault-management tool
Protocol analyzer
14. Which number represents the most severe level of syslog logging?
0
1
6
7