
4
Financial Statement Analysis
Introduction
Sadly, it is common to hear entrepreneurs say, “I do not know anything about finance, because I was never good with numbers. Therefore, I focus on my product and let someone else worry about the numbers.” Someone with such an attitude can never achieve successful high-growth entrepreneurship. Financial statement analysis is not brain surgery! Everyone can understand it. In fact, no matter how distasteful or uncomfortable it might be to the high-growth entrepreneur, he must learn and use financial statement analysis. For some entrepreneurs, finance is like medicine. No one likes it because it usually tastes awful, but everyone knows that it is good for you. For other entrepreneurs, finance is like spinach to the cartoon character Popeye; it tastes great, and makes them stronger!
Proactive Analysis
Entrepreneurs must engage in proactive analysis of their financial statements in order to better manage their company and influence the business decisions of the company’s managers, as well as attract capital from investors and creditors.1
Financial statements must be used as tangible management tools, not simply as reporting documents. While the entrepreneur does not need to be able to develop these statements herself—that job is done by the CFO—she must be able to completely understand every line item. The entrepreneur who cannot do this will have a much more difficult time growing the company and raising capital. For example, one of the fundamentals of finance says that accounts receivable (A/R) and inventory should not grow at an annual rate faster than revenue growth. If they do, it is a sign that the company’s working capital is being depleted because the accounts receivable and inventory represent a drag on a company’s cash.
A case in point: The management team at a publicly owned technology company failed to do a proactive analysis of this relationship. The result? The stock price declined 30% shortly after the company reported its annual financial results. The results showed that compared with the previous year, revenues had grown an impressive 20%. Unfortunately, A/R and inventory had grown 41% and 54%, respectively!
Another problem for entrepreneurs who do not analyze their financial statements proactively is that these entrepreneurs also risk being taken advantage of or exploited. The Better Business Bureau estimated that almost 30% of business failures result from employee theft.2 There are numerous accounts of companies losing money because employees were stealing products and cash. In many instances, the theft was not recognized immediately because the owners had excluded themselves from all financial statement analysis. Not surprisingly, many of the thieves are bookkeepers, accountants, accounts receivable and payable clerks, and CFOs. All of the aforementioned are positions that are intimately involved in the company’s financials.
Automated Equipment Inc. is a family-run manufacturing business. The company’s bookkeeper was a friendly 33-year-old woman who was inflating payouts to vendors, then altering the names on the checks and depositing them in accounts that were under her control. It took the company 4 years to discover the embezzlement, and by then the woman had stolen nearly $610,000, leaving the company in near financial ruin. Among other things, the bookkeeper had purchased a Cadillac sport utility vehicle, expensive clothing, and fine meats. Oh, and she also put a $30,000 addition on her home. Bette Wildermuth, a longtime business broker in Richmond, Virginia, has 25 years’ worth of stories of business owners getting surprised by the people they trust. Often, she is the one who catches the shenanigans when she is poring over their financials at the time of a sale. “I was asked by the owner of a fabrication company to come talk about the possibility of selling his company. He specifically asked me to come on a Wednesday afternoon because his bookkeeper would not be there. You see, he did not want to cause her any worry over a possible job loss. After all, she’d been with his company for 15 years.” Wildermuth was left alone with the books and records to try to determine a valuation. After about two hours, she said, the owner returned and proudly asked, “Did you notice that our sales are up and we’re continuing to make a profit?” Wildermuth had noticed this and congratulated him. “I also told him that an astute buyer would notice that and more, and that both of us would have the same question. ‘Bob,’ I asked, ‘why are you paying your home mortgage from the business account?’ He told me that that was impossible because his mortgage had been paid off years ago.” It turned out that the man who had handled his finances for 15 years was robbing him blind. He was also paying his personal Visa card from the company books. “When I told him what was going on,” Wildermuth remembers, “he looked like he had been punched in the stomach.”
Another great example to highlight this point is the story of Rae Puccini, who, by the time she was 55 years old, had been convicted eight times over two decades for stealing money from her employers. Her final crime was using her position as the office manager to steal $800,000 from her employer, Edelman, Combs & Latturner (ECL), a prominent Chicago-based law firm that had hired her in 1996. The lawsuit against her stated:
She forged signatures, cut herself “bonus” checks and transferred money from her bosses’ bank account. She used the firm’s American Express credit card to pay for a Caribbean cruise and a vacation at the Grand Hotel on Mackinac Island, Michigan. She also used the credit card to pay for a Mexico vacation with her boyfriend as well as groceries, flowers, furniture and liquor. Her new car was paid for by a $35,000 bonus that she paid herself. Her most expensive gift to herself was the $200,000 house that she purchased in the suburbs, using a $42,000 check that she cut from the firm.3
How did she pull off this incredible crime? First, she earned her employers’ trust easily. Second, she worked long hours to create an impression that she was very dedicated to the firm. As an attorney at another law firm, from which she also stole money, stated, “She ostensibly was very loyal and trusted. She came in early and stayed late.”4 The final reason was that no one in the law firm was involved in the supervision and analysis of its financials. She was practically given carte blanche, without any checks and balances. She was finally caught when the ECL partners asked her to show documentation explaining how the company’s cash had been spent. When she hedged, the partners looked through her work area and found incriminating evidence.5
Approximately one month before her death, Puccini went to a funeral home, selected flowers, and paid for her body to be cremated. She donated many of her clothes to Goodwill and set up a post funeral dinner at a Greek restaurant. Her final act was to type a confessional letter that included the statement, “No one knew what I was doing with the finances of ECL.”6 She was absolutely correct.
When an entrepreneur is involved in his company’s finances, such sordid stories regarding losses of cash to theft can be practically eliminated because the entrepreneur’s knowledge and participation serve as a deterrent.
To utilize the financial statements as management tools, the entrepreneur must have them prepared more than once a year. In the first two years of a company’s life, monthly statements should be produced and analyzed. In the first year, the analysis should be month to month. In year two, the analysis should be same month this year compared to same month last year. In year three and every year after, the statements should be produced quarterly and be in the entrepreneur’s hand for analysis no later than 30 days following the close of a quarter.
In this chapter, we will learn that the data contained in financial statements can be analyzed to tell an interesting and compelling story about the financial condition of a business. Included in the financial statement analysis discussion will be a case study. We will examine the income statement of the Turner Company to determine what is taking place with its operations, despite the fact that we know nothing about the industry or the company’s products or services. Using information provided in this statement, we will then prepare financial projections (pro formas) for the next year based on key assumptions.
Income Statement Analysis
In terms of financial analysis, all items, including expenses and the three types of margins—gross, operating, and net—are analyzed in terms of percentage of revenues. As Figure 4-1 shows, the cost of goods sold (COGS) percent plus the gross profit percent should equal 100%. The COGS percent plus the total operating expense percent plus the interest expense percent plus the tax expense percent plus the net income percent should also equal 100%.
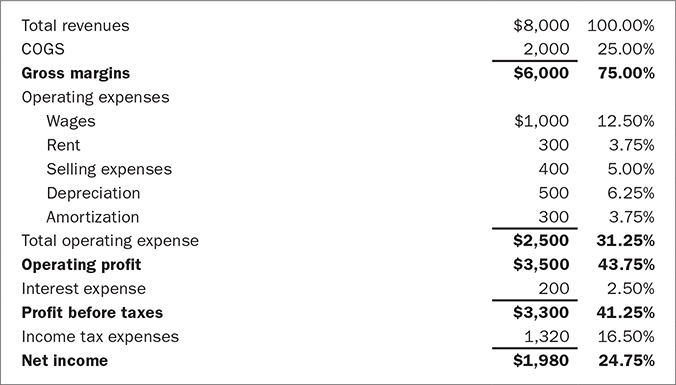
FIGURE 4-1 Income Statement Analysis for Bruce Company
Ratio Analysis
A ratio analysis, using two or more financial statement numbers, may be undertaken for several reasons. Entrepreneurs, along with bankers, creditors, and stockholders, typically use ratio analysis to objectively appraise the financial condition of a company and to identify its vulnerabilities and strengths. As we will discuss later, ratio analysis is probably the most important financial tool that the entrepreneur can use to proactively operate a company. Therefore, the entrepreneur should review the various ratios that we discuss in this section at least quarterly, along with the three key financial reports: income statement, balance sheet, and cash flow statement. There are six key ratio categories:
• Profitability ratios
• Liquidity ratios
• Leverage (capital structure) ratios
• Operating ratios
• Cash ratios
• Valuation ratios
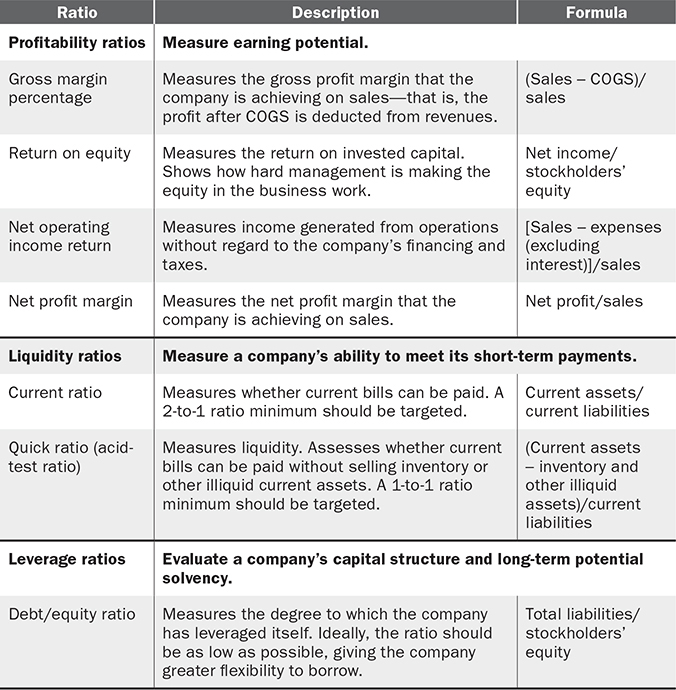
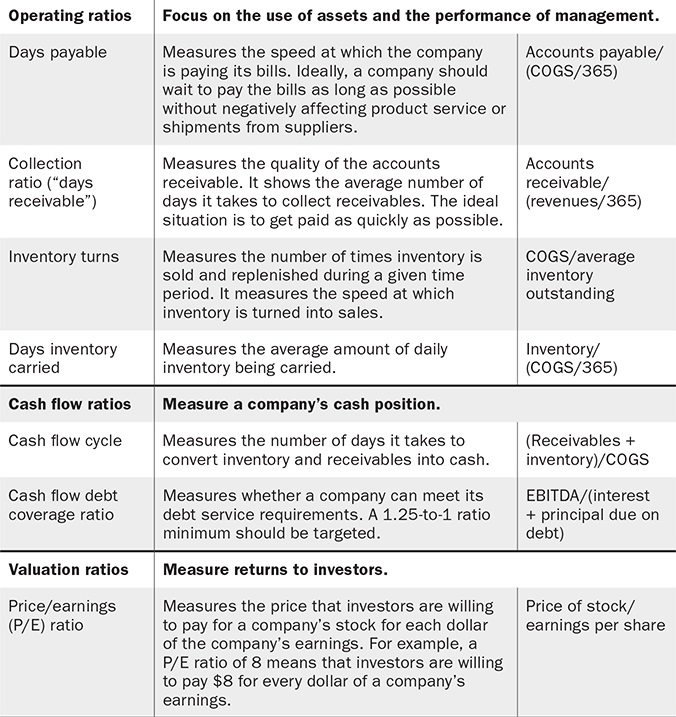
Table 4-1 provides a description of selected financial ratios and the formulas used to calculate them.
TABLE 4-1 Financial Accounting Ratios
A company’s ratios should not be examined without a proper context, meaning, do not disregard the effect of sequential periods of time (for example, successive quarters or years). Looking at a single period renders the ratios virtually meaningless. The greatest benefit of historical and present-day ratios derived from two analytical measurements—internal and external—is the ability to do annual internal comparisons. This type of analysis will show if there are any trends within a company across time. For example, a comparison can be made of selected income statement line items across a 2-year, 5-year, or 10-year period. This type of analysis will help to assess the soundness of a company’s activities as well as identify important trends. It allows the entrepreneur to answer the question, is my internal performance better today than it was last year, 5 years ago, or 10 years ago? If the answer is yes, then the next question is, how did it get better? If the answer is no, then the next question is, why didn’t it get better? Deeper analysis should be undertaken to determine not only why things are getting worse, but also what is making things better. If the entrepreneur knows and understands the detailed reasons why her ratios improved over time, then she can use that information for prescriptive elements of future strategic plans.
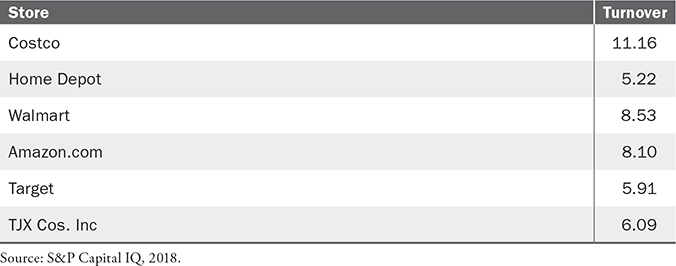
The entrepreneur should also do an external comparison of her company’s ratios against those of the industry. This comparison should be against both the industry’s averages and the best and worst performers within the industry. This will allow the entrepreneur to assess the company’s operations, financial condition, and activities against comparable companies. (Table 4-2 shows a comparison of turnover ratios.) Successful entrepreneurs know that respecting and understanding the competition is a basic business requirement, and the first step to take toward that endeavor is to understand how you compare with the competition. Ratio analysis is one of the most objective ways to do such measurements.
TABLE 4-2 Inventory Turnover Ratios
Many banks provide business loans on the condition that the company maintains certain minimum ratios, such as debt/equity, net worth, and acid test. These conditions are usually included in the covenant section of the loan agreement; not maintaining the minimum ratios puts the company technically in default on the loan. Other investors, such as venture capitalists, may use ratio attainment as “milestones” for determining whether and when they will invest more capital. For example, they may tell the entrepreneur that his next round of financing will occur when the company achieves 50% gross margin in each of four consecutive quarters.
In addition to performing historical and present ratio analyses internally and externally, the entrepreneur should also use ratios to drive the future of the business. For example, the entrepreneur’s strategic plans may include growing revenues while decreasing inventory. Therefore, the days of inventory carried must be reduced while the inventory turnover ratio is increased to some targeted number. Simply stating these objectives is not enough, however. After determining the respective targeted numbers, a strategic plan must be developed and implemented to actually reduce the amount of inventory carried and to ship new inventory that is received by customers quickly.
Such a relationship between the two ratios would look like Table 4-3.
TABLE 4-3 Inventory Ratio Comparison Example
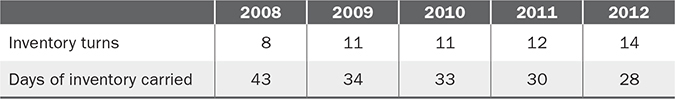
As you can see in the table, the amount of average daily inventory being carried decreases from 43 days’ worth of inventory to 28 over a projected five-year period. Now, if the entrepreneur’s goal is also to increase revenues over this same period of time, then she must turn the smaller volume of daily inventory each year more frequently. And, as the table shows, that is in fact what the entrepreneur forecasts: to increase the inventory turns from 8 times a year to 14. The just-in-time inventory model, pioneered and perfected by Toyota Corporation, works only if a company’s vendors and partners are highly synchronized.
Events outside the company’s control can also cause big problems. In the aftermath of the earthquake, tsunami, nuclear alert, and power outages in northeastern Japan in 2011, for nearly two months, Merck KGaA, a subsidiary of a German company, temporarily ceased manufacturing and exporting Xirallic, a product used by automotive companies around the world to make “pearl-effect” paints. At the time, this Japanese factory was the only location in the world that manufactured Xirallic for customers such as Ford, Nissan, Chrysler, GM, Toyota, and Volkswagen. Toyota lost one-third of its 200 colors, affecting 20% of its vehicle volume.7 Each automaker was forced to stop ordering new vehicles in colors that required this paint additive until full production resumed six months later. Merck lost an estimated $73 million in sales during the two-month halt, and only afterward began planning to develop a second plant in Germany as a backup location.
Another proactive way to use ratios is for the entrepreneur to set short-term, medium-term, and long-term objectives with regard to internal and external ratios. For example, the short-term plan, covering the next 12 months, is to get the days receivables ratio back down to the best level in the company’s 10-year history. The medium-term (24 months) plan may be to get the company’s days receivable down to at least the industry average. Finally, the long-term (36 months) plan may be to make the company’s days receivable the lowest in the industry, making it the market leader. Thus, ratios have immense value to the entrepreneur as analytical and proactive management tools. And successful entrepreneurs regularly compare their performance against historical highs, lows, and trends, as well as against the industry.
What are good and bad ratios? Well, it depends on which ratios are being examined and, more important, the specific industry. Regarding the first point, good days receivable are determined by a company’s invoice terms. The standard invoice has the following terms: “2/10, net 30 days.” This means that the payer can take a 2% discount if the invoice is paid within 10 days. After 10 days, the invoice’s gross amount must be paid within the next 20 days. Thus, the customer is being given a total of 30 days following the date of the invoice to pay the bill. If the company does business under these terms, then days receivable of 45 days or greater are considered bad. The ideal target is to have days receivable no more than 5 days greater than the invoice.
The second factor that determines what are good and bad ratios is the industry (see Table 4-4 for good and bad key ratios for several industries). For example, if we analyze two different industries, we will see distinctly different ideas of what are considered good operating margins. As of January 2019, NYU Stern reported that the average operating margin for regional banks was 1.45%, compared to 40% for tobacco. As stated earlier, everything is relative. Both of these companies have significantly better operating margins than Amazon.com, whose operating margin was 1.1% in 2012.8
TABLE 4-4 Key Ratios for Various Industries
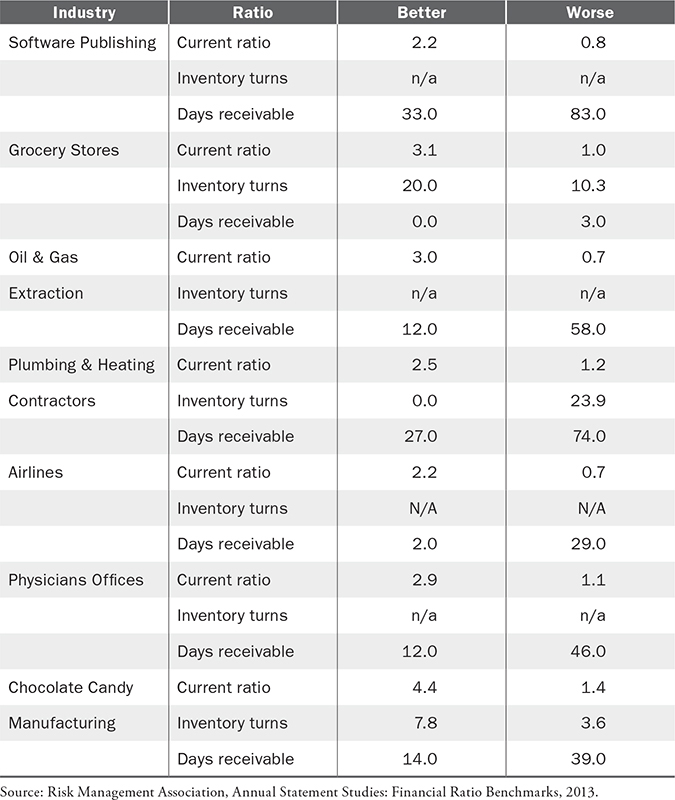
Typically, the financial ratios of successful firms are usually never worse than the industry average. But, there are some instances where it is perfectly acceptable for a company’s ratios to be worse than the industry average. This occurs when the below-average ratios are part of the company’s strategic plan. For example, inventory turns and days inventory carried that are slower and greater, respectively, than the industry average may not be signs of negative performance. It could be that the company’s strategic plan requires it to carry levels of inventory greater than the industry average; as a result, inventory turns would be slower. For example, if a company promises overnight delivery, while its competitors ship in 14 days, that company’s inventory carried will be higher and its turns will be slower. Ideally, the gross margins should be higher than the industry’s because the company should be able to charge a premium for the faster deliveries. Given this fact, it is essential that the entrepreneur perform a comparison of industry averages when writing the business plan, when developing the projections, and, most important, before submitting the plan to prospective investors.
An example of a company that ran with higher expenses than its competitors was Commonwealth Worldwide Chauffeured Transportation. Dawson Rutter, the company’s founder and CEO, dropped out of three universities before starting the company. Over a four-year period, Commonwealth grew its business from 40 customers to 4,000 and increased its revenues over 248%. Rutter had the philosophy of “building the church for Easter Sunday.” He clarified, “We create infrastructure in anticipation of revenue. That ensures delivery will be impeccable 100% of the time. We can always handle 105% of our absolute busiest day. Is that a more expensive way of doing it? You bet. But the fact is we don’t lose customers, which means we can afford to pay that premium.”9
How can entrepreneurs find out industry averages for private companies? Figure 4-2 lists periodicals and other resources that are commonly used to compare an existing company’s performance with that of the industry, as well as to determine whether the pro formas in a business plan are in line with the performance of the industry being entered.
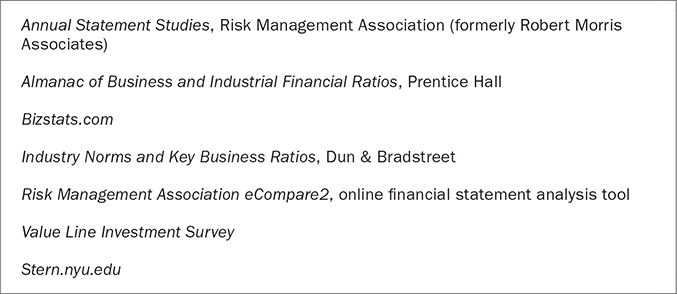
FIGURE 4-2 Industry Ratio Sources
Breakeven Analysis
The analysis of financial statements should also be used to determine a company’s breakeven (BE) point. Successful entrepreneurs know how many widgets, meals, or hours of service they have to sell, serve, or provide, respectively, before they can take any real cash out of the company. Equation 4-1 shows the equation for calculating a company’s BE point.
Breakeven Point
![]()
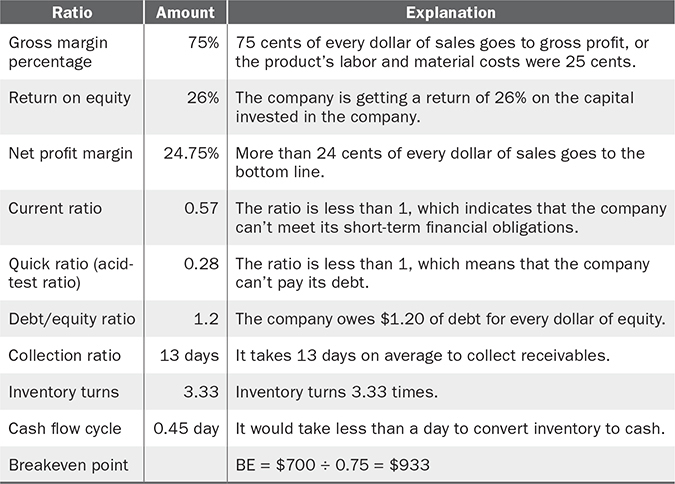
Using the information for the Bruce Company contained in Figures 4-1 and 4-4, one can prepare a selected set of financial ratios and BE for the company. Table 4-5 (see next page) shows the financial ratios, BE, and an explanation of the numbers.
TABLE 4-5 Selected Financial Accounting Ratios for the Bruce Company
Measuring Growth
When measuring the growth of a company, the entrepreneur should be sure to do it completely. Many people use compounded annual growth rate (CAGR) analysis when measuring and discussing growth. Another means of measurement is simple growth. Before going any further, let us discuss the two. In finance, both terms are typically used to discuss the rate of growth of money over a certain period of time.
Simple interest is the rate of growth relative to only the initial investment or original revenues. This base number is the present value (PV). Future value (FV) is the sum of the initial investment and the amount earned from the interest calculation. Thus, the simple interest rate or the rate of growth of a company with revenues of $3,885,000 in Year 1 and $4,584,300 in Year 2 is 18%, because $699,300, the difference between revenues in Years 1 and 2, is 18% of Year 1 revenues. Using the simple interest rate of 18%, Year 3’s revenues would be $5,283,600. This was determined by simply adding $699,300, or 18% of the initial number, $3,885,000, to Year 2’s revenue number. Therefore, an 18% simple growth rate would add $699,300 to the previous year’s revenue each year to determine the level of revenues for the next year. The formula to determine the simple growth rate is the equation shown in Equation 4-2.
Simple Growth Rate
![]()
Using Equation 4-2, let us input the numbers to answer the question, at what simple interest rate must $3,885,000 grow in two years to equal $5,283,600? Another way to look at this question is, if you received a two-year loan of $3,885,000 at 18% simple interest, what would you owe in total principal and interest? The answer would be $5,283,600, as calculated in Figure 4-3.

FIGURE 4-3 Components of Dollar of Growth Calculation
The concept of compounding is commonly used by financial institutions such as banks with regard to both the money they lend and the deposits they receive. CAGR analysis—which is popular among professionals with graduate business school backgrounds, including consultants and commercial and investment bankers—simply shows the interest rate, compounded annually, that must be achieved to grow a company from revenues in Year 1 to revenues in a future year. That sounds similar to what we just said about simple interest. However, the word compounded, which is not included in the definition of simple interest, makes a huge difference. Compounding means that you earn interest not only on the initial investment (the PV), as was the case with simple growth, but also on the interest earned each year, or the actual dollars of growth. Therefore, unlike simple growth, the compounded rate of growth each year reflects the initial investment plus the earnings on reinvested earnings.
Let us use the same numbers as in the simple growth rate discussions to illustrate the concept of CAGR. A company with an 18% CAGR and Year 1 revenues of $3,885,000 will have the future revenues shown in Figure 4-4.

FIGURE 4-4 CAGR Example
In comparing simple annual growth with compounded annual growth, the comparison in Table 4-6 clearly shows the latter to be more advantageous to investors or entrepreneurs who want rapid growth.
TABLE 4-6 Simple and Compounded Annual Growth Comparison
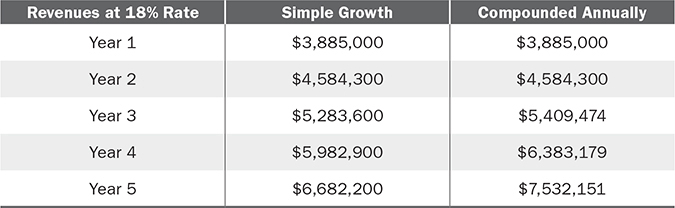
As you can see in Table 4-6, the first-year growth with compounding is the same as with simple growth because the base is the same. The shortcoming with using CAGR is that it looks at only two years, the beginning year and the ending year, completely ignoring the years in between. Therefore, when it is used alone, this popular growth measurement tells an incomplete story that can be misleading.
For example, two companies with Year 1 revenues of $3,885,000 and Year 5 revenues of $7,532,151, as shown in Table 4-7, will show the same 18% CAGR despite the fact that the revenues in Years 2, 3, and 4 looked very different.
TABLE 4-7 CAGR Comparison
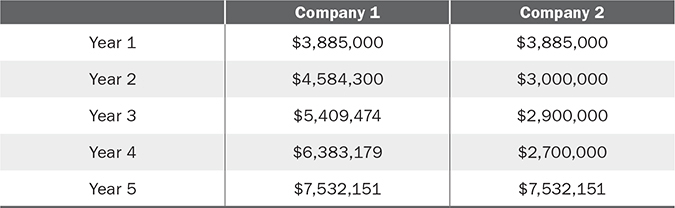
The reason why both companies have the same CAGR is that both had the same revenues in Year 1 and Year 5. The formula for CAGR considers only these two data points. It ignores what happens in between because theoretically, based on the information given about Year 1 and Year 5 and based on how CAGR is calculated, CAGR means that in any given year throughout the five-year period, the company’s annual compounded growth in revenues was an even 18%. That is to say, the growth followed a linear progression. However, as Table 4-7 shows, that is not always the case. Company 2’s revenues declined in three consecutive years. Therefore, the major shortcoming of using CAGR is that it does not take into account the actual growth rates from year to year over the five-year period. Therefore, a more complete analysis using CAGR must include the analysis of real annual growth rates to see if there are any trends.
Finally, if we want to determine the actual revenues in Year 5 (i.e., FV) of a company that had revenues of $3,885,000 in Year 1 (PV) and was growing at a compounded annual rate of 18%, the formula shown in Figure 4-5 could be used.
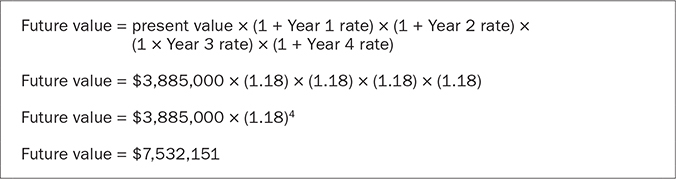
FIGURE 4-5 Sample Future Value Calculation
Note: 1 is added to each year’s interest rate to show that for every dollar invested, 118% will be returned.
Case Study—Turner Company
Figure 4-6 presents an income statement for the Turner Company for three years. No information is given regarding the company’s industry, products, or services. This information is not needed. Numbers alone can tell a story, and every entrepreneur must get comfortable with being able to review financial statements, understand what is going on with the company, and recognize its strengths, weaknesses, and potential value. A successful entrepreneur must have the ability, willingness, and comfort to make decisions based on ambiguous, imperfect, or incomplete information. The analysis of Figure 4-6 gives you the opportunity to demonstrate this trait. As you will see, it is an itty-bitty, tiny business. Nevertheless, the analysis would be exactly the same if each line item were multiplied by $1 million. The point being made is that the analysis of a small company’s financials is the same as that of a large company’s. The only difference is the number of zeros to the left of the decimal points. An appropriate analogy can be made to swimming. If you can swim in 4 feet of water, you can also swim in 50 feet of water and deeper.
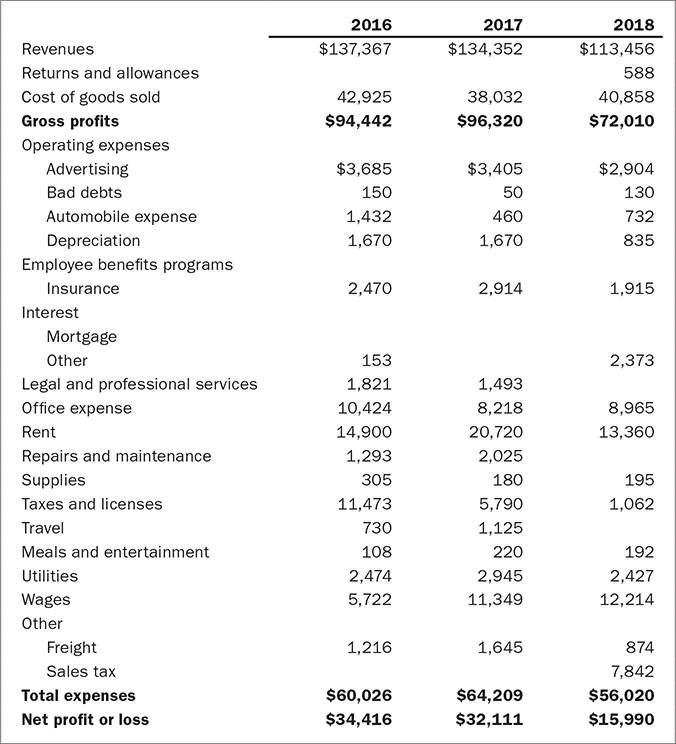
FIGURE 4-6 Turner Company Income Statement (Selected Years)
*Note: The cash accounting method was used for 2016 and 2017. The accrual accounting method was used for 2018
By examining the income statement, we will be able to better understand how management is handling the company’s overall operations. Using financial ratio analysis, we will assess how well the company’s resources are being managed. A good analysis will enable a potential buyer to assess, for example, whether the company is worth acquiring, based on its strengths and weaknesses, and to determine how much to pay for it.
When analyzing the numbers, it is important to (1) look at the numbers and compare them with historical performance or with a benchmark such as an industry average to assess how the company is performing in that specific area, and (2) highlight any trends. The importance of trends as one looks at financial statements is that they are used to predict the future. One should always ask, is there a trend in this line item? Is it an upward or a downward trend? What are the main reasons for this trend? What does the trend mean for the future?
The following assumptions should be made in the analysis of the Turner Company case:
• This company is a cash business; there are no receivables.
• It is owner-operated.
• The numbers provided are correct.
An analysis of every line item could be made, but our analysis will focus on three of the most important items: revenue, gross profit, and net profit.
Revenue Analysis
The analysis of a company’s historical annual revenue includes answers to the following questions: What are the sales growth rates for the past few years? What is the trend in sales growth? Is it declining or increasing? Why are revenues increasing or decreasing? Not only should you be concerned about whether or not revenues are increasing, but you should also ask whether the increase is consistent with what is taking place in the industry. Sales increasing for a short period may not be good enough. You need to compare a company’s sales growth with the rate at which you want it to grow. The absolute minimum amount that you want sales to grow, at an annual rate, is at the rate of inflation, which from 2009 through the first quarter of 2019 has averaged approximately 1.81% per year.10 For example, in the professional sports industry, since 2003, the average annual percentage increase in ticket prices for the four major sports leagues (the NBA, NFL, NHL, and MLB) has been 3.53%.11 The revenue in the cable TV industry has had a compounded annual growth rate of 17.76% from 2013 to 2018.
Revenue for the Turner Company has been declining. Revenues declined by 2% between 2016 and 2017 and by 16% between 2017 and 2018. This downward trend is a cause for concern. Some of the reasons for the decline in revenues may be:
• Price increases resulting from higher costs.
• The owner is despondent, and either he is not managing his business properly or he simply is not present at the company.
• Increased competition, as a result of the high gross margins, could be putting pressure on prices. One way to keep prices high is to have a patent on a product, which allows the owner to set the price fairly high. This assumes, of course, that there is a demand for the product or service. When the patent expires, the business will inevitably face competition.
• The product could be becoming obsolete.
• An unanticipated event or an act of God, known in the legal profession as a “force majeure,” could be one reason for the decline in revenue. For example, there could have been a tornado or a severe rainstorm, and the storage area where the entire inventory was kept could have been flooded, thereby damaging inventory and reducing the volume that was available for sale.
• There could have been construction outside of the company’s place of business that prevented easy access by customers.
Thus, there are, in some instances, legitimate reasons why revenue could be decreasing that have nothing to do with the soundness of the business or its management. When undertaking financial analysis, it is important to consider all likely scenarios.
While strong revenue growth is typically viewed positively, it can also be a sign of bad tidings. The fundamentals of finance associate excellent revenue increases with at least corresponding increases in the company’s net income. The best example of this point is Microsoft. In one decade, Microsoft’s revenues grew 17 times, from $1.18 billion to $19.8 billion. During the same time period, its net income grew an astounding 28 times, from $279 million to $7.79 billion! On a larger scale, the Fortune 500 demonstrated this concept in historic fashion between 2000 and 2006. Aided by strong productivity gains and a growing economy, the largest American companies grew earnings an astonishing 80% while revenue growth grew 38%. During this period, post tax profit margins hit 7.9%, a 27% increase over the already impressive 6.2% margins in 2000.12
But if revenues are growing because prices have been lowered, then that means that the company is probably growing at the expense of margins. Therefore, the growth may not, in fact, be profitable. For example, one year with the support of price cuts, Hewlett-Packard’s sales increased 13%. Despite this good news, the company experienced a loss in excess of $100 million.13
Another issue with regard to revenue growth that you should be aware of is that the growth may be occurring because competitors are conceding the market. Competitors may be leaving the market because the product will soon be obsolete, or perhaps they are leaving because the ever-increasing cost of doing business—things such as liability insurance—is driving them out of the market. Thus, it is just as important for the entrepreneur to know why she is experiencing excellent growth as it is to know the reasons for low or no growth. The successful entrepreneur knows that revenues should be grown strategically. It is well-managed growth that ultimately improves the profitability of the company.
Sometimes growing too fast can be just as damaging as not growing at all. A few problems that are common when rapid growth occurs are poor quality, late deliveries, an overworked labor force, cash shortages, and brand dilution. Unmanaged growth is usually not profitable. For example, Michael Dell, the founder of Dell Computers, said, “I’ve learned from experience that a company can grow too fast. You have to be careful about expanding too quickly because you won’t have the experience or the infrastructure to succeed.”14 The story of 180s, a sports apparel company, further demonstrates the dangers of growing too fast. At one point, the company was ranked number 32 on the prestigious Inc. 500 list of fastest-growing companies. The firm grew revenues from $1 million to $50 million five years later. However, by year 6, 180s was suffocating under too much debt and was taken over by a private equity firm. Lamenting the company’s impending sale, Bernie Tenenbaum, a venture capitalist who had considered investing in 180s at one point, said, “I’d say they’d be lucky to get 10 cents on the dollar.” Actually, he was optimistic—it turned out to be 8 cents on the dollar. Bill Besselman, a onetime partner with the co-owners of the firm, explains their failure: “In the end, they grew the top line, but they didn’t manage the bottom line. They got sucked into the vortex.”15
Even Starbucks, one of the greatest entrepreneurial stories of all time, at one point suffered from unmanageable growth that diluted its brand and caused it to fall behind Dunkin’ Donuts in customer loyalty. Starbucks chairman Howard Schultz explained how growing too fast caused this problem: “Over the past ten years, in order to achieve the growth, development, and scale necessary to go from less than 1,000 stores to 13,000 stores and beyond, we have had to make a series of decisions that, in retrospect, have led to the watering down of the Starbucks experience, and, what some might call the commoditization of our brand.”16 Starbucks took steps to correct this problem by announcing the closing of hundreds of underperforming stores across the United States, and has rebounded to over 28,000 stores in 2018.
The Largest Customer
Inherent in the growth issue is a key question: How large is the company’s largest customer? Ideally, an entrepreneur’s largest customer should account for no more than 10 to 15% of the company’s total revenues. The reasoning is that a company should be able to lose its largest customer and still remain in business. Of course, the ideal is often not the reality. One survey of 300 manufacturers in the apparel and home goods industries showed that over half of these firms received more than 20% of their sales from their largest customer.17 The goal should be to diversify your client base while maintaining the benefits of economies of scale. An example of a company that suffered as a result of not properly diversifying is Boston Communications Group, Inc. (BCGI). Verizon Wireless, which represented approximately 20% of BCGI sales, decided to end the relationship between the two companies.18 BCGI’s shares, which had traded as high as $22, dropped 50% in one year. The company was unable to recover. Two years later, it laid off 21% of its workforce and fired two of its top officials. The company was finally sold for $3.60 per share, less than 20% of its highest value.19
Interestingly, many companies find that losing the customer that generates the largest amount of revenue actually improves the company’s profitability, because the largest customers are rarely the most profitable. The reason is that customers who purchase large volumes are often invoiced at lower prices. For example, Morse Industries, a private lamp manufacturer, was ecstatic when it got Walmart, the country’s largest retailer, as a customer. The addition of Walmart increased its revenue by more than 50% in one year. But after one year, the company decided to drop Walmart as a customer. Why? The revenues of Morse Industries had grown enormously, but the gross, operating, and net margins had actually declined because the company charged Walmart 25% less than it charged its other customers. Another reason for the decline was that Walmart’s orders were so large that Morse Industries’ labor force could barely produce enough. The result was that orders placed by other consumers, who were not receiving a discount and therefore were generating higher margins, were being delayed or even canceled. Several of these long-term, excellent, paying customers quietly moved their business from Morse Industries to another supplier.
The founder of Morse solved the company’s problem after he performed an analysis of his company’s growth and found that it was not profitable. His analysis included using the matrix shown in Figure 4-7 to define each customer and the importance of that customer.
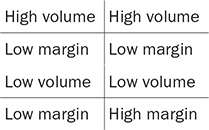
FIGURE 4-7 Customer Analysis Matrix
Source: Susan Greco, “Choose or Lose,” Inc., December 1998, p. 58.
He defined the categories as follows:
• High volume/low margin. Customers that provided revenues greater than $1 million per year, with gross margins of no more than 35%.
• Low volume/low margin. Customers that provided revenues of less than $1 million per year, with gross margins of no more than 35%.
• Low volume/high margin. Customers that provided revenues of less than $1 million per year, with gross margins in excess of 35%.
• High volume/high margin. Customers that provided revenues greater than $1 million per year, with gross margins in excess of 35%.
His initial response was simply to drop the customers in the low-volume/low-margin section. But on second thought, he decided to analyze the data even further to determine how profitable each customer was to the company by performing a contribution margin analysis on each customer.
Equation 4-3 shows the contribution margin formula.
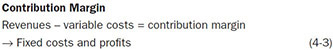
The contribution margin is the difference between revenues and all the variable costs (the costs that would not be incurred if this customer left) associated with a unit of product. Therefore, it is the profit available, after breakeven, to contribute to the company’s fixed costs and profits.
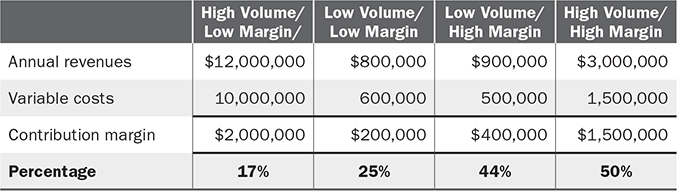
The contribution margin analysis is presented in Table 4-8. Clearly, as you can see from the table, the least profitable business was not the low-margin/low-volume business, but rather the high-volume/low-margin business. Therefore, Morse attempted to raise its prices to customers who fell into these two categories. Several of them refused to accept the price increase, including Walmart, so he dropped them. His growth strategy for returning the company to profitability included attempting to grow the volume of the remaining customers, who fell into the high-volume/high-margin and low-volume/high-margin categories, without decreasing prices. The second part of the strategy was the implementation of a policy that all new business had to have at least a 40% contribution margin. While his revenues in the immediate term went down, his net profits and cash flow increased dramatically. Ultimately, his revenues increased, as a result of his ability to maintain high quality standards and ship promptly. Most important, his profit dollars and percentages also increased.
TABLE 4-8 Customer Analysis Calculation
The lesson: growth for the sake of growth, without regard to profitability, is both foolish and harmful and will inevitably lead to insolvency. Many businesses engage in such growth in the name of gaining market share. But evidence repeatedly shows that the companies with the strongest market share are rarely the most profitable. A study of more than 3,000 public companies showed that more than 70% of the time, firms with the greatest market share do not have the highest returns, as the examples in Figure 4-8 show. The study found that the key to success for smaller, more profitable competitors was their absolute vigilance in controlling costs and eliminating customers who returned low margins.
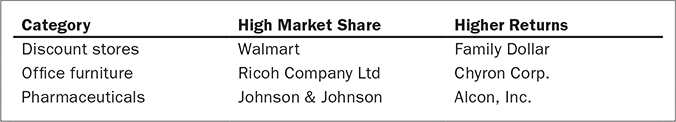
FIGURE 4-8 High Market Share Versus High Returns
Two examples illustrate the danger of focusing on sales. In 2012, Toyota sold approximately 9.75 million vehicles worldwide, and US carmaker General Motors sold 9.29 million vehicles.20 Toyota earned $14 billion in profit, while its American counterpart, GM, lost $31 billion.21 How did this happen? GM obviously was not focusing on profits. In the world of video game consoles, the importance of profitability rather than market share was demonstrated in the battle among Nintendo, Sony, and Microsoft. Sony’s PlayStation and Microsoft’s Xbox consoles had dominated the market for years. In early 2006, however, Nintendo recorded close to a billion dollars in profit on its Wii console, while Sony’s game division was barely profitable and Microsoft lost money on Xbox.22 Neither of the three console-makers could withstand the economic slowdown, however, from 2007 to 2012, as sales declined consistently for each company. By 2012, Nintendo’s operating profits weakened to negative $386 million on $6.7 billion in sales.23
Additional support for the case for looking at the bottom line comes from evidence from a survey completed by J. Scott Armstrong and Kesten C. Green that showed that companies that adopt what they call “competitor-oriented objectives” actually end up hurting their own profitability. To restate their point, the more a firm tries to beat its competitors, as opposed to maximizing profits, the worse it will fare. A Harvard Business School study, Manage for Profit, Not for Market Share,24 estimated that companies that let market share or sales volume guide their actions sacrifice 1 to 3% of their revenue. In hard numbers, a manager of a $5 billion business leaves between $50 and $150 million in his customers’ and competitors’ pockets every year by focusing on market share rather than on the bottom line.
Gross Margins
One of the initial financial ratios that business financiers examine when reviewing the income statement is the gross margin. What is a good gross margin? Well, a “good” gross margin, like all the other items we will be analyzing, is relative and depends on the industry in which a company operates. In general, gross margins of 35% and above are considered to be very good. Table 4-9 provides comparative gross margins for different companies.
TABLE 4-9 Comparative Gross Margin Percentages
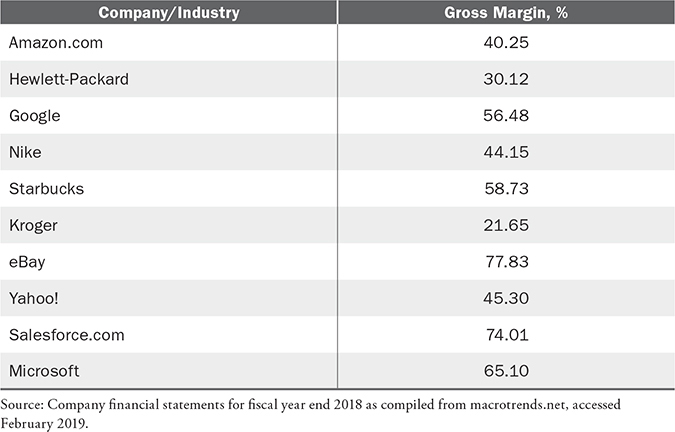
Gasoline stations generally have razor-thin gross margins, ranging between 9 and 11%.25 The farming industry is slightly better with 2018 average gross margins of 12%
There are several industries in which companies make better than average gross margins. For example, Nike’s average gross margin is about 44%, whereas Starbucks had gross margins of 58.13% in 2018. Some years ago a cup of Starbucks espresso had a 90% gross margin, which meant its costs to make the expresso was only 10% of its selling price!26
Gross margins are also very high in other businesses, some of them illegal. University of Chicago economist Steven Levitt and Harvard sociologist Sudhir Venkatesh undertook an analysis of the financial books of a drug gang—a very rare set of financial statements to analyze. Not surprisingly, they found that the gang was able to reap very high gross margins—approximately 80%—by selling crack cocaine.27
A venture capitalist once stated, “Gross margin is the entrepreneur’s best friend. It can absorb all manner of adversity with two exceptions, philanthropy or pricing stupidity. Actually, in this case the two are synonymous.”28 Good gross margins provide a novice entrepreneur with breathing space, allowing her a chance to make costly mistakes and still be potentially profitable. On the other hand, in a low-gross-margin business—such as grocery stores, for example—management mistakes and waste, as well as theft and pilferage, must be minimized, because the margins are too thin to be able to absorb these costs. A low-gross-margin business must also have volume, whereas a high-gross-margin business may be able to sacrifice unit volume sales because its ultimate profit comes from the high margins. The ideal business, like Microsoft, dominates its industry in terms of units of volume, while at the same time maintaining high gross margins. This is a rarity. High-gross-margin industries inevitably attract competitors who compete on price, thereby reducing gross margins throughout the industry.
For example, independent retailers of books used to enjoy gross margins in excess of 35%. Those attractive gross margins were the primary reason that Amazon.com entered the market and now dominates it. In fact, 25 years ago, independent retailers sold 60% of all book titles. Since 1991, the independents’ share of the book market has declined from 32 to 10%. The big competitors increased because of the attractiveness of the gross margins.29
I always tell my MBA students, “If you leave here, start your own business, and are lucky enough to have good gross margins, for God’s sake, don’t brag about it.” If someone asks you, “How’s business?” your standard reply should be a simple shrug of the shoulders and a polite response of, “Not bad; could always be better.”
Gross margins are a factor that the entrepreneur should focus on very heavily, both in the business plan and in operations. Good, healthy gross margins do not usually happen by chance. They may happen by chance for the “mom-and-pop” entrepreneur who runs a business haphazardly. Because the strategy is to sell whatever it can sell at whatever cost, the mom-and-pop enterprise expects to absorb the costs and take whatever falls to the bottom line.
A high-growth entrepreneur, in contrast, is one who manages with a plan in mind. This entrepreneur expects to grow the company at a certain rate and plans to have a certain level of gross margins. A high-growth entrepreneur is one who wants to have a company for the purpose of wealth creation and therefore is an absolute bulldog when it comes to managing gross margins. The question that logically follows is, how can gross margins be increased?
Cut Labor and/or Material Costs
The following are ways to reduce labor costs:
• Train the workforce to increase productivity.
• Reduce the labor force and have fewer employees work more efficiently. One year, Cisco, the global leader in networking equipment, reduced its 66,000-strong workforce by 4,000. That same year it reported a quarterly profit of $2.3 billion, which was 18% higher than the $1.9 billion in profit generated in the same quarter of the prior year.
• Reduce employee absenteeism (employees who do not show up for work without notice), which results in increased labor costs because of the need for expensive temp or overtime pay. In the call center industry, for example, average per day absenteeism is 6%; outsourced call centers face 10% per day absenteeism rates, while in-house telecommunications firms experience only 4.8%.30
• Make the workforce more productive by upgrading technology. For example, McDonald’s franchisees reduced labor costs through automation, to the point where one person can now do what it used to take four people to do in terms of cooking and food preparation.
• Increase volume. The cost per item produced or cost per service rendered should go down as the volume goes up. Labor costs should go down as employees gain more experience. People learn more and therefore should become more efficient, even if this is not done through the introduction of new technology.
• Find a cheaper labor force. Companies can move their operations to a different region of the country or abroad, where labor is cheaper.
• Provide employees with stock options, restricted stock units, or other incentive programs in lieu of higher salaries.
• Reduce employee benefit costs. Employer health insurance premiums have risen and outpaced the rate of inflation and worker wage growth since 2000. Between 2000 and 2005 it increased 69%, and between 2005 and 2010, and 2010 to 2015, by 27%. The world of health insurance is ever changing, but options such as health savings accounts, health reimbursement arrangements, and government-sponsored benefits included in the Affordable Care Act offer mechanisms enabling employers to control costs.31
• Continually turn over the workforce, reducing the number of higher-paid unskilled workers. For example, fast-food restaurants expect and want a certain amount of annual turnover in their unskilled employees because newer workers cost less.
• Implement good management skills. One of the easiest ways to reduce labor costs is simply for entrepreneurs to manage their employees. They need to follow the good old way of managing people, which means stating expectations, giving employees the necessary tools, and holding them accountable for their performance.
The following are ways to reduce material costs:
• Obtain competitive bids from suppliers, which may allow for the purchase of materials at lower cost.
• Buy in higher volumes to get volume discounts. The problem here is the inventory carrying cost. Ideally, one does not want to increase inventory. Therefore, the entrepreneur should make commitments to its suppliers to buy a certain volume within a specified period of time. Such a commitment should result in price-volume discounts. The commitment versus buy strategy allows entrepreneurs to keep inventories low, costs down, and cash available for other investments or uses.
• Outsource part of the production. Someone else may be able to produce a piece of a product or render a specific part of a service at a lower cost.
• Use a substitute material that can be purchased at a lower cost in the production process. Ideally, you want to keep the quality of the product the same, but there is a possibility that you can get a substitute material that may be less expensive.
• Manage waste, pilferage, and obsolescence. Materials that have been stolen, thrown away, or destroyed, or that are just sitting around because of obsolescence, negatively affect material costs.
• Do quality control checks throughout the various stages of the manufacturing process before additional value is added. This is in contrast to the traditional way of checking quality only at the end of the process. Waste and rework costs are always greater when you use the process of checking quality at the end.
• Let the most experienced and trained people perform the most detail-oriented or labor-intensive work—for example, cutting all patterns—because they should be able to get more cuts per square yard than an inexperienced person. For example:
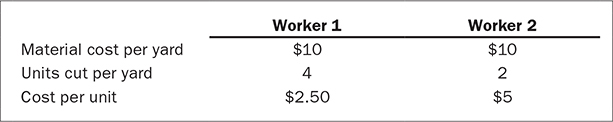
Thus, the cost per unit for Worker 1 is lower because there is less material wasted.
Raise the Price
Raising the price of the product or service will enable the entrepreneur to increase gross margins, assuming, of course, that costs do not increase proportionately. While a great deal is made in the press of the various factors that can allow a company to have pricing power, the best way to increase profitability through price increases is by differentiating and creating value for which the consumer will pay.
Amazingly, there have been companies that, for a short time, were successful in challenging the importance of business fundamentals with regard to gross margins. For the most part, this was true in the e-commerce industry during the dot-com boom, where most companies were primarily focused on growing revenues, even when it was at the expense of gross margins. For example, Buy.com formerly sold merchandise, including CDs, books, videos, software, and computer equipment, at cost and, shockingly, sometimes even below cost. The company guaranteed that it had the lowest prices available on the Internet. The result was zero and sometimes negative gross margins! Despite these facts, buy.com, which was founded in 1996, had 1998 revenues of $111 million and a public market valuation in excess of $400 million.32
But soon reality set in, and by September 2001, the vultures were circling with stockholder class action lawsuits. In just over a year, Buy.com’s stock price had dropped from its opening-day price of just over $30 a share to about $0.08 per share. Its stock was delisted from the NASDAQ on August 14, 2001. Infamous cases of this kind—where managers “fumble the fundamentals”—play out every day in far more subtle ways in every business sector. When entrepreneurs ignore the fundamentals of finance or simply trust someone else to stand guard, they invite trouble to the table.
Before we close this section on gross margin, let us analyze the Turner Company. What are the gross margins for the Turner Company? They are as follows:
• 2016: 70%
• 2017: 72%
• 2018: 64%
The company has excellent gross margins—in excess of 60% for all three years. However, one sees an 8 percentage point decline in gross margins in 2018, indicating that something has changed.
What are some of the possible reasons for a decline in gross margins?
• There may have been a change in the product mix being sold. A higher percentage of lower-margin items may have been sold.
• The cost of supplies may have gone up.
• The company may have changed its accounting system from a cash system to an accrual system (as, in fact, it did). This change in accounting system does not change the timing of cash receipts; and since this is a cash business, and therefore the company does not have receivables, the change in the system will not affect the timing of when revenues are recognized. However, the change in the accounting system forces the company to recognize costs earlier. The result of this change is potentially lower gross margins because costs are being recognized earlier, and therefore lower net profit as well.
• The company may be buying from different suppliers at higher costs and/or selling to different customers.
An examination of the income statement shows that 2018 was the first year in which products were returned. Also, and more important, as the note at the bottom of the statement shows, there was a change in the accounting method, from cash to accrual. As we just stated, the change does not affect revenues, because this is a cash business, but it does have a negative effect on all three margins because more expenses are being recognized. Therefore, as a result of the change, we are not comparing “apples to apples” with the prior year.
Net Margins
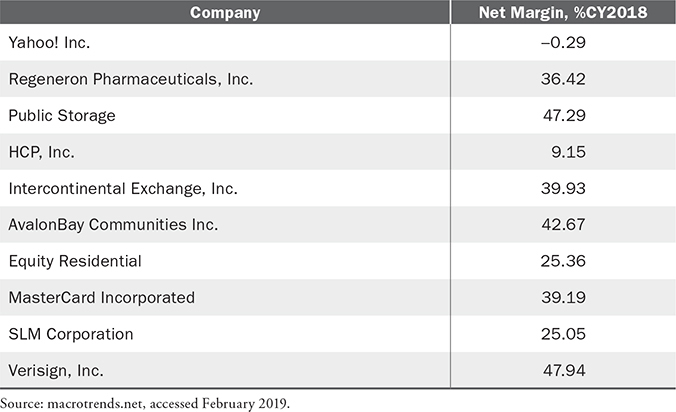
What are acceptable net margins? We have determined that the Turner Company has outstanding gross margins. But how do its net margins compare? In general, net margins of 5% or better are considered very good. According to Hussman Funds, since 1955, the average profit margins of the 500 largest US companies have ranged between 5.5% and 7.5%. In 2018, the S&P 500 Index of US companies reported the second highest net profit margin in 10 years, at 11.6%.33 The top 10 companies in the S&P Index in terms of net margin are shown in Table 4-10.
TABLE 4-10 Net Margins of Top 10 S&P 500 Companies
Privately owned companies want to minimize taxes, and therefore they reduce operating income, which in turn reduces their net income. The point being made is that for these companies, net income is usually a manipulated number that understates the company’s true financial performance. A few exceptions might be companies that are preparing to go public or be sold. These companies may want to look as financially strong as possible.
In contrast, a publicly owned company aggressively seeks positive net margins, as high as possible, because the net margin affects the stock price. As one money manager remarked, “There is a greater tendency among companies to pull out the stops to generate the kind of positive earnings that Wall Street demands.”34
The greatest example of this kind of chicanery was the case of Enron, the onetime darling of Wall Street. Through off-balance-sheet transactions, Enron masked hundreds of millions of dollars of losses in its effort to continually beat analysts’ estimates. The house of cards eventually crumbled, and one year after ranking number 7 on the Fortune 500, Enron filed for bankruptcy. The carnage was severe, with more than 5,600 employees losing their jobs, and in many cases their life savings. More than 20,000 creditors were left holding $63 billion in debt, and tens of billions in shareholder value was lost.35,36
Government regulation has targeted this kind of fraudulent behavior, and it has had an impact. A survey indicated that 59% of CFOs disclosed more information in financial statements than they had previously done, and 57% said that they planned to disclose more information in the next 12 months.37 Moreover, the Sarbanes-Oxley reform act targeted this kind of abuse and changed the way in which corporate boardrooms and audit firms operate. However, this problem will never completely go away. Therefore, when analyzing the financial statements of a privately or publicly owned company, beware. Things may be significantly different from what the statements show.
The problem with looking just at net income for a public or a private company is that net income does not pay the bills. Cash flow pays the bills. Net income typically understates the company’s cash flow because it includes noncash expenses such as depreciation and amortization. In addition, expenditures that have nothing to do with the operation of the company may also be included, thereby lowering the company’s net income. It is common for owners of private companies to run certain personal expenditures through their income statement because they view this as one of the perks of ownership. Therefore, one must realize that net income can be, and usually is, a manipulated number. For example, the late Leona Helmsley, owner of several upscale hotels in New York while she was alive, made improvements to her personal home and charged them against her company, thereby reducing the taxes owed. She was convicted of tax evasion as a result and served time in prison. One of the smoking guns used to convict her was an employee who quoted her as saying, “Only poor people pay taxes.”
The reality that net income can be a manipulated number is best illustrated by a controversy regarding the movie Forrest Gump. The movie has grossed more than $600 million worldwide, making it one of the highest-grossing movies in history. The screenwriter agreed to take a percentage of the movie’s net income as his compensation. Believe it or not, this movie never reported a positive net income, and thus the writer was due nothing. The issue was in dispute for a number of years before being resolved. What is the entrepreneurial moral of the story? As an investor, never agree to take a percentage of the net income because you cannot control the expenses, be they real or make-believe.
Conversely, if you are the entrepreneur, always try to compensate investors based on net income, never on revenues. Basing compensation on revenues has gotten many entrepreneurs in financial trouble, because giving someone a percentage of revenues (“off the top”) ignores whether a company has a positive cash flow.
The final problem that must be highlighted, with regard to putting too much importance on net earnings, is that the net earnings figure does not tell you where the earnings came from. Did they come from strong company operations or from financial instruments? A fundamentally sound company derives most of its earnings from operations, specifically from product sales or services rendered, not from interest earned on invested capital. The primary reliance upon interest earned would force the company to be in the money management business.
Before we close this section, let us analyze the net income of the Turner Company. The net margins for the Turner Company are 25, 24, and 14% for 2016, 2017, and 2018, respectively. This would indicate that the company’s net margins are outstanding. The trend, however, is downward, with the caveat that the final year was negatively affected by the change in accounting method previously discussed.
Other Issues to Consider
Following are some other issues related to financial statement analysis.
Is the Owner Managing the Business Full Time?
When evaluating the income statement of the Turner Company, one can find evidence that the owner may not be at the place of business on a full-time basis. First, there is an increase in wages, which may represent the hiring of a new employee to run the business because the owner is taking more time off. An examination of a company’s financial statements requires a thorough analysis of the wages section. It is important to ask, who are the employees? Do these employees actually exist? In some cities like Chicago, dead men have been known to vote in elections, and they have also appeared on city payrolls. During the due diligence, if the name of an employee is provided, you should look to see whether the last name of the employee matches that of the owner. It would also be wise to follow up with the question, “How many employees are relatives, and what are their specific tasks and responsibilities?” Wages may have increased because a relative of the owner has been added to the payroll and is being paid an exorbitant wage for doing nothing or for doing something as simple as opening and locking up the company every day.
Figure 4-9 (see next page) presents financial projections for 2019 for the Turner Company, based on historical information.
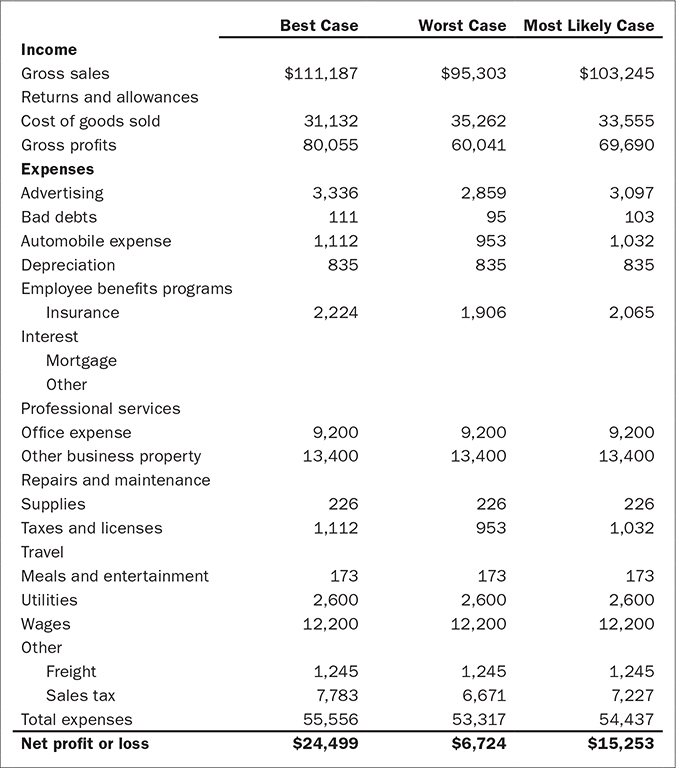
FIGURE 4-9 Turner Company Pro Forma Income Statement for 2019
How can you be sure that the numbers are correct? In all likelihood, they will not be. It is rare that the actual numbers meet the projections. Pro forma development is simply educated guessing.
Revenues
Historically, if we look at the Turner Company pro forma income statement shown in Figure 4-9, the best case is a decrease in revenue of 2%; the worst case is a decrease of 16%. And the most-likely-case scenario is taken as an average of these two extremes—a decrease of 9%. This is a reasonable, logical argument for preparing the projections for sales revenue.
Gross Margins
With regard to gross margins, there were no clear trends during the three years of data that were provided. Gross margins increased between 2016 and 2017 and then declined between 2017 and 2018. The best-case gross margin would be 72%, the worst-case gross margin would be 64%, and the most-likely-case scenario would be an average of the two—68%. Again, there is very logical reasoning behind the development of these projections, which is what financiers hope to find.