
6
Valuation
Introduction
When I teach my MBA students about entrepreneurial finance, on Day 1 of the classes, I run through an exercise in which students attempt to value a company. You should know that many of these students have previously sat through high-level finance classes, know about discounted cash flows, and have their heads full of formulas. We look at the numbers. “Tell me what you would pay for the company,” I demand. The valuations range from zero to $300,000. Actually, I tell them, when the company was sold, it went for $38,000. It sold for the price of its inventory. There is a story behind the valuation that is not quantitative. The owner had to sell the company because his wife had told him that if he did not, she was going to leave him and retire to Florida by herself. It had nothing to do with a multiple of cash flows, multiple of revenue, or anything other than that he simply had to get out of the business.
Here is the lesson: valuation is very tricky and can never be done in a vacuum. Entrepreneurs must learn the methods used to value companies and become comfortable with the “ambiguity of valuation” and the fact that the valuation process is not a hard-and-fast science. The story of Bain Consulting highlights this fact. Bill Bain, a former vice president at Boston Consulting Group, and seven partners founded the consulting firm Bain Consulting. When the firm reached $220 million in annual revenues, the eight partners decided to sell 30% of the company to a Bain Employee Stock Option Plan (ESOP) for $200 million. This transaction gave the company an implied valuation of $666 million. A few years later, the vice presidents of the company took legal action against these partners, which ended in the partners returning $100 million to the company as well as the 70% of the company’s equity that they held. This transaction, in which the eight partners essentially sold 100% of their equity back to the company, changed the valuation from $666 million to $200 million, a reduction of more than 70%! The point of this story is to show that even a world-class organization such as Bain, filled with brilliant MBA graduates from some of the finest business schools in the country, including Kellogg, Harvard, Stanford, and Wharton, could not initially come up with the “correct” valuation.
Let me repeat this again. The valuation of a company, particularly that of a start-up, is not an exact science. As Nick Smith, a venture capitalist in Minnesota, stated, “Valuation in a start-up is an illusion.” Therefore, the true value of a company, be it a start-up or a mature business, is established in the marketplace. Very simply, a company’s ultimate value is the price agreed to by the seller and the buyer. This fact can be traced back to the first century b.c., when Publilius Syrus stated, “Everything is worth what its purchaser will pay for it.”
One of the best examples of this fact is highlighted by the story of Apple Computer and Be, Inc., when the CEO of Apple Computer, Gil Amelio, began negotiations to buy Be, Inc., from its CEO, Jean-Louis Gassée. Be had developed a new operating system called Be OS that some people in the industry said “put Apple’s Macintosh and Microsoft’s Windows to shame.”1 Like most opportunistic entrepreneurs, Gassée was more than willing to sell his six-year-old entrepreneurial venture, which he had financed with $20 million from venture capitalists and other private investors. Be, Inc., had 40 employees and approximately $3 million in annual revenues. Amelio offered $100 million for the small company. However, Gassée thought the value of Be, Inc., was much greater and countered with a $285 million asking price, which amounted to approximately 10% of Apple’s valuation at the time.
Amelio refused to offer anything over the $100 million price. Instead, he bought the more established NeXt Software, Inc., which, ironically, had been founded by Steve Jobs, Apple Computer’s founder and its CEO until shortly before his death. Therefore, what was the value of Be, Inc.? It was an amount between $100 million and $285 million. And what happened to Be, Inc.? A few years after rejecting Apple’s offer, NASDAQ regulators told the company that they were delisting it for failing to maintain a minimum bid price of at least a dollar for 30 consecutive days. Be, Inc.’s shares were trading for about 14 cents. That same month, Be, Inc., announced that it would sell its remaining assets and technology to Palm Inc. for $11 million.
This overvaluation experience taught Gassée the valuable lesson that all entrepreneurs must learn: “Pigs get fat and hogs get slaughtered.” He could have been a nice fat, happy pig by accepting the $100 million. Instead, he got greedy, a common trait of hogs, and got nothing.
Despite the fact that business valuation is not an exact science, entrepreneurs should determine a value for their company at least once a year. This process must not intimidate them. As has been repeatedly stated throughout this book, this is not brain surgery. In fact, it can be rather simple, and almost everyone can do it. What is the reason for performing an annual valuation of a company? There are many. If the entrepreneur does not determine the value of his company, then someone else will, and the entrepreneur will not be happy with the result. For example, if the entrepreneur is selling his business and relies entirely on a prospective buyer to determine its worth, the buyer will certainly look out for her own interests and price it low. The entrepreneur must, therefore, look out for his own best interests by establishing a price that he is comfortable with, using logical and acceptable valuation methods. Which methods are correct? As you will see later in this chapter, all of them.
Valuation involves estimating the worth or price of a company. Different industries use different methods to determine this value. Some industries use complicated quantitative models, while others use relatively simple approaches. Regardless of the methodology used, however, the valuation of a business incorporates not only a financial analysis of the company, but also a subjective assessment of other factors that may be difficult to quantify, including:
• Stage of the company
• Management team assessment
• Industry
• Reason the company is being sold
• Other general macroeconomic factors
Ultimately, the value of a company is driven by the present and projected cash flows, which are affected by all the factors just mentioned. As Bill Sutter, a former venture capitalist at Mesirow Partners, said to a class of MBA students, “Where does value come from? Cash flow. It does not come from assets or revenues. It comes from cash flow.”
This belief is in contrast to the wild valuations given to companies during the dot-com era of the late 1990s that turned into the “dot bomb” era of the early 2000s when most of those companies went bankrupt. We see similar things happening today with the IPOs of Lyft and Uber in 2019. These companies have never generated positive cash flows. Despite this, Lyft was valued at $24 billion and Uber at $75 billion when they went public. I refer to these wild valuations as being “Back to the Future” as these unprofitable companies are being bolstered by the public markets similar to what we experienced during the dot-com era. But there are a couple of major differences between now and then. The first is that companies like Uber have raised hundreds of millions of dollars from private investors. Second, they have used that capital to actually build a company that has billions of dollars in annual revenues. The dot-com companies raised most of their capital in the public markets and never demonstrated that they could generate meaningful revenues.
Valuing the Turner Company
At the beginning of this chapter, I shared the story about the owner whose selling price had more to do with his wife’s threats than with any fancy formula. The company is called the Turner Company, and it is worth examining in a bit more detail. As we discussed in Chapter 4, the Turner Company had 2018 revenues of about $113,000. The cash flow that the business generated was an astonishing $45,000, or 39% of revenues. This was calculated after scrutinizing the income statement and asking the seller questions. Remember, the starting point for calculating cash flow is net profit plus depreciation plus any other noncash item expenditures. In this case, we add the just under $16,000 in net profit and the $835 for depreciation. Cash flow calculations will often also include discretionary expenses that the new owners of the business would not incur if they were to acquire the company. For Turner Company, the additional add-backs include wages, which were in fact wages ($12,214) being paid to the owner’s spouse.
In reality, the $8,965 allocated for office expenses covered personal expenditures for a new car that his wife drove that the owner was running through the company. In addition, as the owner of the business also owned the building that the business was renting, he was in effect renting the building to himself. The company was paying about $7,000 more than market value for the rent for this building.
This company is really “a little engine that could.” To value this company or any other, many different valuation methods could be used. For example, using a conservative multiple of 3 in the multiple of cash flow valuation method, the company’s valuation is approximately $135,000 (3 × $45,015). If another valuation method, such as multiple of revenues, were used, then a different value could be determined. For example, if a conservative 0.9 multiple of revenue was used, Turner Company’s value would be $101,700. Turner actually sold for $38,000, which was the value of the inventory on hand. Why did it sell for the price of the inventory? Again, the answer was that the owner had to sell it. His wife had told him that if he did not sell, she was going to leave him and retire to Florida by herself. The price was not determined by using a free cash flow, a multiple of cash flow, or a multiple of revenue method—or, for that matter, any other valuation method that is usually used in determining the value of a business.
Again, this case perfectly highlights two major points. One is that valuation is not a hard-and-fast science. The second is that the valuation of a business can never be done in a vacuum. A myriad of things, both quantitative and qualitative, affect valuation.
Before we proceed further, it is important that we clarify two terms that are commonly used when discussing valuation. Those terms are premoney valuations and postmoney valuations.
Premoney and Postmoney Valuations
At the beginning of negotiations, private equity investors routinely ask entrepreneurs for the value of their company. When an answer is given, the usual follow-up question is, is the valuation a premoney or a postmoney valuation? Premoney is defined as the company’s value, using whatever valuation models the entrepreneur chooses, before the investment. Postmoney is very simple. It equals the premoney valuation plus the amount of the equity investment.
As we will see later in this chapter, there are several ways to determine the value of a company. These models provide a premoney valuation. Therefore, if the multiple of revenue method creates a $12 million valuation and the company is pursuing $3 million of equity capital, the postmoney valuation will be $15 million if the equity capital is successfully raised.
The significance of the two valuation terms is to ensure that both parties, the entrepreneur and the investor, are viewing the valuation the same way. The other significance is that postmoney valuations determine how much equity the investor gets. This ownership amount is calculated by dividing the investment by the postmoney valuation. Using the previous example, if the premoney value is $12 million, then the person who invests $3 million will get 20% ($3 million invested divided by the sum of the $12 million premoney valuation plus the $3 million investment). Figure 6-1 shows series A premoney and postmoney valuations:
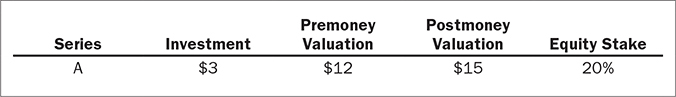
FIGURE 6-1 Premoney and Postmoney Valuation, Series A
The problem arises when the investor thinks the value is postmoney and the entrepreneur considers it premoney. In that situation, if the $12 million valuation is thought to be postmoney, the premoney valuation would be $9 million. The investor thinks that his $3 million investment will get him 25% of the equity ($3 million divided by the sum of $9 million + $3 million), while the entrepreneur wants to give up only 20%.
This is the reason why it is imperative for both parties to quickly agree on what they mean. Therefore, when she is asked by investors whether the valuation is premoney or postmoney, the entrepreneur’s answer should be a resounding, “Premoney with the equity amount for the investor determined by the postmoney valuation.”
Another major point to be made is that the postmoney valuation of the last financing round is usually where the premoney valuation of the next round begins—unless there is an increase in the valuation using another agreed-upon method. In the earlier example, the first round, the “Series A,” was financed at a $15 million postmoney valuation. Therefore, the premoney valuation for the next round of financing, the “Series B,” will be $15 million, and if a new investor puts in $3 million, the new postmoney valuation will be $18 million. The Series B investor will receive 17% of the equity for his second round of financing. Figure 6-2 shows series A and B premoney and postmoney valuations:
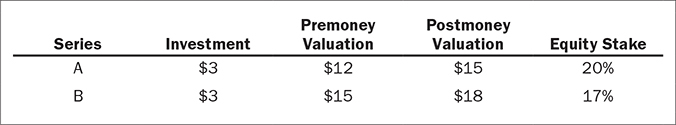
FIGURE 6-2 Premoney and Postmoney Valuation, Series A & B
The Series A investor, who invested $3 million for 20%, will now own 20% of 83% (the balance of the equity after Series B), or 16.6% of the company. Finally, the private equity industry has a rule of thumb that Series B financing should never be done at a valuation more than twice the Series A valuation.2
Why Value Your Company?
There are numerous reasons why an entrepreneur should know the value of his business. These include:
• To determine a sale price for the company
• To determine how much equity to give up for partnership agreements
• To determine how much equity to give up for investor capital
Let us discuss this final point in a little more detail.
How Much Equity to Give Up
It is quite common for entrepreneurs to establish the value of their companies unknowingly when they are raising capital. Many of them will determine the amount of capital they need and at the same time arbitrarily state the level of ownership they wish to retain. Such an act automatically places an implied value on the company. For example, if an entrepreneur is looking to raise $100,000 and says that she wants to retain 90% of the company, the postmoney valuation is $1 million. Another way to say the same thing is that the entrepreneur wants to sell 10% of the company for $1 million. The calculation to determine postmoney valuation is $100,000/0.10.
The most common minimum level of ownership that many start-up entrepreneurs seek is 51%. They believe that this is the minimum percentage they need in order to maintain their control of the company. Therefore, they are willing to give up 49%. The problem with arbitrarily giving up 49% for an investment is that it typically gives the company too low a valuation and leaves it with little equity to sell to future investors.
Another very simple way to determine the level of equity to give up is by calculating the company’s value using the methods that will be cited later in this chapter. This calculation should be done prior to undertaking any fund-raising action. After the valuation has been logically, rather than arbitrarily, calculated, the amount of equity capital needed should be determined. Once these two numbers have been identified, the entrepreneur is prepared to actively pursue investors because he can now tell investors what they will get for their capital. For example, if the company has a postmoney value of $2 million and the entrepreneur is raising $200,000, then the investor will get 10% of the company.
The entrepreneur should be aware of the fact that sophisticated and experienced investors will want to use a more complex formula to determine their future equity position. Investors may determine the equity stake that they want using calculations that factor in the company’s present and future valuations along with time and their desired rate of return. In this instance, four, not two, variables are needed: the future expected value of the company, the amount of capital invested, the investors’ desired annual return, and the number of years that the capital will be invested. This approach is shown in Equation 6-1.
Equity Stake
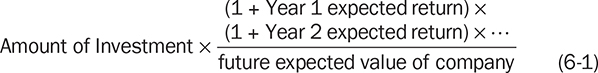
Using this formula, an entrepreneur who is seeking an equity investment of $400,000 for a company valued at $5 million can calculate the amount of equity she should expect to give up to an investor who wants to cash out in four years with an annual return of 30%. See, for example, the calculation shown in Figure 6-3.
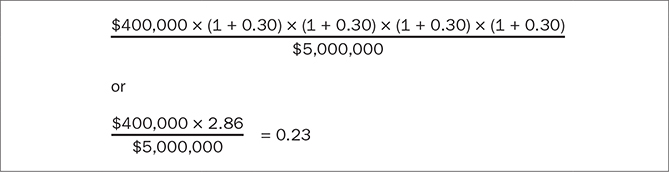
FIGURE 6-3 Equity Stake Calculation: Method 1
This shows that the entrepreneur should expect to give up 23% of the company.
The final way to determine the amount of equity to give up requires knowing the equity investment amount, knowing the investor’s desired return, and placing a value on the company before and after the investment. In the example in Figure 6-4, the entrepreneur established the company’s value at the time of the investment at $10 million, and forecasted that the company’s value would be $40 million in five years. The entrepreneur also found out, by asking the investor, that the investor expected an internal rate of return (IRR) of 38%, which is the same as 5 times the investment in five years. The $5 million investment would generate a $25 million return. Therefore, the $25 million return that the investor would be entitled to equals 63% of the company’s future projected value of $40 million.
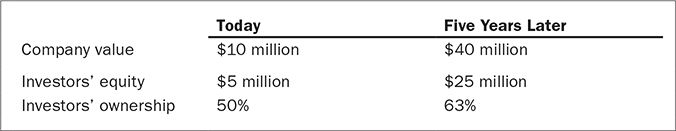
FIGURE 6-4 Equity Stake Calculation: Method 2
Regardless of the reason, however, every entrepreneur who owns a business, or who intends to own one, should have some idea of its worth. Thomas Stemberg, founder of Staples, Inc., gives excellent advice when he notes, “No one will ever value your business as highly as you do. No one really knows how a new business will fare. A company’s valuation is very much a test of your own conviction.”3
Key Factors Influencing Valuation
As noted earlier, the value of a business is influenced by a multitude of factors, qualitative as well as quantitative. Before a final value for any company can be determined, the entrepreneur must identify and review these factors. This procedure is commonly referred to as completing a “contextual factor analysis.” In other words, what is the general context in which the valuation is taking place? A proper valuation of a company does not occur in a vacuum. A solid valuation contextual factor analysis should include the following factors:
• The company’s historical, present, and projected cash flow.
• Who is valuing the company?
• Is it a private or a public company?
• The availability of capital.
• Is it a strategic or a financial buyer?
• The company’s stage of entrepreneurship.
• Is the company being sold at an auction?
• The state of the economy.
• The reason the company is being valued.
• Tangible and intangible assets.
• The industry.
• The quality of the management team.
Let us discuss each factor in more detail.
Cash Flow Status
Historically, the value of a company has been largely driven by its present and projected cash flow. Contrary to this historical practice, however, over the last few years, technology companies, particularly Internet businesses, e-commerce businesses, and social media like Twitter, have created immense value without the existence or even the projection of positive cash flow in the foreseeable future. Despite this fact, which we will analyze and discuss in more detail later in this chapter, the argument of this book is that all entrepreneurs should focus on creating and maximizing value by aggressively pursuing positive cash flow.
The idea that value comes from positive cash flow is rather simple and direct. The entrepreneurial pursuit of business opportunities usually comes with one basic goal in mind: to make more money than you spend—also known as positive cash flow. The other issues involved in why people choose to become entrepreneurs, including to create jobs, nurture an idea, and get rich, are simply by-products of the successful attainment of the goal of making more money than you spend.
Thus, the company’s cash flow is where its true value lies. This cash flow can be used to reward employees with special bonuses, reward owners and investors, or reinvest in the company to make it even stronger in the future. It should be noted that the timing of a company’s cash flows can also affect its value, depending on who is valuing the company. For example, an entrepreneur who is buying a company should give the greatest importance to the targeted company’s present, not future, cash flows. The reason is that future cash flows are uncertain. They are merely projections, with no assurance of achievement. Experienced entrepreneurs like Wayne Huizenga correctly refuse to pay for the unknown. When asked about valuation, Huizenga said, “We pay for what we know, today’s cash flow, not tomorrow’s.”4
The other reason that buyers should base their valuation on today’s cash flow is that future cash flow will come from the work put in by the new buyer. Paying the seller for the company’s future performance would be rewarding the seller for the work that the buyer will do. By doing so, the buyer would essentially be giving away the value that she will create. The craziness of the practice of valuing a company and paying the seller based on a company’s future cash flow is something akin to the following. A prospective homebuyer sees a house for sale in Silicon Valley that has been appraised at $10 million in its present condition and needs a lot of repairs. The buyer does due diligence and finds that once the repairs have been completed, the value of the house will be $30 million. With this information, the buyer makes an offer of $30 million, paying the seller for the work that he is about to do!
Obviously, such a scenario is utterly ridiculous, and the same should hold true with a business. The value of a business to a buyer should be based on the company’s most recent cash flow, not on the future. The difference between the present and future cash flows belongs to the buyer. On the other hand, if the person valuing the company is the seller, she will want the valuation to be based on future cash flow because the future is always projected to be rosier than the present, which would lead to a higher valuation. In the case of a start-up, a valuation based on cash flow projected for the future is acceptable to investors and the entrepreneur because there is no historical or present cash flow.
Finally, the cash flow of a company directly affects its value based on the amount of debt it can service. This can be determined by working backward. The idea is that, for the buyer, the value of a company is primarily based on the amount of debt that the company’s cash flow can service in five to seven years (the typical amortization period for a commercial loan) under the worst-case scenario (the worst-case scenario should be the actual for the most recent year). Most highly leveraged acquisitions have capital structures consisting of 80% debt and 20% equity. Therefore, if an entrepreneur were able to get a seven-year commercial loan for 80% of the value of a company that had a worst-case projected cash flow of $100,000 for the first year, the company’s value would be $875,000.
This valuation is based on the fact that 80% of the company’s value equals $700,000 cumulative cash flow projected over seven years. Thus, each percentage of ownership of the company is valued at $8,750, or 100% equals $875,000. This relationship between value, debt serviceability, and present cash flow is supported by a comment made by Sam Zell after he purchased the Chicago Tribune newspaper over a decade ago with $13 billion in debt. Regarding the projected cash flow for the next year of $1.3 billion, Sam said, “I don’t think you need it to go up, you need for it not to go down.”5 What happened? It went down dramatically resulting in the company going into bankruptcy three years later. Sam later called his Tribune acquisition the “deal from hell.”6
Who Is Valuing the Company?
Are you an entrepreneur who is selling the business or raising capital? Are you the buyer of the entire company or an equity investor? As Stemberg aptly points out:
The central tension in a venture capital deal is how much the new company is worth. The company’s valuation governs how much of it the entrepreneur will own. Venture capitalists yearn to keep the valuation low and take control. Entrepreneurs want to push the number up to raise the maximum amount of cash and keep control themselves.7
Stemberg’s experience with venture capitalists highlights the tension that often exists between financiers (both venture capitalists and others) and the entrepreneur. He notes:
I thought Staples was worth $8 million postmoney when I went out to raise capital. I wanted to raise $4 million for 50% of the company. Relative to the company’s value, are you the insurance company who has to pay a claim, or are you the claimant? The former wants a lower company valuation than the latter. Are you the party in a marriage divorce trying to minimize payments to your spouse as assets are being divided or are you the spouse? The venture capitalists wanted to value the company at $6 million. I struck a deal: The venture capitalists would pay $4.5 million for 56% of the company. Staples was worth $8 million.8
The value placed on a business will depend on which side of the table you sit on. If you are the entrepreneur, you will want as high a valuation as possible so that you give up as little equity as possible. If you are the investor (e.g., the venture capitalist), you will want a low valuation because you will want to get as much equity as possible for your investment. As Scott Meadow, a 20-year veteran of the venture capital industry, said, “I’m going to pay you as little as possible for as much of your company as I can get.”9 This point is best illustrated by Stemberg’s experience that was just cited. The venture capitalists initially wanted 66% of Staples for their investment, compared with the 56% they received. Not all investors are as aggressive as Scott Meadow. Another venture capitalist is quoted as saying, “The key to valuing a company is to do it in a way that enables the investor to get his desired return, while keeping the entrepreneur happy and motivated.” Obviously, this venture capitalist seeks a valuation that creates a “win-win” situation for the investor and the entrepreneur.
Public Versus Private Company
Two companies of similar age, operating in the same industry, producing exactly the same products or services and achieving the same level of revenues, profits, and growth rates, will have significantly different values if one is publicly traded (listed on the NYSE or Nasdaq stock exchange) and the other is privately owned. A publicly owned company will always have a greater value than a private one. Specifically, private companies have historically been valued at 15 to 25% less than similar companies that are publicly traded.10 This difference in valuation is explainable by the following factors:
• According to Securities and Exchange Commission (SEC) rules, all public companies are required to disclose all details regarding the company’s financial condition, past and present. These disclosures allow investors in public companies to base their investment decisions on more information. As private companies do not have to adhere to SEC disclosure rules and regulations, investors in private companies do not have access to this type of information.
• Investors in publicly owned companies have a ready market to buy and sell shares of stock. As you will see in more detail in Chapter 7, “Raising Capital,” anyone can buy and sell the stock of public companies. That is not the case with the stock of private companies. Legally, private companies are supposed to sell stock only to “sophisticated” investors whom they know directly or indirectly. Sophisticated is loosely defined to mean individuals with a certain minimum net worth who understand the risks associated with equity investing. Investors who are known “directly” means those who are associates, family members, or personal friends. Investors who are known “indirectly” are people known through others—for example, through a banker, lawyer, or accountant.
Therefore, publicly owned companies have greater value because they provide greater and more reliable information regularly to investors than do private companies. This fact supports the axiom “information is valuable.” Publicly owned companies also have greater value because of the liquidity opportunities available to investors. They can easily sell their stock in the public markets to other buyers.
Availability of Capital
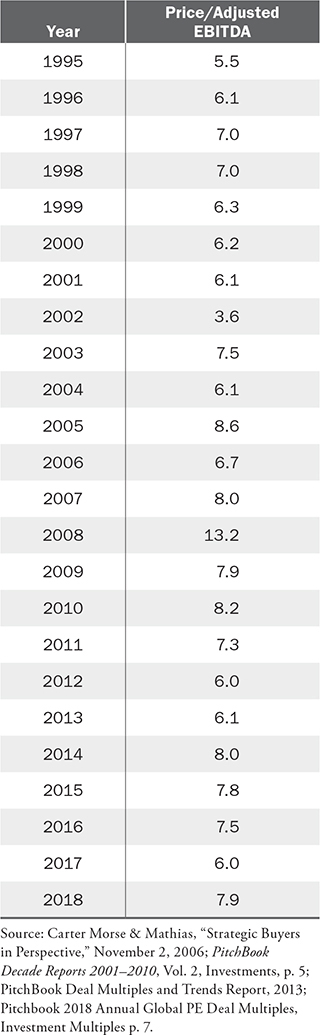
As seen in Table 6-1, purchase price multiples of EBITDA on transactions under $250 million in value reached 10 in 2016, and then retreated to 6 by 2017, somewhat below the mean of 7. The availability of capital was one of the main reasons for this increase. A number of factors converged to make this a golden era for sellers. First and foremost, the amount of credit available to investors reached historic levels. Low interest rates opened the spigot, enabling financial buyers to use leverage to target acquisitions. The private equity firms, flush with new cheap capital, were another factor driving valuations higher. Armed with overflowing coffers and easily accessible credit, buyout firms “produced the strongest 5 year stretch, from 2014 to 2018, in the industry’s history with $2.5 trillion in buyout deal value.”11 Corporate buyers, traditionally the most lucrative exit option for sellers, contributed their share to the multiple increase.
TABLE 6-1 Purchase Price Multiples
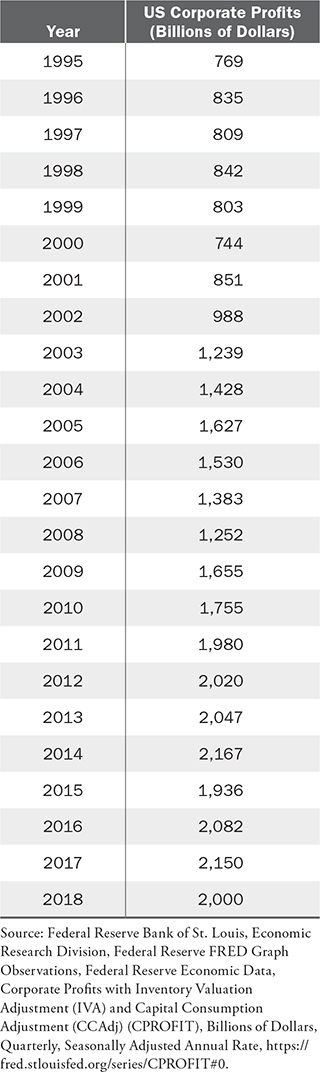
As shown in Table 6-2, corporate profitability was at a historic high in 2017, riding a strong economy and years of cost cutting. This left firms flush with cash and looking for ways to spend it. Additionally, other factors such as the proliferation of hedge funds and second-tier lenders into the market, and the increasing presence of foreign buyers also supported these higher multiples. The basic fundamentals of economics were in play; an abundance of capital was available to do a limited number of deals.
TABLE 6-2 US Corporate Profits
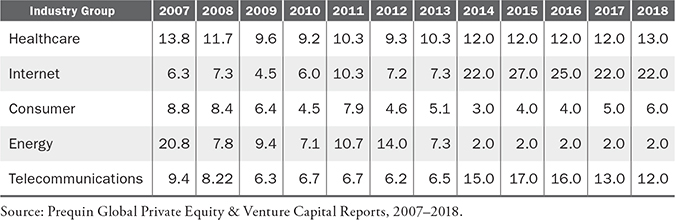
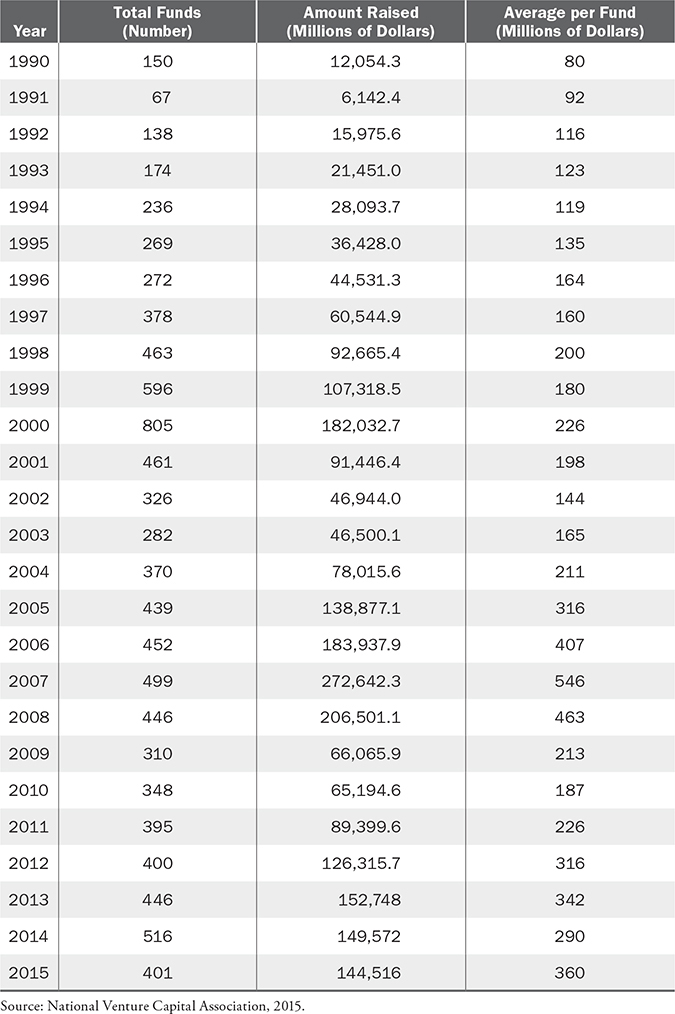
Venture capital fund-raising levels tend to track both the economy and the stock market. Typical of this historical pattern, venture capital funds were awash with investable capital in the years leading up to 2018, thus, venture capital fund-raising became more plentiful during those years. In the period from 2007 to 2013, investments by venture capital funds into entrepreneurial firms (known as “deals”) reflected changes in available capital as indicated in Table 6-3.
TABLE 6-3 Average Deal Size by Industry, All Rounds, $ millions (2007–2018)
Strategic or Financial Buyer
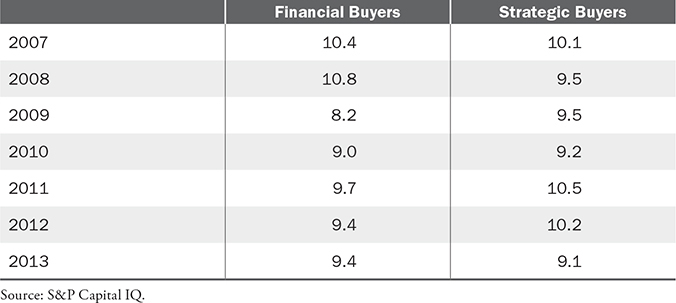
The value of a company is also affected by who the buyer is. Corporations, such as those in the Fortune 500, have historically valued companies at higher prices than financial buyers, entrepreneurs with financial backing from leveraged-buyout funds (leveraged buyouts, or LBOs), and other private equity sources. As stated previously, a significant reduction in the amount of available credit typically reduces the buying power of private equity firms and returns the spread between financial and strategic buyers closer to historical norms. In situations where financial buyers have an abundance of available funds, they often pay higher prices for attractive companies; in these instances, financial buyers will often pay higher prices than strategic buyers. Table 6-4 shows the average EBITDA multiples by sectors, and Table 6-5 shows the multiples by year.
TABLE 6-4 Average EBITDA Multiples 2004–2013 by Sector
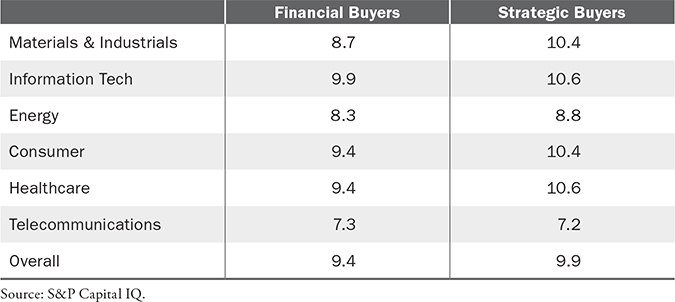
TABLE 6-5 Average EBITDA Multiples by Year, All Sectors
Speculation
There are some companies that gain all of their value based on their projected future performance. This was the case with the vast majority of Internet businesses, e-commerce companies, and social media, which we will examine in more detail later in this chapter, which typically had modest revenues and no history of profits.
In response to the question, “Are Internet stocks overvalued?” one business writer responded, “Let’s put it this way: They sell more on hype and hope than on real numbers.”12 That is the reason why Uber is valued at $75 billion and General Motors at $56 billion despite the latter having 2018 revenues of $147 billion and profits of $8 billion compared to $3 billion of losses for Uber on 2018 revenue of $11 billion.
Stage of Company Development
The earlier the stage of the company’s development, the lower its value. A company that is in the early seed stage will have a lower value than a company that is in the more mature growth stage. The reason is that there is less risk associated with the later-stage company. It has a history. Therefore, entrepreneurs are generally advised to develop their products and companies as much as possible before they seek outside private equity financing. Unfortunately, many entrepreneurs learn this lesson too late. They procure equity financing in the company’s earliest stages, when its valuation is extremely low and the leverage is on the side of the investors.
This problem is further exacerbated by the fact that early-seed-stage entrepreneurs typically need relatively little money to start their company and/or develop prototypes. It is not uncommon for these entrepreneurs to need as little as $25,000 or as much as $200,000. When equity investors come in at this stage, they want to own at least 50% of the company in return for their investment. Their investment of $25,000 to $200,000 for half the company results in a postmoney company valuation of only $50,000 to $400,000. This creates major problems for the entrepreneur later because he is left with little stock to sell to future investors.
Another common problem that arises is the “seller’s remorse” that entrepreneurs feel once they realize that they have given up so much of their company for so few dollars. This was the feeling that Joseph Freedman had with the company he founded, Amicus Legal Staffing, Inc. (ALS). He raised $150,000 by selling 65% of the company, thereby giving the company a value of only $230,769. When Freedman sold ALS to AccuStaff five years later, his investors received $13 million, or 65% of the price, for their initial $150,000 investment.13
Auction
When a company is being sold via an auction process, it theoretically will ultimately be valued based on what the market will bear. This process typically has multiple potential buyers bidding against one another. The result is usually a nice high price for the seller. For example, in 2007, Microsoft outbid Google and Yahoo! for the right to buy a portion of Facebook. Microsoft’s $240 million investment for 1.6% of Facebook gave the company a value of $15 billion! At the time, Facebook’s revenues were less than $50 million. At the end of 2018, Facebook’s value was $89.7 billion, making Microsoft’s investment of $240 million worth approximately $1.4 billion!
State of the Economy
The condition of the country’s and possibly even the world’s economy can dramatically affect the valuation of a company. A strong economy translates into an increased availability of investor capital, which, in turn, as we mentioned earlier in this chapter, translates into leverage for the entrepreneur. Obviously, the converse is true. The value of companies typically declines as the economy worsens because investors have less money to invest. Therefore, the economy affects the availability of capital, which in turn affects the value of companies.
This is not just economic theory, but a fact, evidenced by the periods 1991–2003 and 2003–2010, as the data in Table 6-6 (see next page) show.
TABLE 6-6 Commitments to Private Equity Partnerships
Reason for Selling
The value of a company that is being sold is directly related to the reason behind the sale. A company has its greatest value if the entrepreneur is not selling as a result of personal or business pressures. For example, the value of a company that is being sold because of the threat of insolvency brought on by cash shortages will be much less than the value of the exact same kind of company that does not have financial problems.
The same holds true for personal reasons. The value of a company that is being sold, for example, to settle the estate of divorcing owners will be lower than it would be if that circumstance were not driving the sale. Other personal reasons that may negatively affect the value of a company include, but are not limited to, the illness or death of the owner(s) or members of the owner’s family and internal conflict (business or personally related) among the owners.
Because these personal and business problems can negatively affect the value of a company that is being sold, it is common for owners to disclose as little as possible about the real reasons for the sale. That is why it is essential for any entrepreneur who is buying a company to do thorough due diligence to determine the reason that the company is being sold before valuing the company and making an offer. The major lesson to be learned from this section is that information is valuable. The same lesson was the highlight of an earlier section in this chapter, which discussed the reason why public companies have greater value than private companies.
Tangible and Intangible Assets
The tangible and intangible assets of a company will also affect the company’s value. Most of the value of manufacturing companies typically lies in their tangible assets. The age and condition of these assets—such as machinery, equipment, and inventory—will have a direct impact on the company’s value. For example, if the equipment is old and in poor condition as a result of overuse or lack of maintenance, the company will have a lower value than a similar company with newer and better-maintained equipment.
The same holds true for intangible assets, including a company’s customer list, patents, and name. For example, if a company’s name is damaged, the company will have less value than another company in the same industry with a strong, reputable name. That is the reason why AirTran Airways changed its name from ValuJet Airlines. The latter’s name had been severely damaged as a result of a disastrous plane crash.
Type of Industry
The industry that a company competes in is also very important to its valuation. It is not uncommon for two companies with similar revenues, profits, and growth but in different industries to have significantly different valuations. As we will see later in this chapter, that was most certainly the case a few years ago when Internet and e-commerce companies were compared with companies in almost any other industry. Based on the price/earnings ratio (P/E ratio) valuation method, which we will also discuss in more detail later in this chapter, the industries with the highest and lowest valuations were the ones shown in Figure 6-5.
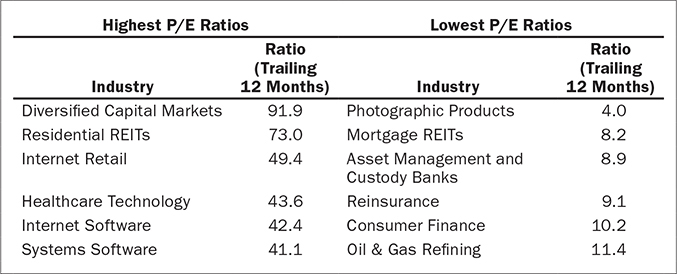
FIGURE 6-5 Highest and Lowest Industry P/E Ratios
Source: S&P Capital IQ, 12 months 1/1/2013–12/31/2013.
The reasons why some industries had greater value than others were the sexiness of the industry and its growth potential. Those companies that were viewed as being sexier, with high and rapid growth potential, typically had higher valuations than those companies that were in staid, conservative, and moderate-growth industries, despite the fact that—as we saw earlier in this chapter when comparing GM and Uber—the conservative industries were immensely more profitable.
Quality of Management Team
The quality of the management team, which is primarily measured by the number of years of experience that each member of the team has and the individual members’ success and failure rates, will affect the value of a company that is being sold or is raising capital from external investors. In the situation where a company is being sold and the existing managers require the new owners to retain them, the value of the company will be negatively affected by the evaluation of the management team. If the new owner views the old management team as being poor, then she will be less willing to pay a high price for the company because she will have to pay to further train or replace the team members. The chance that the management team may need to be replaced adds risk to the future of the company, which in turn decreases the value of the company.
Private equity investors will give greater value to a company that has experienced management. The reason is exactly the same as that just mentioned: risk. The greater the risk, the lower the valuation. For example, two start-up companies looking for the same amount of investor capital will have significantly different valuations if one company’s management is composed of people with start-up experience and the other’s management has none.
Valuation Methods
There are numerous ways to value a company, and seemingly, almost no two people do it the same way. Methods may differ from industry to industry, as we will see later in this chapter, as well as from appraiser to appraiser. It is important to know that there is no single valuation methodology that is superior to all the others; each has its own benefits and limitations. But ultimately, most business appraisers prefer one method and use it rather than the others. Typically, the commitment to one method comes after experimenting with several methods and determining which consistently provides the valuation that the person is most comfortable with.
Candidly, valuation is part gut and part science, and simply saying that you believe in one valuation method is all well and good. However, the rubber hits the road when you actually risk your own capital when using one or more of these methods to value a business. The point is that an entrepreneur’s valuation method is determined by experience; without that valuable experience, it is strongly recommended that the entrepreneur use at least two different valuation methods to determine a company’s range of valuations.
Valuation methods basically fall into three categories: (1) asset-based, (2) cash flow capitalization, and (3) multiples. In the world of entrepreneurship, if there is a most popular and commonly used valuation category, it is multiples, and within this category, the most popular method is the multiple of cash flow.
Multiples
We will begin with multiple of cash flow and go on to review a number of other multiples that are also used in valuation.
Multiple of Cash Flow
The cash flow of a company represents the funds available to meet both its debt obligations and its equity payments. These funds can be used to make interest and/or principal payments on debt, and also to provide dividend payments, make share repurchases, and reinvest in the company. One way of valuing a company is by determining the level of cash available to undertake these activities. This level of cash is determined by calculating earnings before interest, taxes, depreciation, and amortization—EBITDA.
In this valuation methodology, EBITDA is multiplied by a specified figure (called the multiplier) to determine the value of the company. In general, as shown here, a multiplier of between 3 and 10 is used. However, whether it is a buyer’s market or a seller’s market, sales growth, industry growth potential, variability in a company’s earnings, and exit options available to investors are all factors that affect the level of the multiplier used in valuation. The multiple is not static, but evergreen. It can change for a myriad of reasons. As venture capitalist Bill Sutter, a graduate of Yale University and Stanford Business School, stated:
Virtually every conversation about a company’s valuation in the private equity industry starts with a 5 times cash flow multiple discussion. The multiple will go up for qualitative reasons like super management and higher growth and will go down for other types of industries that are recessionary, where risk and volatility is perceived to be higher.14
Another means of reducing or improving valuations based on cash flow multiples is to adjust EBITDA. The adjusted EBITDA should be calculated after the entrepreneur’s salary has been deducted. The reason is that the entrepreneur is entitled to receive a market-rate salary. This salary should be treated as a legitimate expense on the income statement. If the owner’s salary is not recognized, then the company’s EBITDA will be artificially inflated, resulting in an overvaluation of the company. This result would not be in the best interest of a buyer, who would pay more for a company, nor would it be in the best interest of an investor, who would get less equity for his investment. In the case of a buyer, the proper way to determine EBITDA is to replace the seller’s salary with the new salary anticipated by the buyer, as long as it is at a justifiable market-rate level. The calculation is shown in Equation 6-2.
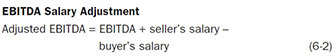
For example, if a company in an industry that commonly uses a multiple of 7 had an EBITDA of $500,000, one would assume a valuation of $3.5 million. But suppose further analysis of the seller’s financial statements shows that he took a salary of only $50,000 when similar-size companies in the same industry paid their owners $125,000. If the buyer intends to pay himself the market rate of $125,000, then the company’s value, using the EBITDA multiple of 7, should be $2,975,000, or ($500,000 + $50,000 – $125,000) × 7. This $525,000 difference is an 18% overvaluation!
Please note that the change in the owner’s salary would also affect the amount of taxes paid by the company. Since the new salary would decrease the operating profit, the taxes would also decrease.
As stated earlier, multiples of EBITDA up to 10 are not uncommon. For example, in 2008, Mars, the candy manufacturer, agreed to buy Wrigley, the gum company, for $23 billion, or 19 times EBITDA, whereas the packaged food industry generally averages a 12 multiple.15 But the acceptance of such multiples is discouraged unless you are the seller of the entire company or a portion of it. For a buyer, it is suggested that you should accept multiples no greater than 5. The reason is that the valuation should be such that under the worst-case scenario, cash flow will be able to completely service the debt obligation in the typical five- to seven-year amortization period.
At a 5 multiple, if the capital structure is 60 to 80% debt, as is common, then it can be serviced within seven years. For example, if the Grant Company’s EBITDA is $1 million, a buyer should pay no more than $5 million. With an 80%, or $4 million, loan at 7%, if the cash flow over the next seven years remained the same and no major capital improvements were needed, the total $7 million could comfortably service the debt obligation.
Multiple of Free Cash Flow
Finally, for companies that require major investments in new equipment in order to sustain growth, it is common to use a multiple of the company’s free cash flow (FCF) instead of just EBITDA. This is a more conservative cash description that yields a lower valuation. For multiple purposes, FCF is calculated as shown in Equation 6-3.

Manufacturing companies are usually valued based on a multiple of FCF. On the other hand, media companies such as television stations are usually valued based on a multiple of EBITDA. For example, in the same year, Westinghouse and Disney purchased CBS and ABC, respectively. Westinghouse paid 10 times EBITDA, and Disney paid 12. In fact, a quick review of the television broadcasting industry (see Table 6-7) will highlight the earlier point regarding the “evergreen” aspect of multiples.
TABLE 6-7 Television Broadcasting Industry Multiples
It should be noted that the EBITDA and FCF multiple methods correctly value a company as if it is completely unleveraged and has no debt in the capital structure. The adding back of interest, taxes, and depreciation to the net earnings eliminates the relevance of whatever debt the company presently carries. This is the proper way to value a company, especially if you are a buyer, because the seller has chosen capital structure has nothing to do with the buyer and the capital structure that she ultimately chooses. The company’s present capital structure could be loaded with debt because the owner wants his balance sheet to look dreadful as he begins asset settlement negotiations as part of his upcoming divorce. Therefore, the company should be valued without regard to its existing debt. Once the buyer determines the value that she wants to pay, she can agree to inherit the debt as part of her payment. For example, if the company’s value is $5 million, the buyer can agree to pay it by assuming the $1 million of long-term debt that the seller owes and paying the $4 million balance in cash.
Multiple of Sales
This multiple is one of the more widely used valuation methods. Sales growth prospects and investor optimism play a major role in determining the level of the multiple to be used, and different industries use different multiples. In the food industry, businesses generally sell for 1 to 2 times revenue, but sales growth prospects can have an impact on raising or lowering the multiplier. For example, Quaker Oats, a strategic buyer, paid $1.7 billion, or 3.5 times revenue, for Snapple at a time when similar companies were being sold for a sales multiple of 2 or less. Quaker’s rationale: it expected rapid growth from Snapple.
However, that rapid growth did not happen. Two years later, Quaker sold Snapple to Triarc Cos. for $300 million, or a little more than 50% of its annual revenues of $550 million. Quaker’s obvious overvaluation of Snapple was instrumental in the CEO’s departure from the company. On the other hand, Triarc’s owners were given the greatest compliment after buying Snapple when someone said, “They stole the company!”16
Other industries that are commonly valued on a multiple of revenues include the radio station industry. Typical valuations are 2.0 to 2.5 times revenues for small-market stations, 3 to 3.5 times for middle-market stations, and 4 times for large-market stations. Another such industry is professional services firms, which are typically valued at 1 to 3 times revenues. But the most prominent industry that uses the multiple of sales model is technology, especially the Internet industry, which will be discussed in more detail later in this chapter.
The shortcoming of this method is that it ignores whether the company is generating cash. The focus is entirely on the top line. Therefore, this valuation method is best suited for those entrepreneurs who are focusing on growing market share by acquiring competitors. The idea is to buy new customers and rely on your own operational skills and experience to make each new customer a cash flow contributor. This method is best carried out by entrepreneurs who are quite experienced in operating a profitable venture in the same industry as that of the company being acquired.
Multiple of Unique Monthly Visitors
This valuation method has surfaced primarily in the Internet space. News Corporation purchased Myspace for $580 million, or $2.93 per unique monthly visitor. The next year, Google purchased YouTube for $1.65 billion, or $4 per unique monthly visitor. That same year, NBC Universal agreed to buy the Weather Channel for $3.5 billion. At the time of this purchase, the Weather Channel’s website had 37 million unique monthly visitors, making it a top 15 website. This purchase price translates into a price of $9.40 per unique monthly visitor.17
P/E Ratio Method
Another common valuation method that falls into the multiples category is the price/earnings ratio. This model is commonly used when valuing publicly owned companies. The P/E ratio is the multiplier used with the company’s after-tax earnings to determine its value. It is calculated by dividing the company’s stock price per share by the earnings per share (EPS) for the trailing 12 months. For example, a company with a stock price of $25 per share, 400,000 shares outstanding, and trailing 12 months’ earnings of $1 million will have a P/E ratio of 10, calculated as shown in Figure 6-6. In the figure, the P/E of 10 means that it costs $10 to buy $1 in profit, or conversely, that an investor’s return is 10%. This return compares very favorably with the 3–4.5% historical average returns on long-term bonds.18
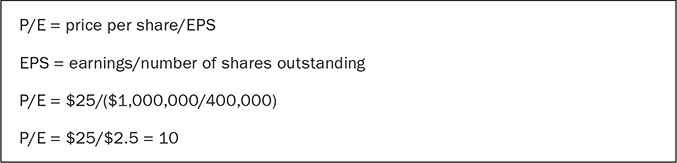
FIGURE 6-6 Price/Earnings Calculation
The average historical P/E multiple for the Dow Jones Industrial Average is 15,19 and for the Standard & Poor’s 500 is 15.20 P/E multiples are published daily on finance websites such as Yahoo! Finance and in the business sections of some newspapers, showing the ratios for publicly traded companies in comparable businesses. Companies in the same industry may have different P/E multiples despite the fact that they have similar annual earnings and a similar number of outstanding shares. The difference may be related to the price of the stock. Investors may be willing to pay a higher stock price for one company because of its higher forecasted growth rate, the presence of more experienced management, the settlement of a recent lawsuit, or the approval of a new patent. In this situation, the company with the higher stock price would have a higher P/E multiple and therefore a higher valuation. Thus, it can be concluded that when a company has a P/E multiple that is higher than the industry average, it is primarily because investors have a positive view of the company’s growth opportunities and expect relatively reliable earnings. Conversely, lower P/E multiples are associated with low growth, erratic earnings, and perceived future financial risk.
Be mindful of the fact that P/E multiples are ideally used to value publicly owned companies. However, P/E multiples are sometimes used to value private companies.
The ideal way to value a private company using a P/E multiple is to find the public company that is the most comparable. The most important criterion to look for is a company with the same, or as close as possible, products or services. The objective is to select a company that is in the same business. The other important criteria are as follows:
• Revenue size
• Profitability
• Growth history and potential
• Company age
After the best comparable company has been determined, the P/E multiple should be discounted. The reason? As stated earlier in this chapter, the value of a publicly owned company will always be higher than that of a private company with exactly the same revenues, profits, cash flow, growth potential, and age, as a result of liquidity and access to information. The result is that private companies are typically valued at 15 to 25% less than public companies. Therefore, the P/E multiple of a public company that is selected as the best comparable should be discounted by 15 to 25%.
Multiple of Gross Margin
As a rule of thumb, the multiple of gross margin should be no higher than 2. Therefore, a company with revenues of $50 million and gross margin of 30% has a value of $30 million ($50 million × 0.30 = $15 million; $15 million × 2 = $30 million).
Different Industries Use Different Multiple Benchmarks
Before we close out the discussion of multiples, it is important to highlight the fact that different industries use not only different multiple numbers, but also different benchmarks. They include the following:
• Distribution companies in the soft drink and alcoholic beverages industry are valued at a multiple of the number of cases sold.
• The pawnshop industry, which provides loans averaging $150 at annual interest rates ranging from 12 to 240%, typically uses one of two valuation methods: the multiple of earnings model or the multiple of loan balances model. There are more than 11,000 pawnshops in the United States,21 and approximately 15% of them are publicly owned22 These public pawnshops are valued at a multiple of 18.5 times earnings, which is significantly higher than the figures for private shops, which are valued at between 4 and 7 times earnings.
While this multiple of earnings valuation model is not unique to pawnshops, the model of a multiple of loan balance is. A pawnshop’s loan balance provides evidence of the number of its customer relationships, which is its greatest asset. Thus, the multiple range commonly used to value a pawnshop is 2 to 4 times its outstanding loan balance.
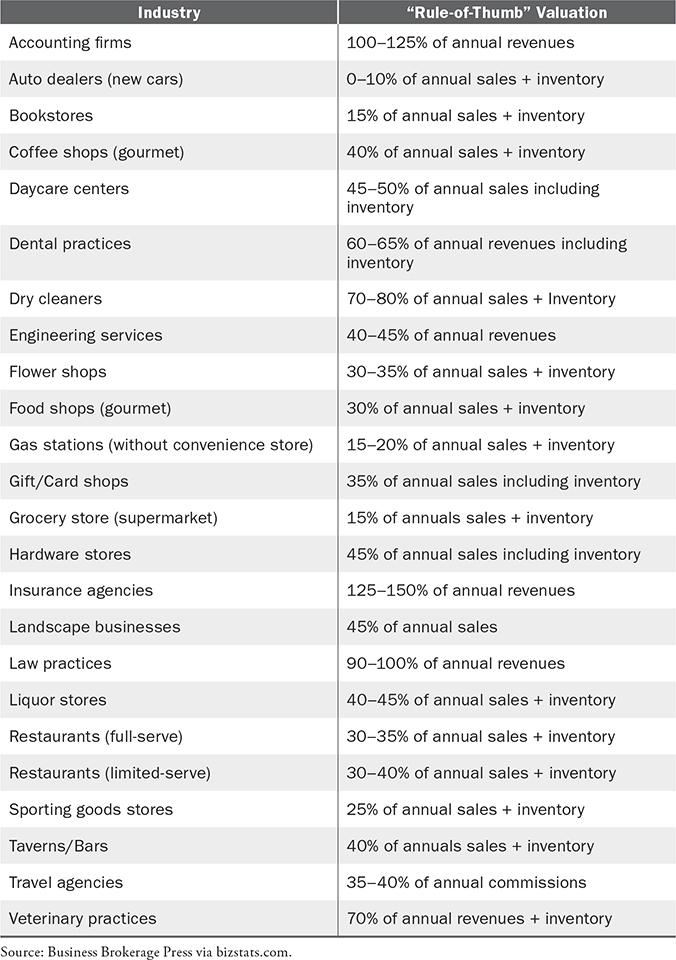
Rules of thumb are often used to make quick estimates of business values. The Business Reference Guide, published by the Business Brokerage Press, is a great resource for anyone who is involved in valuing, buying, or selling a privately held business. Table 6-8 (see next page) is a sample of some businesses and the “rule-of-thumb” multiples outlined in the guide.
As one further point of reference, the Newsletter of Corporate Renewal suggests that the value of any company should be no more than 2 times its gross margin dollars.23 In conclusion, when valuing a company using any one of the aforementioned multiple models (that is, revenues, cash flow, earnings, or gross margins), it should be noted that the multiples are not static. They are constantly changing and should be adjusted up or down, depending on several factors.
TABLE 6-8 Rule-of-Thumb Valuations
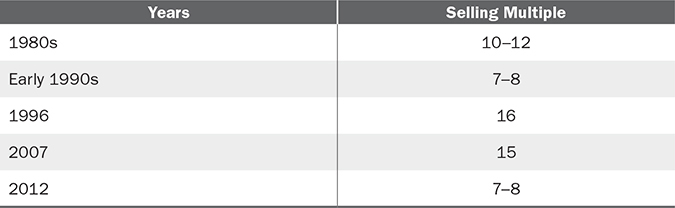
If an industry is experiencing a downturn, thereby making it a buyer’s market, then the multiples will typically decline. The television industry is a perfect example. During the 1980s, television stations were selling for 10 to 12 times EBITDA. By the end of the decade, however, the multiples had gone down to 7 to 8. The reason? The country was in the early stages of a recession. Fewer advertising dollars were going to television stations because there was more competition from the new cable industry. Also, the major networks decreased the amount of payments they were making to their affiliate stations. The combination of these factors created a buyer’s market for network-affiliated television stations. By 1995, the multiples had changed again. The reason for the increase was aptly described in a Chicago Tribune article:
Television stations normally sell for 8 to 10 times cash flow. But the highest multiples occurred in 1995–1996 when stations sold at multiples of 15 to 20. A strong economy and an even more robust advertising market helped make TV stations virtual cash cows, producing profit margins ranging from 30 to 70%. The approach of a presidential election year in 1996 and the Olympic Games in Atlanta should provide further stimulus to the ad market.24
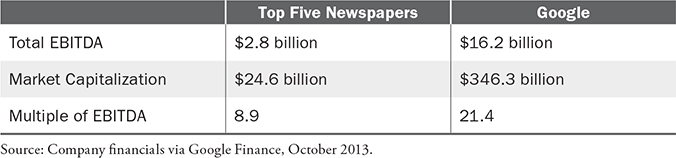
One of the most recent deals in 2019 showed multiples going back to normal multiples, with Nexstar Media Group selling two stations at an average multiple of 10.6 Another interesting example is the newspaper industry. Since 1940, the number of US daily newspapers has steadily declined. In addition, more recently, advertising revenue for newspapers has come under siege from other media, including the Internet. As Warren Buffett said at his annual investors’ meeting in May 2006, newspapers appear to have entered a period of “protracted decline.” To illustrate, Google’s market capitalization in October 2013 was approximately 14 times that of the five largest newspapers, yet Google’s EBITDA of $16.2 billion was just 6 times the $2.8 billion generated by these newspapers. Table 6-9 demonstrates this point.
TABLE 6-9 Valuation Comparison
There are many factors that may justify an increase or decrease in a company’s multiple relative to the industry’s typical multiple. An example of multiples increasing occurred in the funeral home industry. Historically, this industry was characterized primarily by small “mom-and-pop” family owner/operators. These small businesses were selling for 2 to 3 times EBITDA. But in the early 1990s, the value of companies in this fragmented industry of more than 25,000 funeral homes began to change dramatically. Four companies, which are now publicly owned, began a fierce battle, competing with one another to grow their companies rapidly by consolidating the industry. The four companies, Service Corporation International, Stewart Enterprises Inc., Loewen Group Inc., and Carriage Services, Inc., in many instances sought the same funeral homes. This interest on the part of multiple potential buyers resulted funeral homes selling for 8 to 10 times EBITDA.
In 1997, the industry saw the beginning of a decline in these multiples because the growth began to slow. As one business analyst said, this industry is suffering from overvaluation of companies financed by too much debt that cannot be repaid because of an “outbreak of wellness”—fewer people are dying.25 About 2.3 million people die each year in the United States, with a typical average annual increase of 1%. But in 1997, for the first time in a decade, that number decreased. There were 445 fewer deaths in 1997 than in 1996. One interesting reason for this decline was the weather. Most people die during the harsh winter. The previous few winters in the United States had been relatively mild. The industry’s growth was also hurt by the increasing popularity of cremations, which cost half the price of traditional burials.26
In 2018, the funeral home industry multiple is 11.07.27
Asset Valuation
In the past, the value of a company’s assets had great significance in determining the company’s overall valuation. Today, most American companies do not have many tangible assets because each year fewer things are produced in the United States. Most are produced overseas in low-wage-paying countries like China, India, and Taiwan.
The result is that, over time, the value of a company has come to be dependent less on its assets than on its cash flow. Asset value tends to be most meaningful in cases in which financially troubled companies are being sold. In that case, the negotiation for the value of the company typically begins at the depreciated value of its assets.
Capitalization of Cash Flows
Another method of valuation uses capitalization of cash flows.
Free Cash Flow Model
The most complicated and involved valuation model is the free cash flow model, also known as the discounted cash flow or capitalization of cash flow model. It is a model that relies on projections filled with assumptions, because there are so many unknown variables. Therefore, it is the model that is least commonly used to value high-risk start-ups.
Simply stated, free cash flow is the portion of a company’s operating cash flow that is available for distribution to the providers of debt (interest and principal payments) and equity (dividend payments and repurchase of stock) capital. This is the cash that is available after the operating taxes, working capital needs, and capital expenditures have been deducted.
Using this valuation method, one approach is to forecast the FCF as the Japanese do: for 25 years without regard to what happens later, because its discounted value will be insignificant. Another similar and more commonly used approach is to separate the value of the business into two time periods: during and after an explicitly forecasted period. The “during” period is referred to as the planning period. The “after” period is referred to as the residual.
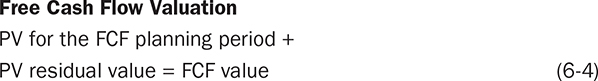
The FCF valuation formula, Equation 6-4, is the sum of the present value (PV) of the free cash flow for the planning period and the present value of the residual value.
To calculate the PV of the FCF for the planning period, the following steps must be followed:
1. Determine the planning period. It is customarily five years.
2. Project the company’s earnings before interest and taxes (EBIT) for five years. The use of EBIT assumes that the company is completely unleveraged—it has no debt in its capital structure.
3. Determine the company’s EBIT tax rate. This will be used to calculate the exact amount of adjusted taxes to be deducted. These are “adjusted” taxes because they ignore the tax benefits of debt financing and interest payments, since this model, as stated previously, assumes a capital structure that does not include debt.
4. Determine the amount of depreciation expense for each of the five years. This expense can be calculated in several ways:
a. Assume no depreciation expense because the capital expenditures for new assets and the corresponding depreciation will cancel each other out. If this assumption is made, then there should also be a zero for capital expenditures for new assets.
b. Using historical comparables, make the future depreciation expense a similar constant percentage of fixed assets, sales, or incremental sales.
c. Using the company’s actual depreciation method, forecast the company’s value of new assets from capital expenditures and compute the actual depreciation expense for each of the forecasted years.
5. Determine the needed increase in operating working capital for each year. The working capital required is the same as the net investment needed to grow the company at the desired rate. The working capital can be calculated as shown in Figure 6-7. The increase in working capital would simply be the change from year to year.
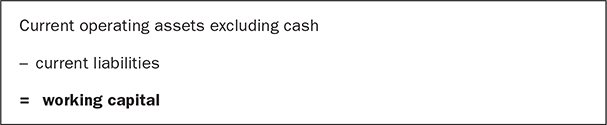
FIGURE 6-7 Working Capital Calculation
6. Determine the investment amounts for capital expenditures. Capital expenditures are made for two purposes. The first is to repair the existing equipment in order to maintain the company’s present growth. The other is for new equipment needed to improve the company’s growth. As was stated in step 4a, the cost of new assets can be zeroed out by the depreciation expense. Therefore, only the capital expenditures needed for maintenance would be highlighted. As stated earlier, that amount can be determined by using historical comparables.
7. Determine the company’s expected growth rate (GR).
8. Determine the discount rate (DR). This rate should reflect the company’s cost of capital from all capital providers. Each provider’s cost of capital should be weighted by its prorated contribution to the company’s total capital. This is called the weighted average cost of capital (WACC). For example, if a company is financed with $2 million of debt at 10% and $3 million of equity at 30%, its WACC, or discount rate, can be determined as follows:
a. Total financing: $5 million
b. Percent of debt financing: 40% ($2 million/$5 million)
c. Percent of equity financing: 60% ($3 million/$5 million)
d. (Debt amount × debt cost) + (equity amount × equity cost)
e. (0.40 × 0.10) + (0.60 × 0.30) = 0.22
A final point: please note that the tax-shield benefit of the debt financing is incorporated in the WACC.
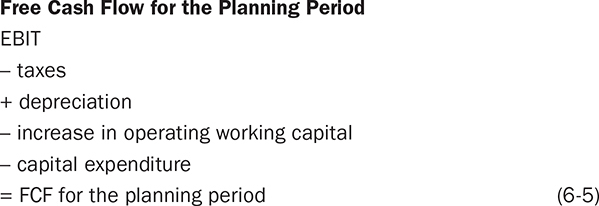
9. Input all the information into the FCF planning period formula, Equation 6-5.
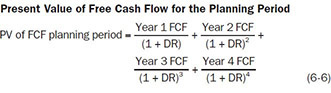
10. Once the FCF for each year has been determined, a present value of the sum of the periods must be calculated. The discount rate is required to complete the calculation, shown in Equation 6-6.
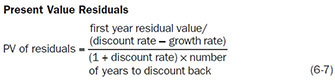
Next, the present value of the residual must be determined. To do so, the first year’s residual value must be calculated by simply forecasting the FCF for Year 6, the first year after the planning period. Then all the information should be put into the PV of residuals formula, Equation 6-7.
The final number from this calculation should then be added to the PV of the FCF number to determine the company’s value.
Let’s determine the value of Bruce.com using the FCF model. The company is forecasting a conservative 10% growth rate. Its WACC is 13%, and its tax rate is 52%. The forecasted annual FCF is presented in Figure 6-8.
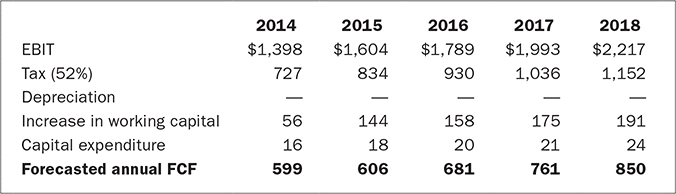
FIGURE 6-8 Forecasted Annual Free Cash Flow Calculation, in Thousands of Dollars
The PV of the FCF planning period is determined as shown in Figure 6-9. With an estimated Year 6 FCF valuation of $960,300, the PV residual can be calculated using the equation in Figure 6-10. Now we can determine the value of Bruce.com. As you can see in Figure 6-11, Bruce.com’s value is $19,798,746.
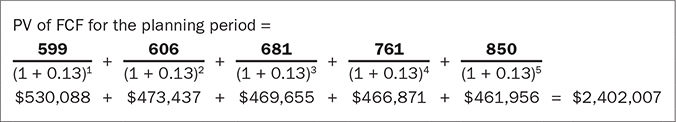
FIGURE 6-9 Present Value of Free Cash Flow for the Planning Period Calculation
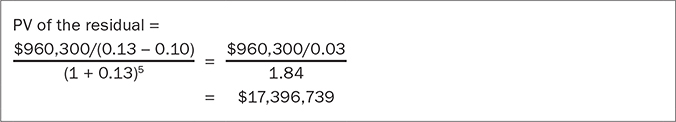
FIGURE 6-10 Present Value of the Residual Calculation
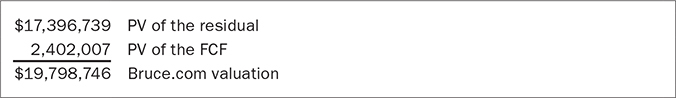
FIGURE 6-11 Valuation Calculation
It should be noted that 88% of the company’s value comes from the residual value. Also, this FCF valuation formula is very sensitive to slight changes in the growth and discount rates. For example, if the discount rate were 0.17 instead of 0.13, an 18% difference, the value of Bruce.com would decrease by 57%, to $8,430,776. The PV of the residual would be $6,264,187, and the PV of the FCF would be $2,166,589.
The criticisms of this model are that it is too theoretical and complex and that it is filled with uncertainties. The three major uncertainties are the FCF projections, the discount rate, and the growth rate. Nobody truly knows any of these. It is all educated speculation. As Bill Sutter, the venture capitalist at Mesirow Partners and a Stanford Business School graduate with a major in finance who was mentioned earlier in this chapter, noted in a lecture to graduate business school students:
Valuation is remarkably unscientific. You can take out your FCF models, Alcar models, talk about your capital asset pricing model and betas until you are blue in the face. I have not used any of those since I got out of business school. Frankly, that is not the way we operate. You can use it for your finance class but you are not going to use it out in the real world.
Valuing Technology-Related Companies
It is amazing how history repeats itself. The crash of the valuations of technology-related companies almost two decades ago, referred to as the “dot bomb” period, was preceded by eerily similar facts about valuations in 2018. Specifically, the enormous valuations that IPOs were producing for so many unprofitable companies in 2018 was almost the same as the year 2000. In 2018, 81% of all companies that went public were unprofitable the year prior to their IPO. In the year 2000, 84% of those IPO’s were for unprofitable companies.
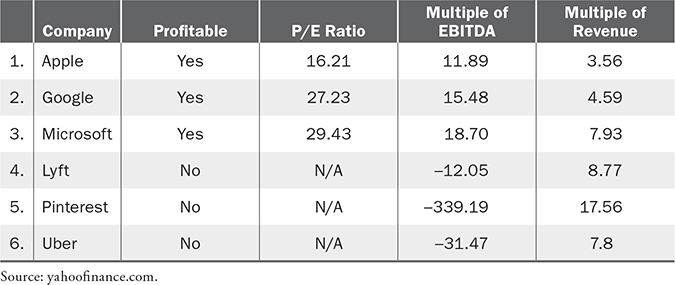
Because those companies were not profitable they had to be valued using only one model, the multiple of revenue. This was the common practice during the dot-com era of the 1990s. As Table 6-10 shows, profitable technology-related companies can be valued using several models. That is not the case for unprofitable companies. They have no P/E ratios and their multiples are the same: negative.
TABLE 6-10 Technology Company Valuation
To highlight the history of the valuations of technology-related companies, I have included the section from the previous edition. The defense of these enormous valuations for unprofitable companies is that they are “unicorns,” unique companies with hundreds of millions—and for some, billions—of dollars of revenue. The argument goes that these large amounts of revenue almost gives these companies monopolistic powers in their industry. Thus, as a monopoly, their “pathway to profitability” is simple and inevitable, and therefore they should be valued based not on today’s performance, but the future optimistic scenario. I am not a proponent of that theory. Yahoo! was once valued at $125 million. In 2016, it sold for 4% of that value.
The valuation methods discussed in this chapter were not applicable when valuing start-up Internet and related technology companies during the 1990s. The P/E ratio method could not be used because the companies had no “E.” Until 2000, Internet companies that had negligible or no present cash flow streams, and in most instances did not expect to get positive cash flow streams for years to come, were valued at extremely high prices at the time they went public. Examples of this include Netscape, Yahoo!, and Amazon.com, to name just a few of the better-known brand names.
When Netscape, the Internet browser company, went public in 1996, the value of its stock went from $28 to $171 per share over a three-month period, despite the fact that the company had never made a profit. AOL eventually acquired Netscape.
In 1995, two Stanford PhD students founded Yahoo!, the Internet search engine company. In 1996, with annual revenues of $1.4 million and profits of only $81,000, the company went public at a valuation of $850 million. In 1999, Yahoo!’s $19 billion market value was equivalent to that of television broadcaster CBS, which had 37 times Yahoo!’s revenues. At year-end 2012, Yahoo!’s revenue of just under $5 billion generated a market value of $23.9 billion. In 2016, Yahoo! was sold to Verizon for $5 billion.
Finally, another famous e-commerce company, Amazon.com, which went public in May 1997 at a value of $500 million despite the absence of any historical, present, or near-term projected profits, once had a value greater than profitable Fortune 500 companies such as Sears, which declared bankruptcy in 2018, and Amazon’s current value is over $800 billion. Another example: the Internet firm Epigraph had expected revenues of $250,000 in 1999 and $1.4 million in 2000. When asked when his company might become profitable, the founder responded, “Oh, come on. We’re an Internet company!”28
In the late 1990s, the prices of Internet and technology companies soared enormously: Dell Computer rose 249% in 1998, Amazon.com went up 966% during the same year, and Yahoo! went up 584%, while eBay rose 1240% from its initial offering price. These valuations raised the question of whether conventional valuation methods were applicable in estimating the worth of Internet stocks. As one stockbroker noted, “I don’t know how you value these things. It is a new set of rules. The Internet stocks are bizarre and outrageous.”29 And as we all discovered, many of those high-flying Internet stocks could be hazardous to one’s health.
A prominent investor, Warren Buffett, the CEO of Berkshire Hathaway, who had forgone significant investment in technology-related stocks until 2011, was also baffled by these stocks’ valuations. At a 1999 news conference, he cheerfully closed a discussion of how he thought business schools should teach the principles of valuing companies by saying, “I would say for a final exam, here’s the stock of any Internet company; what is it worth? And anybody who gave an answer flunks.”
Warren Buffett and others who believed that Internet stocks were being valued more on hope and on hype than on real numbers were justifiably concerned that most Internet companies had high debt levels, few assets, and, most important, a limited, if any, history of profits. Despite this, investors were more than willing to pay premium prices for these stocks, with the expectation that the companies would eventually produce significant earnings.
Therefore, given all this controversy, what was (were) the best method(s) to use for valuing technology and Internet companies? Quite frankly, all of them had major drawbacks. The least practical method seemed to be a multiple of earnings or cash flow. As stated earlier, most of these companies had not only negative earnings but also negative cash flow. For example, in 1998, Forbes magazine identified what it called “the Internet landscape,” which included 46 companies that covered the breadth of the Internet market, from semiconductor chips to sports commentary. Only 14 (or 35%) of the companies had had at least a breakeven net income for the previous 12 months. Despite this fact, the value of the lowest company was $182 million.30
Using the comparable valuation method also created problems. The process of borrowing a valuation from a similar company that had been priced by an acquisition or some other event did not work very convincingly either, said columnist Jim Jubak, especially given the fact that all Internet companies might be overpriced.31 For example, two Internet service providers, MindSpring Enterprises Inc. and EarthLink Network Inc., were sold in 1998. Their selling prices translated into a value of $1,500 per subscriber. In mid-1998, America Online (AOL), the largest and most prominent Internet service provider—at one time operated by Time Warner—had 14 million subscribers. If AOL were valued based on comparable subscriber rates, the company’s value at the time would have been $21 billion, not the actual $14 billion. Thus, using the comparable method would have foolishly suggested that AOL was 33% undervalued.
Even the most popular and seemingly acceptable valuation method for the Internet industry, the multiple of revenues, had many justifiable criticisms. The rule of thumb was to use a multiple of between 5 and 7 times a company’s projected, not current, revenues to determine valuation. The multiple would go up or down depending on the company’s revenue growth rates and gross margins.
Criticisms of this model included the fact that a 5 to 7 multiple for companies that had low or no profits seemed excessively high when a company like Sears was valued at a revenue multiple of 1 and a profitable media company such as Gannett was valued at a multiple of 5. The other problem was that the value was based on projected, not present, revenues. If Amazon.com as of the third quarter of 1999 had been valued based on present revenues, the multiplier would have been an astonishing 20 times. Even more astounding is that, because of the use of projected revenues, a company like Yahoo! had a $19 billion market value, similar to that of CBS television, despite the fact CBS had revenues 37 times those of Yahoo!.
Another example of the craziness of the revenue valuation model that was previously used to value Internet companies was a company called Rhythms NetConnections, a high-speed Internet access firm. Rhythms NetConnections, with revenues of $5.8 million, was valued at $3.1 billion, or 539 times revenues. In defense of this multiple, the founder said that it was justified because Rhythms NetConnections was growing exponentially, doubling its size every quarter.32 On August 1, 2001, Rhythms NetConnections and all of its wholly owned US subsidiaries voluntarily filed for reorganization under Chapter 11.
To get a sense of perspective, let us look at the Standard & Poor’s MidCap 400. If the market capitalization of the companies on this list were valued based on multiple of revenues, their historical median from 1995 to 2013 was 1.1 times.33 This multiple’s top value of 1.36 has been reached three times: (1) April 1998, (2) March 2000, and (3) January 2006; its low of 0.50 was touched in March 2009. In 2013, the mean value was 1.17.
The final criticism of the revenue method was based on the discovery that many Internet companies were reporting “virtual revenue.” The revenue was not real. For example, the companies recognized as revenues the value of the ad space that they exchanged with each other for space on their sites. While the recognition of revenue in such a situation had to be offset by an expense on the income statement, the expense became irrelevant because the valuation was based only on revenues. Since the expense was irrelevant, this practice encouraged companies to inflate the price of their bartered ad space. Another problem with this practice was the fact that there was no guarantee that if the ad space had not been bartered, it would have been sold. Thus, bartering was very important to a company’s reported revenue. Internet.com did not include bartered ads in its revenues. Its CEO, Alan Meckler, says that this hurt the value of his company’s stock, because competitors that included barter appeared to be doing better.34 In 1999, the IRS mandated that revenue technologies from bartering should only be done if a “fair market value” can be verified by an earlier cash transaction that established the value. Figure 6-12 lists several public companies that, according to their company reports, included bartered ads in their revenue in 1998.
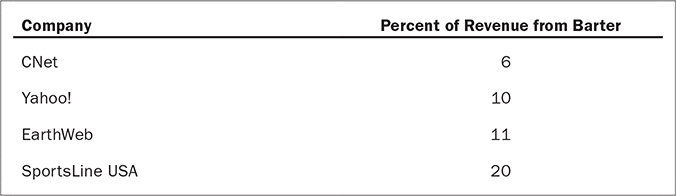
FIGURE 6-12 Bartered Advertisements
Not surprisingly, private companies that were planning to go public realized the value of recognizing barter. Deja.com, an online chat site that went public in 1999, reported 1998 revenues of $5 million. More than 25% of that reported revenue came from barter. After six years of no profits, Deja.com went out of business in 2001 and sold its assets to the search engine Google.
Given the fact that most Internet and e-commerce companies did not have earnings or positive cash flows, the commonly used and accepted valuation model was a multiple of revenues. Therefore, the companies were in constant aggressive pursuit of increased revenues to bolster their valuations. As stated earlier, this practice of rewarding revenues without regard for profit seemingly encouraged more companies to recognize “virtual revenue.” The standard accounting rules, which have now been revised, vaguely stated that retailers that do not assume the risk of holding inventory are “business agents” and should book as revenue only the difference between what the retail customer pays and the wholesale price. Therefore, if a retailer charges a customer $200 for a bike that will be shipped to the customer directly from the manufacturer (drop-shipped), and the manufacturer charges the retailer $100, the amount of revenue recognized by the retailer should be the $100 difference, not $200.
The vagueness of the accounting rules resulted in Internet companies recognizing revenues differently. This inconsistency made some companies seem significantly larger than others. For example, Preview Travel’s CFO, Bruce Carmedelle, said that rival Priceline.com appeared to be 10 times larger even though it “sells only a few more tickets than we do.” At that time, Priceline.com counted as revenue what customers paid for airline tickets, whereas Preview counted only the commissions it got from carriers.
This virtual revenue phenomenon also occurred when a company generated sales both by shipping inventory from its warehouse and by having the products shipped directly from its supplier’s warehouse to the end customer. Ideally, the revenue amounts should have been recognized differently. In the former case, the amount of revenue that should have been recognized was the total price that the customer paid. In the latter case, where the product was being drop-shipped, the revenue recognized should have been only the difference between the retail and wholesale prices. Xoom.com, now part of Comcast, was one of the companies that adhered to this practice. But many other companies, such as Theglobe.com, booked revenue the same way in all cases, although some items came from company warehouses and others from suppliers.35
Theglobe.com would soon see its world come crashing down. While its opening-day high was $97 in 1998, the stock was delisted and trading for just 7 cents a share in late 2001. The technology industry, which came under justifiable criticism for overvaluation of companies without profits, began using the multiple of gross margin method. This method became more popular after it was realized that the multiple of revenues method had encouraged these companies to generate revenue without regard to gross, operating, or net profits. The result of the revenue method was the creation of companies, such as Buy.com, that sold products at prices below cost. This was sheer madness.
Beginning in April 2000, the valuation of technology companies began declining rapidly. For example, IWon purchased the web portal Excite.com in 2001 for $10 million. In 1997, Excite.com had been worth $6.1 billion. As a comparison to their lofty status in 2000, Table 6-11 lists the current P/E ratio (where it exists) for the five firms with the highest P/E ratios in the 2000 USA Today Internet 100 (now the Internet 50). As you can see, only two of the firms are still publicly traded today—at P/E ratios significantly lower than they were traded at in 2000; one firm, Exodus Communications, went bankrupt; and two firms were acquired at fractions of their market values just eight years earlier.
TABLE 6-11 Current Status of Firms with Highest P/E Multiples in the 2000 USA Today Internet 100
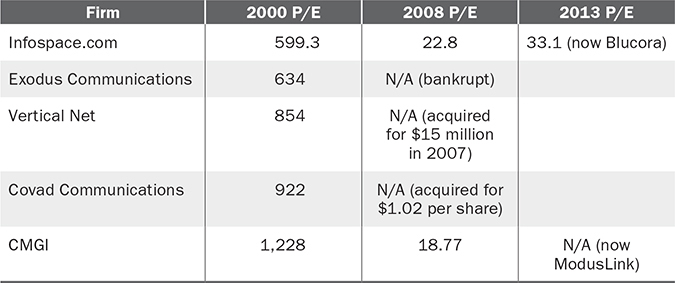
Another thing that positively affected the value of publicly traded Internet companies was the fact that they had “thin floats.” This means that most of the company’s stock was controlled by insiders, such as the management team and other employees. Therefore, public investors held very little stock. The result was that it did not take a lot of buying by the public to increase the share price. Examples of companies that had thin floats are listed in Table 6-12. In contrast, companies with typical levels of stock held by the public include those listed in Table 6-13.
TABLE 6-12 Companies with Thin Floats, >200m Shares Outstanding, 2014
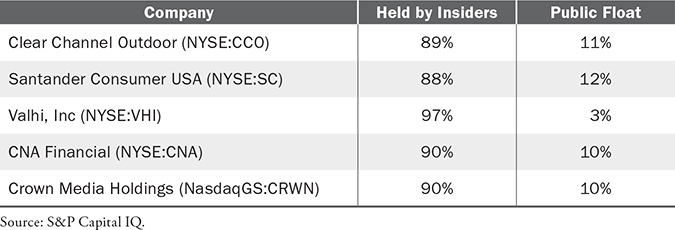
TABLE 6-13 Companies with High % of Publicly Held Stock, >200m Shares Outstanding, 2014
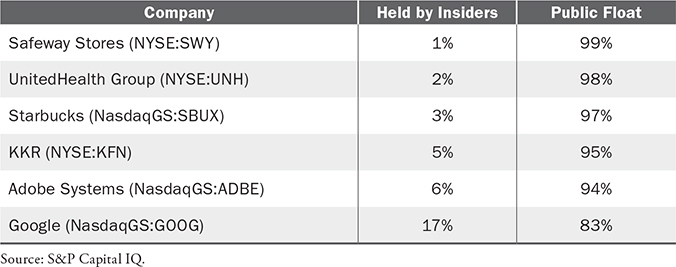
While we correctly criticized the looniness of valuations during the Internet craze, it is important that the lesson learned be greater than a few jokes. The primary lesson learned is that whether one operates in a new economy, an old economy, or a future economy, financial fundamentals related to profitability and valuation will always be important because they have passed the test of time.