
Controlling processes is a common task for any network or server administrator. In this chapter, we will examine a variety of Linux commands that facilitate the control of processes. Subsequent chapters will use both shell commands and GUI interface methods; however, the bulk of this chapter will focus on the shell commands. The reason is that it is far more common to do these tasks via the shell command, and, in fact, many cannot be done via the GUI.
Before we begin examining specific commands, we should define what we mean by the term process. This word has a variety of meanings in different contexts. When discussing operating systems, the term process usually means an executable that is running in its own memory space. For example, if you start up your Web browser and you start up an email program, both are running in separate memory spaces. A process could refer to an application or a daemon. The commands we examine in this chapter enable you to gather information about the processes running on your computer and allow you to exercise some control over those processes.
In this section, we will be covering some specific shell commands that are used to control processes. These commands will allow you to view running processes, search processes, end processes, and change the priority of processes.
The first command we will examine is the ps command. This is probably the most basic process related command. It will provide you with a list of the current processes running on your system. With no options, ps will list processes that belong to the current user and have a controlling terminal. The ps command displays four items: Process ID (pid), Terminal (tty), Time (Total time used by the process), and the command (CMD). Output is unsorted by default. However, as with so many shell commands, this one has a number of options we can pass to it, in order to alter its behavior. Here are the more commonly used options:[1]
-A:This option displays all processes; this is identical to the-eoption explained below.-N:This option displays all processes, except those that fulfill the specified conditions.-a:This option displays all with atty, except session leaders and any process not associated with a specific terminal.-d:This option displays all processes but will omit session leaders.-e:This displays all processes on this system, regardless of user or terminal.T:This option displays all processes on this terminal.x:This displays processes without controllingttys.-H:This displays the processes in hierarchical format.-w:This displays the data in wide format.
You can see the ps option and the -e and -H options in Figure 4.1.
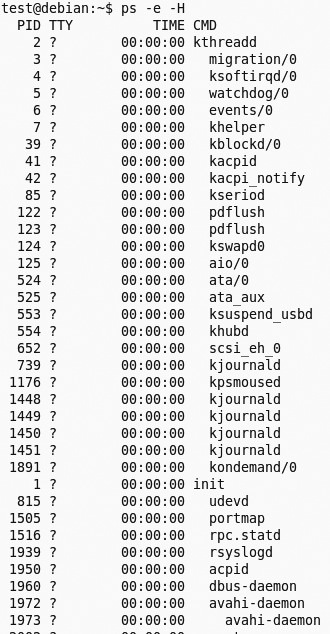
Notice that the -H option causes some of the processes to be shifted over to the right in the display, showing that they are part of a hierarchy. For example, you can see several processes under the init process. The ps command is a very useful administrative tool because it allows you to see everything running on a system or just for a specific user or terminal.
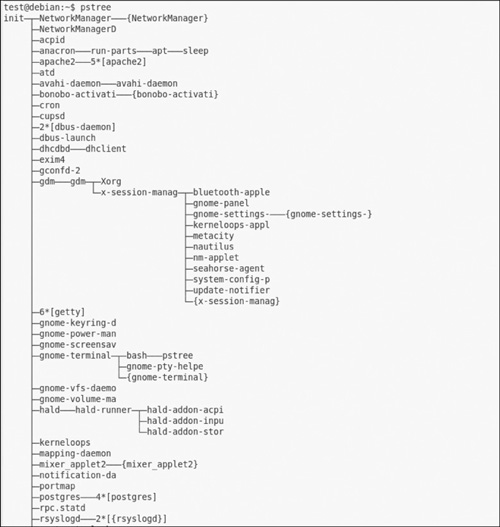
This command is very similar to the ps command, except it shows all the processes in the form of a tree structure (similar to how tree does it for directories). I personally find this view of running processes, shown in Figure 4.2, to be very useful, and I prefer it to the ps view.
As with most commands, this one has several options you may need to use, including the following:[2]
-a:This option shows any command line arguments.-A:This alters the display by using ASCII characters to draw the tree.-c:With this option, you can disable compaction of identical subtrees. By default, subtrees are compacted whenever possible.-G:The display uses VT100 line drawing characters.-h:This option displays the current process and its ancestors. If this terminal does not support highlighting, then it will simply display a normalpstree.-H:It works just like-h, except it highlights the specified process instead. Unlike-h,pstreefails when using-Hif highlighting is not available.-l:This causes the display to use long lines. By default, lines are truncated to the display width or 132 if output is sent to a non-ttyor if the display width is unknown.-n:This sorts processes with the same ancestor bypidinstead of by name (numeric sort).-p:This option causes the display to showpids.pidsare shown as decimal numbers in parentheses after each process name.-u:This option showsuidtransitions. Whenever theuidof a process differs from theuidof its parent, the newuidis shown in parentheses after the process name.-U:This option causes the display to use UTF-8 (Unicode) line drawing characters.-V:This option displays version information.
These options can be used to get additional information about the processes in the pstree.
The pgrep command will return the ID of a running process if you provide it with the name. This command is useful for finding the process id of a particular process when you know the name, or just part of the name of the process. This command can look for partial matches. The pgrep command looks through the currently running processes and lists the process IDs that match the selection criteria.
This particular command has many different options you can use. They are shown in this list:[3]
-f:The search pattern is normally only matched against the process name. When-fis set, the full command line is used.-g:This option only matches processes in the process group IDs listed.-G:This only matches processes whose real group ID is listed.-l:This option lists the process name as well as the process ID.-n:This option is good if you have multiple matches to yourpgrepsearch. It displays only the newest of the matching processes.-o:This option is good if you have multiple matches to yourpgrepsearch. It displays only the oldest of the matching processes.-P:This only matches processes whose parent process ID is listed.-s:This only matches processes whose process session ID is listed.-t:This option only matches processes whose controlling terminal is listed. When using this option, remember the terminal name should be specified without the “/dev/” prefix.-u:This option only matches processes whose effective user ID is listed.-U:This option only matches processes whose real user ID is listed.-v:This option negates the matching.-x:This option only matches processes whose name exactly matches the search pattern. Normally,pgrepreturns matches that are similar to the search pattern.-signal:This option defines the signal to send to each matched process.
In Figure 4.3, you can see pgrep first used with an entire process name (in this case, bash). Then you can see it used with just the first few letters. And, finally, it is used with the first few letters and with the -l option so that both the name and the process ID are listed.
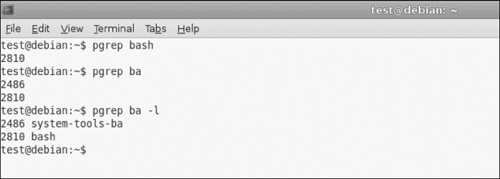
The pgrep command will be very useful to you, particularly if you find that you cannot remember the exact name of a process you want to look up.
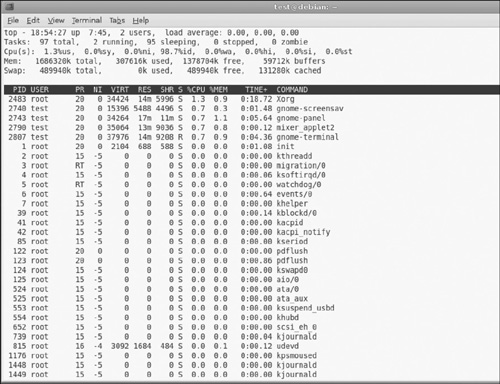
The top command is very much like the ps command, except it lists the processes in the order of how much CPU time the process is utilizing. This can be very useful for an administrator, particularly if you are finding that your CPU utilization is high and you want to identify the culprit. I personally also find the display to be far more informational than the ps display. I use the top command far more often than I do the ps command. You can see the top command in Figure 4.4.
You should keep in mind that since this command lists processes by their CPU utilization, it is entirely possible to get different results if you run the command at different times. This command has a number of options that can alter the way it displays. In fact, it updates itself, so if you watch it you will probably see the items change.[4]
-b:Batch mode operation: Startstopin Batch mode. People often use this to send output to some other program or to a flat file.-c:Command line/Program name toggle: Startstopwith the last rememberedcstate reversed.-d:Delay time interval as:-d ss.tt(seconds.tenths): Specifies the delay between screen updates.-h:Help: Shows library version and the usage prompt, then quits.-H:Threads toggle startstopwith the last rememberedHstate reversed. When this toggle is on, all individual threads will be displayed. Otherwise,topdisplays a summation of all threads in a process.-i:Idle Processes toggle startstopwith the last rememberedistate reversed. When this toggle is Off, tasks that are idled will not be displayed.-n:Number of iterations limit as:-nnumber: Specifies the maximum number of iterationstopshould produce before terminating.-u:Monitor by user as:-u:Username monitor only processes with an effective UID, or username matching the one given.-U:Monitor by user as:-UL:Monitors only processes with a UID or user name matching the one given.-p:Monitor only processes with specified process IDs. This option can be given up to 20 times, or you can provide a comma delimited list with up to 20pids. Co-mingling both approaches is permitted. This is a command-line option only. And should you want to return to normal operation, it is not necessary to quit and restarttop—instead, just issue the = interactive command.-s:Secure mode operation: Startstopwith secure mode forced, even for root.-S:Cumulative Time mode toggle: Startstopwith the last rememberedSstate reversed. When Cumulative mode is On, each process is listed with the CPU time that it and any child processes have used.-v:Version: Shows library version and the usage prompt, and then quits.
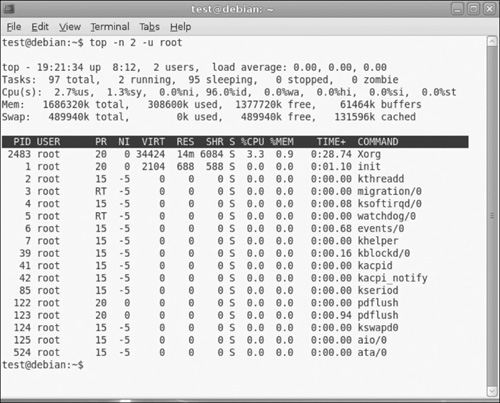
You can see top with the -n 2 and -u root options shown in Figure 4.5.
This command is very simple. It will kill a running process by ID. It simply causes an application or a daemon to unload from memory. This command depends on the process ID, so you need to find the ID for the process. You can do this using a command like ps, as shown in Figure 4.6.
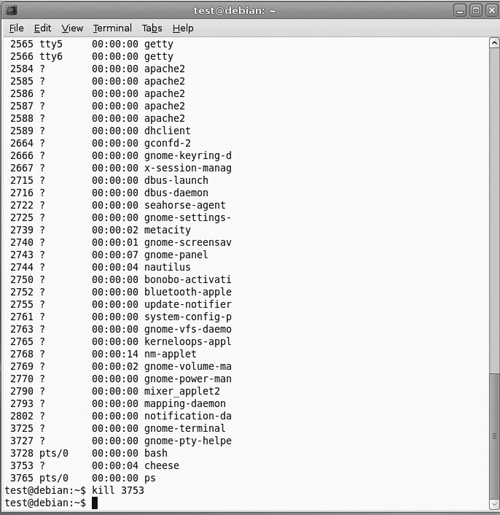
In this example, I used ps to find the ID of a process named cheese (cheese is a graphics program in GNOME), and then used the kill command to kill that process.
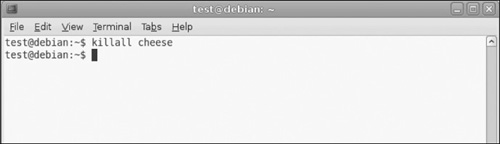
Contrary to what you might think, this is not used to kill all running processes. To do so would shut down Linux! This will kill a process by name rather than by ID.
So, as you see in Figure 4.7, I use the killall command to kill the cheese application using its name, rather than the ID.
pkill is used to kill processes according to some additional criteria (see Figure 4.8). Use the -u option to kill using a username and process name. You may want to kill the processes connected with a specific user, which is particularly useful in several situations. First, use it if you have a user that has launched several processes that are using up too many system resources. Second, use it if you suspect an intruder is on your server using a particular user account. If that is the case, you can kill those processes.
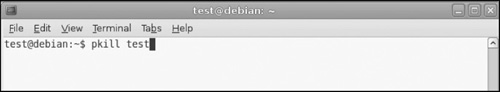
Note that in this case, the username is test.
This command will display the currently running jobs you have executing. These are not the same as processes, although a job could involve a process. A job is some scheduled task. It is very likely that this task involves executing some process, but that does not mean the job and the process are the same thing. We will discuss how to schedule jobs later in this book. Obviously, if you have no scheduled jobs, this command will show nothing.
Note that the jobs command, the bg command, and the fg command are all related to jobs. We will discuss these again and in more depth later in this book.
This command sends a job to the foreground, so you can interact with it. The process will use your current terminal. If you omit the process you want to use with the fg command, it will simply bring the last process that was in the background to the foreground.
This command is very useful because it sets the priority of a given process. With priorities, the lower the number, the higher the priority will be. The minimum priority is 20 and the maximum priority is -20 and only a root user can assign negative priorities. However, any users can always lower the priorities of their own processes (see Figure 4.9).
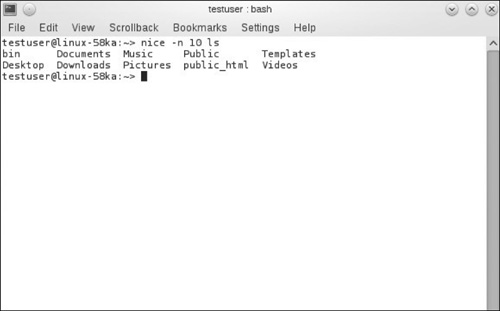
Here we incremented the priority of the ls command by 10 and then ran that command.
The renice command will change the priority of an existing command (see Figure 4.10). You can use the option -u to change the priorities of all processes for a particular user name or the option -g to change priorities for all processes of a particular group. The default is to change via the process ID number.
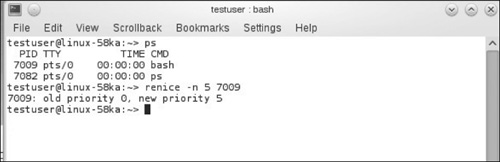
Here we used ps to find the process IDs for running processes and then changed the priority level for the bash shell. There are only a few options for this command:[5]
-g:This will force thewhoparameters to be interpreted as process group IDs.-u:This option will force thewhoparameters to be interpreted as user names.-p:This option will reset thewhointerpretation to be (the default) process IDs.
This process is somewhat similar to skill, except rather than kill the process, it simply changes its priority. This command is shown in Figure 4.11. This command has a few options you can use:[6]
-i:interactive use: With this option, you will be prompted to approve each action.-v:verbose output: This will display information about selected processes.-n:no action: This only displays the process ID.
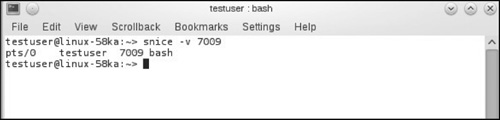
In Figure 4.11, you can see we are using the -v option.
Process management is something most administrators do from the shell commands; however, many of these tasks can be accomplished from the GUI as well. In this section, we will show you how this is done from both GNOME and KDE.
For the purposes of this section, we are using GNOME 2.32 running on Fedora Linux. Using GNOME, if you select Applications → System Tools → System Monitor, as shown in Figure 4.12, you can accomplish many of these same tasks.
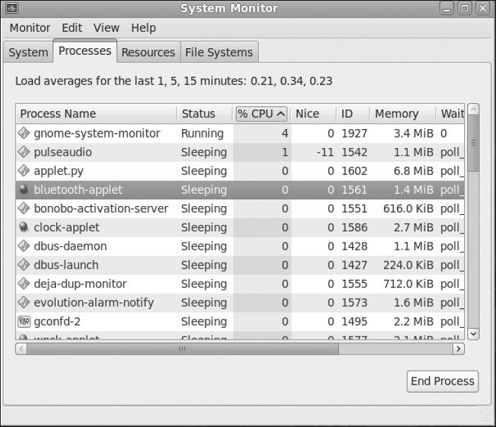
If you select the Processes tab, shown in Figure 4.13, you can view all processes and sort them by CPU usage if you want. This mimics the ps and top commands you might execute from the shell. Also, notice the End Process button; this will accomplish the same goal as the kill command. Unfortunately, there is no analog for the pstree command.
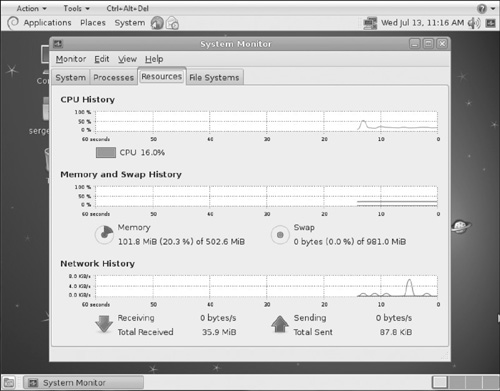
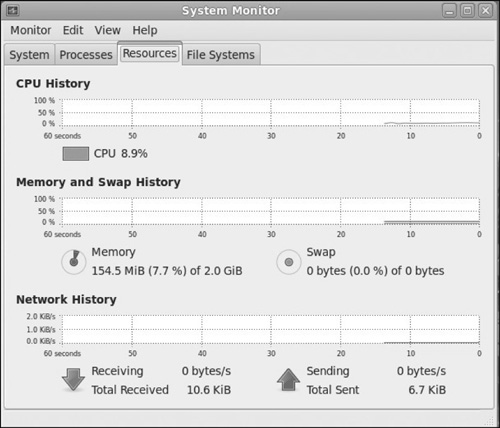
One item that is very useful is the Resources tab shown in Figure 4.14. This gives you a clear view of what is happening on your system, CPU utilization, memory usage, and related data.
For this example, I used KDE running on openSUSE. To locate system monitoring, you select Applications → System → Monitor → System Monitor (see Figure 4.15).
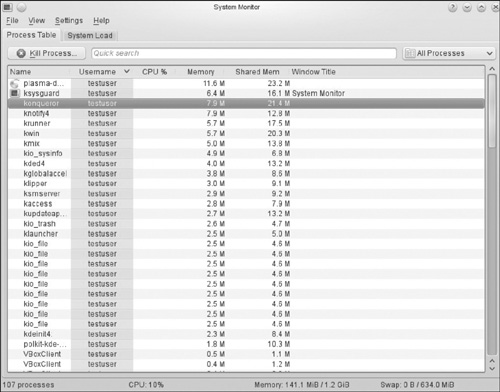
This screen should look very similar to the one you saw in GNOME. Just like GNOME, you can sort processes by CPU utilization (and other factors), and you can use the Kill Process button to kill a process (the button is labeled “Kill Process” instead of “End Process” in KDE). However, you do not have the pstree option here, either.
This chapter gave you a general introduction to managing processes in Linux. This is a task that is probably best done from shell commands. You have much more flexibility from the shell than you do from the GUI; however, you also learned how to monitor processes from both GNOME and KDE.
| 1. | Lankester, Branko, ps(1) - Linux man page, die.net, accessed 23 August 2011, http://linux.die.net/man/1/ps |
| 2. | Almesberger, Werner, pstree(1) - Linux man page, die.net, accessed 23 August 2011, http://linux.die.net/man/l/pstree |
| 3. | Homme, K. T., pgrep(1) - Linux man page, die.net, accessed 23 August 2011, http://linux.die.net/man/1/pgrep |
| 4. | Warner and Cahalan, top(1) - Linux man page, die.net, accessed 23 August 2011, http://linux.die.net/man/1/top |
| 5. | renice(8) - Linux man page, die.net, accessed 23 August 2011, http://linux.die.net/man/8/renice |
| 6. | Linux/UNIX Command: snice, linux.about.com, accessed 23 August 2011, http://linux.about.com/library/cmd/blcmdll_snice.htm |