
In This Chapter
One of the most significant changes in Excel 2007 is the abandonment of the old 56-color workbook palette. This chapter describes how color is used in Excel 2007, including the new themes. I include many examples that should help you understand how these changes affect your workbooks. Here you will find
Specifying colors in VBA code
VBA conversion functions for various color models
Converting colors to grayscale
Working with Excel 2007 document themes
Modifying colors in Shape objects
Modifying colors in charts
Dealing with color in Excel 2007 is no trivial matter. I’m the first to admit that it can be complicated. And often, recording a macro while you change the color of a cell or object only adds to the confusion. In this chapter, I attempt to pull it all together.
Back in the pre–Excel 2007 days, a workbook stored a palette of 56-colors. These colors were the only ones available for cell backgrounds, cell text, and charts. Sure, you could modify any or all those colors, but there was no way to exceed the 56-color limit for a workbook.
But things have changed. You now have access to a virtually unlimited number of colors in a workbook — actually, the limit is 16,777,216 colors, but that certainly qualifies as virtually unlimited in my book.
In VBA, you can specify a color as a decimal color value, which is a number between 0 and 16,777,215. For example, the VBA statement that follows changes the background color of the active cell to a dark maroon:
ActiveCell.Interior.Color = 5911168
In addition, VBA has some predefined constants for some common colors. For example, vbRed has a value of 255 (the decimal value for pure red) and vbGreen has a value of 65,280.
No one, of course, can keep track of nearly 17 million colors, and the predefined constants are limited. A better way to change a color is to specify the color in terms of its red, green, and blue components — the RGB color system.
The RGB color system combines various levels of three colors: red, green, and blue. Each of these colors can range from 0 through 255. Therefore, the total number of possible colors is 256 x 256 x 256 = 16,777,216. When all three color components are 0, the color is pure black. When all three components are 255, the color is pure white. When all three are 128 (the half-way point), the color is middle gray. The remaining 16,777,213 possible combinations of these three values represent other colors.
To specify a color using the RGB system in VBA, use the RGB function. This function accepts three arguments that represent the red, blue, and green components of a color. The function returns a decimal color value.
The statement that follows uses the RGB function to assign a color that’s exactly the same as the one assigned in the preceding section (that dark maroon, 5911168):
ActiveCell.Interior.Color = RGB(128, 50, 90)
Table 30-1 shows the RGB values and the decimal color code of some common colors:
If you select the More Colors option when choosing a color in Excel, you see the Colors dialog box. Click the Custom tab, and you can choose from two color models to specify your color: RGB and HSL. Figure 30-1 shows the Colors dialog box with the HSL color model selected.
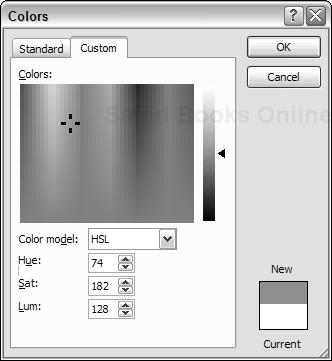
In the HSL color system, colors are specified using three parameters: Hue, Saturation, and Luminance. As with RGB colors, each of these parameters can range from 0 to 255. Each RGB color has an equivalent HSL color, and each HSL color has an equivalent decimal color value. In other words, any of the 16,777,216 colors can be specified by using any of the three color systems: RGB, HSL, or decimal.
Although the Colors dialog box lets you specify a color using the HSL color model, this is actually the only area in which Excel supports the HSL color model. For example, when you specify a color using VBA, it must be decimal color value. You can, of course, use the RGB function to return a decimal color value. However, VBA does not have a corresponding HSL function.
If you know the three color component values, converting an RGB color to a decimal color is easy. Just use VBA’s RGB function. Assume three variables (r, g, and b), each of which represents a color component value between 0 and 255. To calculate the equivalent decimal color value, use a statement like this:
DecimalColor = RGB(r, g, b)
To perform this conversion in a worksheet formula, create this simple VBA wrapper function:
Function RGB2DECIMAL(R, G, B)
'   Converts from RGB to decimal color
    RGB2DECIMAL = RGB(R, G, B)
End Function
The following example worksheet formula assumes the three color values are in A1:C1:
=RGB2DECIMAL(A1,B1,C1)
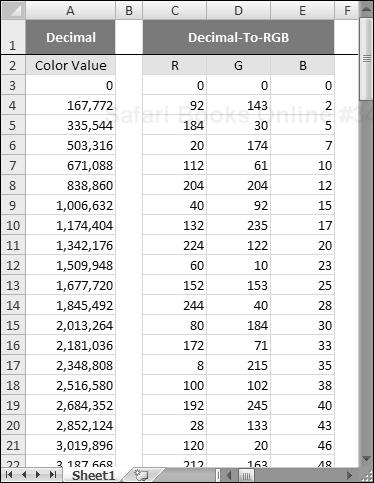
Converting a decimal color to its red, green, and blue components is not so simple. Here’s a function that returns a three-element array:
Function DECIMAL2RGB(ColorVal) As Variant
'   Converts a color value to an RGB triplet
'   Returns a 3-element variant array
    DECIMAL2RGB = Array(ColorVal  256 ^ 0 And 255, _
      ColorVal  256 ^ 1 And 255, ColorVal  256 ^ 2 And 255)
End Function
To use the DECIMAL2RGB function in a worksheet formula, the formula must be entered as a three-cell array formula. For example, assume that cell A1 contains a decimal color value. To convert that color value to its RGB components, select a three-cell horizontal range and then enter the following formula. Press Ctrl+Shift+Enter to make it an array formula, and don’t enter the braces.
{=DECIMAL2RGB(A1)}If the three-cell range is vertical, you need to transpose the array, as follows:
{=TRANSPOSE(DECIMAL2RGB(A1))}Figure 30-2 shows the DECIMAL2RGB function in use in a worksheet.
When you create worksheets and charts, it’s important to remember that not everyone has a color printer. And even if your chart is printed on a color printer, it’s possible that it may be photocopied, faxed, or viewed by someone who is color-blind (a condition that affects about 8 percent of the male population).
When content is printed on a non-color device, colors are converted to grayscale. Sometimes you’ll be lucky and your colors will display nicely when converted to grayscale. Other times, you won’t be so lucky. For example, the columns in a chart may be indistinguishable when the colors are converted.
Every grayscale color has an equal component of red, green, and blue. Pure black is RGB(0, 0, 0). Pure white is RGB(255, 255, 255). Neutral gray is RGB(128, 128, 128). Using this color system produces 256 shades of gray.
To create a 256-color grayscale in a range of cells, execute the procedure that follows. It colors the background of cells in the range A1:A256, starting with black and ending with white. You might want to zoom out on the worksheet to see the entire range.
Sub GenerateGrayScale()
    Dim r As Long
    For r = 0 To 255
        Cells(r + 1, 1).Interior.Color = RGB(r, r, r)
    Next r
End SubOne approach to grayscale conversion is to simply average the Red, Green, and Blue components of a color and use that single value for the Red, Green, and Blue components of its grayscale equivalent. That approach, however, does not take into account the fact that different colors are perceived as varying levels of brightness. For example, green is perceived to be brighter than red, and red is perceived to be brighter than blue.
Perceptual experiments have arrived at the following “recipe” to convert an RGB color value to a grayscale value
28.7% of the red component
58.9% of the green component
11.4% of the blue component
For example, consider color value 16751001, a shade of violet that corresponds to RGB(153, 153, 255). Applying the factors listed previously, the RGB values are
Red: 28.7% × 153 = 44
Green: 58.9% × 153 = 90
Blue: 11.4% × 255 = 29
The sum of these values is 163. Therefore, the corresponding grayscale RGB value for color value 16751001 is RGB(163, 163, 163).
Following is a VBA function that accepts a decimal color value as its argument and returns the corresponding grayscale decimal value.
Function Grayscale(color)
    Dim r As Long, g As Long, b As Long
    r = (color  256 ^  0 And 255) * 0.287
    g = (color  256 ^  1 And 255) * 0.589
    b = (color  256 ^  2 And 255) * 0.114
    Grayscale = RGB(r + g + b, r + g + b, r + g + b)
End FunctionOne way to approximate how your colors will look when converted to grayscale is to use Excel’s Print Preview feature with the printer set to a non-color device (such as a fax).
Here’s a technique that lets you see how an embedded chart looks converted to grayscale:
Select the chart.
Press Ctrl+C to copy the chart to the Clipboard.
Click a cell and choose Home
 Clipboard Paste Paste As Picture.
Select the picture and choose Picture Tools
Format Recolor and then choose the Grayscale color mode from the drop-down gallery.
These steps are automated in the macro that follows. The ShowChartAsGrayScale procedure copies the active chart as a picture and converts the picture to grayscale. After you’ve determined whether the colors are satisfactory, you can delete the picture.
Sub ShowChartAsGrayScale()
'   Copies the active chart as a grayscale picture
'   Embedded charts only
    If ActiveChart Is Nothing Then
        MsgBox "Select a chart."
        Exit Sub
    End If
    ActiveChart.Parent.CopyPicture
    ActiveChart.Parent.TopLeftCell.Select
    ActiveSheet.Pictures.Paste
    ActiveSheet.Pictures(ActiveSheet.Pictures.Count). _
      ShapeRange.PictureFormat.ColorType = msoPictureGrayscale
End SubFigure 30-3 shows a workbook that I created that deals with colors. If you’re at all confused about how the RGB color model works, spending some time with this color demo workbook will probably make it all very clear.
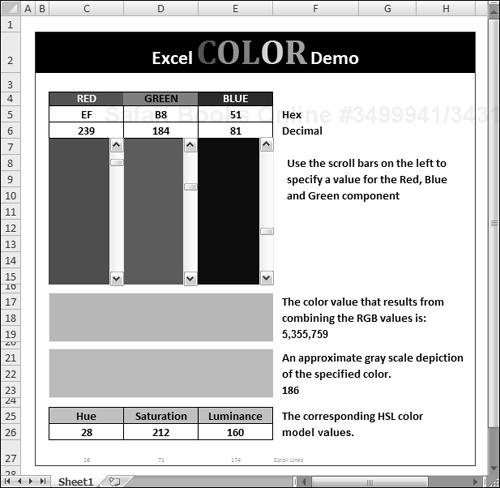
This workbook contains three vertical scrollbars, each of which controls the background color of a range. Use these scrollbars to specify the red, green, and blue component for a color to values between 0 and 255. Moving the scrollbars changes several areas of the worksheet:
The cells above the scrollbars display the color components in hexadecimal (00–FF) and in decimal (0–255).Hexadecimal RGB color values are often used in specifying colors for HTML documents.
The ranges next to each scrollbar change intensity, corresponding to the scrollbar’s position (that is, the value of the color component).
A range below the scrollbars depicts the combined color, determined by the RGB values you specify.
A cell displays the decimal color value.
Another range depicts the color’s approximate appearance when it is converted to grayscale.
A range of cells shows the corresponding HSL color values.
A significant new feature in Excel 2007 is document themes. With a single mouse click, the user can change the entire look of a document. A document theme consists of three components: colors, fonts, and effects (for graphic objects). The rationale for using themes is that they may help users produce better-looking and more consistent documents. A theme applies to the entire workbook, not just the active worksheet.
Microsoft Office 2007 ships with 20 document themes, and additional themes can be added. The user interface Ribbon includes several style galleries (for example, the Chart Styles gallery). The styles available in these galleries vary depending on which theme is assigned to the document. And, if you apply a different theme to the document, the document changes to reflect the new theme’s colors, fonts, and effects.
CD-ROM
If you haven’t explored document themes, open the workbook named document theme demo.xlsx found on the companion CD-ROM. This workbook contains a range that shows each theme color, two shapes, text (using the headings and body fonts), and a chart. Choose Page Layout ![]() Themes
Themes ![]() Themes Gallery to see how the worksheet changes with each theme.
Themes Gallery to see how the worksheet changes with each theme.
Users can also mix and match theme elements. For example, it’s possible to use the colors from one theme, the fonts from another theme, and the effects from yet a different theme. In addition, the user can create a new color set or a new font set. These customized themes can be saved and then applied to other workbooks.
Note

The concept of document themes is based on the notion that users will apply little, if any, non-theme formatting to the document. If the user applies colors or fonts that aren’t part of the current theme, this formatting will not be modified if a new theme is applied to the document. Therefore, it’s still very easy to create an ugly document with mismatched colors and too many different fonts.
When a user applies a color to a cell or object, the color is selected from a control like the one shown in Figure 30-4. The control displays the 60 theme colors (10 columns by 6 rows) plus 10 additional standard colors. Clicking the More Colors option displays the Color dialog box, in which the user can specify any of the 16,777,216 available colors.

The 60 theme colors are identified by pop-up ToolTips. For example, the color in the second row of the sixth column is known as “Accent 2, Tint 20%.” Table 30-2 shows the names of all 60 theme colors. Examine the table, and you see that there isn’t much of a pattern — although the Accent colors are consistent in terms of the tint and shade variations. Also, note that some color variations are known as a tint and others are known as a shade.
Table 30-2. THEME COLOR NAMES
Row/Column | 1 | 2 | 3 | 4 | 5 | 6 | 7 | 8 | 9 | 10 |
|---|---|---|---|---|---|---|---|---|---|---|
1 | Text/Background1 | Text/Background2 | Text/Background3 | Text/Background4 | Accent1 | Accent2 | Accent3 | Accent4 | Accent5 | Accent6 |
2 | Shade 95% | Tint 95% | Shade 90% | Tint 20% | Tint 20% | Tint 20% | Tint 20% | Tint 20% | Tint 20% | Tint 20% |
3 | Shade 85% | Tint 65% | Shade 75% | Tint 40% | Tint 40% | Tint 40% | Tint 40% | Tint 40% | Tint 40% | Tint 40% |
4 | Shade 75% | Tint 75% | Shade 50% | Tint 60% | Tint 60% | Tint 60% | Tint 60% | Tint 60% | Tint 60% | Tint 60% |
5 | Shade 65% | Tint 85% | Shade 25% | Shade 75% | Shade 75% | Shade 75% | Shade 75% | Shade 75% | Shade 75% | Shade 75% |
6 | Shade 50% | Tint 95% | Shade 10% | Shade 50% | Shade 50% | Shade 50% | Shade 50% | Shade 50% | Shade 50% | Shade 50% |
Keep in mind that these color names remain the same, even if a different document theme is applied. The document theme colors actually consist of the 10 colors displayed in the top row (four text/background colors and six accent colors), and each of these 10 colors has five tint/shade variations.
Note
If you select Page Layout ![]() Themes
Themes ![]() Colors
Colors ![]() Create New Theme Colors, you see that a theme has two additional colors: Hyperlink and Followed Hyperlink. These are the colors applied when a hyperlink is created, and they are not shown in the color selector control.
Create New Theme Colors, you see that a theme has two additional colors: Hyperlink and Followed Hyperlink. These are the colors applied when a hyperlink is created, and they are not shown in the color selector control.
You may find it enlightening to record a macro while you change the fill color and text color of a range. Following is a macro that I recorded when a range was selected. For the fill color, I chose “Accent 2, Shade 75%,” and for the text color, I chose “Text/Background 3, Shade 90%.”
Sub Macro1()
    With Selection.Interior
        .Pattern = xlSolid
        .PatternColorIndex = 56
        .ThemeColor = 6
        .TintAndShade = -0.249977111117893
        .PatternTintAndShade = 0
    End With
    With Selection.Font
        .ThemeColor = 3
        .TintAndShade = -9.99786370433668E-02
    End With
End Sub
First of all, you can safely ignore the three pattern-related properties (Pattern, PatternColorIndex, and PatternTintAndShade). These properties refer to the ugly, old-fashioned (but still supported) cell patterns, which you can specify in the Fill tab of the Format Cells dialog box. These properties simply maintain any existing pattern that may exist in the range.
The recorded macro, after I delete the three pattern-related properties, is
Sub Macro1()
    With Selection.Interior
        .ThemeColor = 6
        .TintAndShade = -0.249977111117893
    End With
    With Selection.Font
        .ThemeColor = 3
        .TintAndShade = -9.99786370433668E-02
    End With
End Sub
As you can see, each color is specified in terms of a ThemeColor property and a TintAndShade property. The ThemeColor property is easy enough to decipher. It’s simply the column number of the 10-x-6 theme color table. But what about the TintAndShade property?
The TintAndShade property can have a value between −1 and +1. A value of –1 results in black, and a value of +1 results in white. A TintAndShade property value of 0 gives the pure color. In other words, as the TintAndShade value goes negative, the color gets increasingly darker until it’s pure black. As the TintAndShade value goes positive, the color gets increasingly lighter until it’s pure white.
To arrive at the TintAndShade property value that corresponds to a particular theme color variation, look at Table 30-2.
If the color variation is expressed as a Tint, the
TintAndShadeproperty value is 1 minus the percent value (a positive value, making the variation lighter than the original color).If the color variation is expressed as a Shade, the
TintAndShadeproperty value is the percent value minus 1 (a negative value, making the variation darker than the original value).
CD-ROM
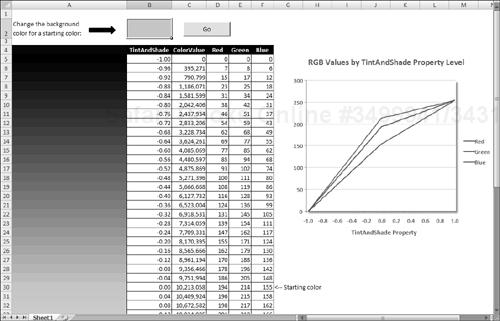
For a demonstration of how the TintAndShade property changes a color, open the tintandshade demo.xlsm workbook on the companion CD-ROM (see Figure 30-5). Specify a starting color, and the macro displays that color with 50 levels of the TintAndShade property values, ranging from −1 to +1. It also displays the decimal color value and the red, green, and blue components of the color (which are displayed in a chart).
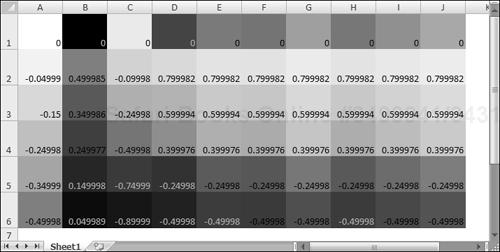
Using the information in Table 30-1, I wrote a macro that displays all 60 theme color variations in a range of cells.
Sub ShowThemeColors()
  Dim r As Long, c As Long
  For r = 1 To 6
    For c = 1 To 10
        With Cells(r, c).Interior
        .ThemeColor = c
        Select Case c
            Case 1 'Text/Background 1
            Select Case r
                Case 1: .TintAndShade = 0
                Case 2: .TintAndShade = -0.05
                Case 3: .TintAndShade = -0.15
                Case 4: .TintAndShade = -0.25
                Case 5: .TintAndShade = -0.35
                Case 6: .TintAndShade = -0.5
            End Select
        Case 2 'Text/Background 2
            Select Case r
                Case 1: .TintAndShade = 0
                Case 2: .TintAndShade = 0.5
                Case 3: .TintAndShade = 0.35
                Case 4: .TintAndShade = 0.25
                Case 5: .TintAndShade = 0.15
                Case 6: .TintAndShade = 0.05
            End Select
        Case 3 'Text/Background 3
            Select Case r
                Case 1: .TintAndShade = 0
                Case 2: .TintAndShade = -0.1
                Case 3: .TintAndShade = -0.25
                Case 4: .TintAndShade = -0.5
                Case 5: .TintAndShade = -0.75
                Case 6: .TintAndShade = -0.9
            End Select
        Case Else 'Text/Background 4, and Accent 1-6
            Select Case r
                Case 1: .TintAndShade = 0
                Case 2: .TintAndShade = 0.8
                Case 3: .TintAndShade = 0.6
                Case 4: .TintAndShade = 0.4
                Case 5: .TintAndShade = -0.25
                Case 6: .TintAndShade = -0.5

            End Select
        End Select
       Cells(r, c) = .TintAndShade
        End With
    Next c
  Next r
End Sub
Figure 30-6 shows the result of executing the ShowThemeColors procedure (it looks better in color). If you change to a different document theme, the colors will be updated to reflect those in the new theme.
So far in this chapter, I’ve described how to change the fill color of a range by setting the Color property of the Interior object. As I noted, using the VBA RGB function makes this easier. These two statements demonstrate how to change the fill color of a range (they both have the same result):
Range("A1:F24").Interior.Color = 5913728
Range("A1:F24").Interior.Color = RGB(128, 60, 90)
What if you’d like your code to change the background color of a range to a specific theme color, such as the color in the third row of the sixth column (the color identified as “Accent 2, Tint 40%”)?
Unfortunately, the Excel 2007 designers seemed to have forgotten to include a direct way to specify a theme color using this type of indexing. You might think the ColorIndex property would do the job, but it doesn’t. The ColorIndex property refers to colors in the (pre–Excel 2007) 56-color palette.
In actual practice, this omission is not a serious problem. When setting a color, the important property is the ThemeColor property, which ranges from 1 to 10. Your code can assign a value to the TintAndShade property to vary that color (a negative value for a darker variation, a positive value for a lighter variation). If the user applies a different document theme, the color still changes in a relative manner.
So far, this chapter has focused exclusively on modifying the color of a range. This section provides examples of changing colors in Shape objects. In Excel, use the Insert ![]() Illustrations
Illustrations ![]() Shapes group to add a shape to a worksheet.
Shapes group to add a shape to a worksheet.
Figure 30-7 shows a Shape object inserted on a worksheet. This object’s default name is Right Arrow 1. The number in the name varies, depending on how many shapes you have inserted. For example, if you had previously inserted two other shapes (of any style), the name would be Right Arrow 3.

The background color of a Shape object is determined by the RGB property. So, to get the decimal color value of this shape, use a statement like this:
MsgBox ActiveSheet.Shapes("Right Arrow 1").Fill.ForeColor.RGBThis statement may be a bit confusing, so I’ll break it down. The Fill property of the Shape object returns a FillFormat object. The ForeColor property of the FillFormat object returns a ColorFormat object. So the RGB property actually applies to the ColorFormat object, and this property contains the decimal color value.
Note
If you’re confused about the use of the ForeColor property in this example, you’re not alone. Most people, myself included, would expect to use the BackColor property of the FillFormat object to change the background color of an object. As it turns out, the BackColor property is used for the second color if the object is shaded or filled with a pattern. For an unfilled Shape with no pattern, the ForeColor property controls the background color.
When working with Shape objects, you almost always want your code to perform multiple actions. Therefore, it’s efficient to create an object variable. The code that follows creates an object variable named Shp:
Dim Shp As Shape
Set Shp = ActiveSheet.Shapes("Right Arrow 1")
MsgBox Shp.Fill.ForeColor.RGB
Tip
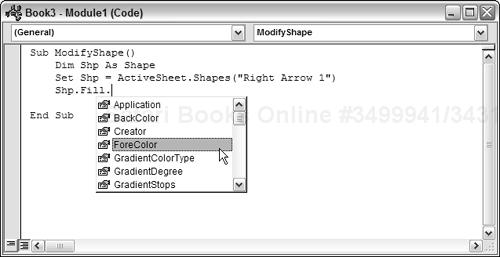
An additional advantage to creating an object variable is that you can take advantage of the VBE’s Auto List Members feature, which displays the possible properties and objects as you type (see Figure 30-8). This is particularly helpful in the case of Shape objects because actions you take with Shapes are not recorded by Excel’s macro recorder.
If you’ll be working only with the shape’s colors, you can create an object variable for the shape’s ColorFormat object, like this:
Dim ShpCF As ColorFormat
Set ShpCF = ActiveSheet.Shapes("Right Arrow 1").Fill.ForeColor
MsgBox ShpCF.RGB
The RGB property of the ColorFormat object controls the color of the shape. Following are some additional properties. If you’re not familiar with document theme colors, see “Understanding document theme colors,” earlier in this chapter.
ObjectThemeColor:A number between 1 and 10 that represents the theme color (that is, a color in the first row of the 10-x-6 theme color grid)SchemeColor:A number that ranges from 0 to 80 that represents the color as an index in the current color scheme. These are colors from the old 56-color palette, and I don’t see any need to ever use theSchemeColorproperty.TintAndShade:A number between −1 and +1 that represents the tint or shade of the theme color.Type:A number that represents theColorFormatobject type. As far as I can tell, this read-only property is always 1, which represents the RGB color system.
Changing the background color of a shape does not affect the shape’s outline color. To modify the color of a shape’s outline, access the ColorFormat object of the shape’s LineFormat object. The following statements set a Shape’s background color and outline to red:
Dim Shp As Shape
Set Shp = ActiveSheet.Shapes("Right Arrow 1")
Shp.Fill.ForeColor.RGB = RGB(255, 0, 0)
Shp.Line.ForeColor.RGB = RGB(255, 0, 0)
Here’s an alternative way to accomplish the same effect, using object variables:
Dim Shp As Shape
Dim FillCF As ColorFormat
Dim LineCF As ColorFormat
Set Shp = ActiveSheet.Shapes("Right Arrow 1")
Set FillCF = Shp.Fill.ForeColor
Set LineCF = Shp.Line.ForeColor
FillCF.RGB = RGB(255, 0, 0)
LineCF.RGB = RGB(255, 0, 0)Shapes can also display other types of fills, such as gradients, pictures, and textures. The examples in this section demonstrate how to apply these other types of fills to a Shape object.
CD-ROM
All the examples in this section are available on the companion CD-ROM. The filename is shape object colors.xlsm.
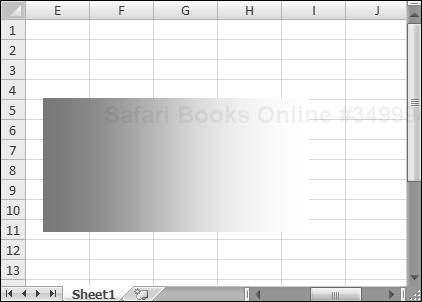
The following code creates a rectangle, hides its border, and applies a two-color gradient. One of the colors is set specifically; the other color is one of the document theme colors. Figure 30-9 shows the result of running this macro.
Sub MakeShapeWithGradient()
Dim Shp As Shape
' Create the shape
Set Shp = ActiveSheet.Shapes.AddShape( _
Type:=msoShapeRectangle, _
Left:=100, _
Top:=10, _
Width:=200, _
Height:=100)
' Hide the border
Shp.Line.Visible = False
' Add 2-color gradient
With Shp.Fill
.TwoColorGradient _
Style:=msoGradientVertical, Variant:=2
.ForeColor.RGB = RGB(255, 255, 255) 'white
.BackColor.ObjectThemeColor = msoThemeColorAccent4
End With
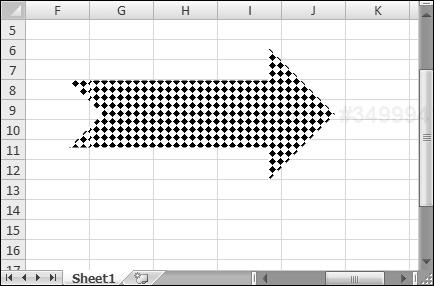
End SubThe code that follows creates a Shape that uses pattern fill. See Figure 30-10.
Sub MakeShapeWithPattern()
    Dim Shp As Shape


'   Create the shape
    Set Shp = ActiveSheet.Shapes.AddShape( _
        Type:=msoShapeNotchedRightArrow, _
        Left:=100, _
        Top:=10, _
        Width:=200, _
        Height:=100)


'   Hide the border
    Shp.Line.Visible = False


'   Add a pattern
    With Shp.Fill
        .Patterned Pattern:=msoPatternSolidDiamond
        .ForeColor.RGB = RGB(0, 0, 0) 'black
        .BackColor.RGB = RGB(255, 255, 255) 'white
    End With
End Sub
The next procedure is similar, but it uses a picture for the Shape’s background. The graphic file is loaded from the disk. The code also adds a reflection to the Shape. Figure 30-11 shows the result.
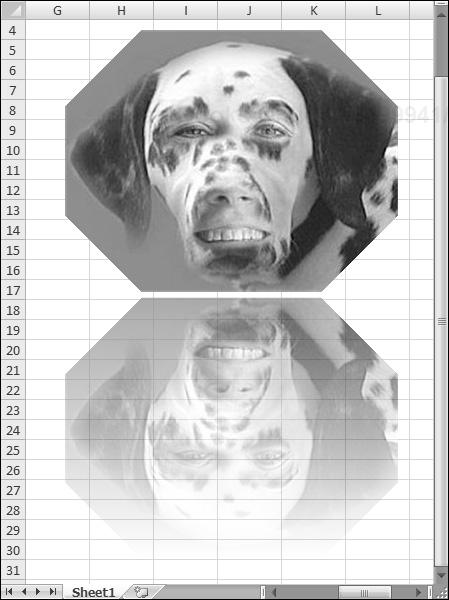
Sub MakeShapeWithPicture()
    Dim Shp As Shape


'   Create the shape
    Set Shp = ActiveSheet.Shapes.AddShape( _
        Type:=msoShapeOctagon, _
        Left:=100, _
        Top:=10, _
        Width:=250, _
        Height:=196)


'   Hide the border
    Shp.Line.Visible = False


'   Add a picture
    Shp.Fill.UserPicture _
        ThisWorkbook.Path & "weirddog.jpg"

'   Give it a reflection
    Shp.Reflection.Type = msoReflectionType5
End Sub
The next Shape object example creates a shape with a texture and applies some 3-D effects and a shadow. Figure 30-12 shows the result.

Sub MakeShapeWithTexture()
    Dim Shp As Shape
'   Create the shape
    Set Shp = ActiveSheet.Shapes.AddShape( _
        Type:=msoShapeCross, _
        Left:=100, _
        Top:=10, _
        Width:=200, _
        Height:=200)


'   Hide the border
    Shp.Line.Visible = False


'   Give it a texture
    Shp.Fill.PresetTextured _
       PresetTexture:=msoTextureBlueTissuePaper


'   Some 3D effects
    With Shp.ThreeD
        .Visible = True
        .Depth = 60
        .BevelTopDepth = 10
        .RotationY = 10
    End With

'   And a shadow
    With Shp.Shadow
        .Visible = True
        .Transparency = 0.8
        .OffsetX = 30
        .OffsetY = 30
        .Blur = 12
    End With
End Sub
The final Shape example involves text. The procedure adds a shape, sets the shape’s background, adjusts the border, adds text, and then formats the text — very similar to what happens when you insert a WordArt object. That’s because there’s really nothing special about WordArt. When you use the Insert ![]() Text
Text ![]() WordArt command, you’re just inserting a shape that has text. Your code can manipulate WordArt just as it can manipulate Shape objects.
WordArt command, you’re just inserting a shape that has text. Your code can manipulate WordArt just as it can manipulate Shape objects.
Sub MakeShapeWithText()
    Dim Shp As Shape
'   Create the shape
    Set Shp = ActiveSheet.Shapes.AddShape( _
        Type:=msoShapeRectangle, _
        Left:=200, _
        Top:=10, _
        Width:=200, _
        Height:=100)

'   Shape's background color
    Shp.Fill.ForeColor.ObjectThemeColor = msoThemeColorLight2
    Shp.Shadow.Visible = True

'   Shape's border
    Shp.Line.ForeColor.ObjectThemeColor = msoThemeColorAccent2
    Shp.Line.Weight = 6

'   Add text
    Shp.TextFrame2.TextRange.Text = "Microsoft Excel"

'   Format the text
    With Shp.TextFrame2.TextRange.Font
        .Size = 38
        .Bold = True
        .Fill.ForeColor.ObjectThemeColor = msoThemeColorAccent2
        .Shadow.Visible = True
    End With
End Sub
Figure 30-13 shows the result of executing the MakeShapeWithText procedure.

The information in this section barely scratches the surface when it comes to working with Shape objects. Programming shapes with VBA could easily serve as the subject matter for a complete book.
To learn more about Shape objects, use the Object Browser (press F2, in the VBE), the Help system, the macro recorder (which is of limited value), and the Internet. And don’t forget the best learning tool of them all: experimentation.
This section describes how to change colors in a chart. The most important point is to identify the specific chart element that you want to modify. In other words, you need to identify the object and then set the appropriate properties.
Figure 30-14 shows a simple column chart named Chart 1. This chart has two data series, a legend, and a chart title.

Following is a VBA statement that changes the color of the first data series to red.
ActiveSheet.ChartObjects("Chart 1").Chart. _
    SeriesCollection(1).Format.Fill.ForeColor.RGB = vbRed
To the uninitiated, this statement is probably confusing because so many objects are involved. The object hierarchy is as follows:
The active sheet contains a ChartObjects collection. One object in that collection is the ChartObject named Chart 1. The Chart property of the ChartObject object returns a Chart object. The Chart object has a SeriesCollection collection, and one Series object in the collection has an index number of 1. The Format property of the Series object returns a ChartFormat object. The Fill property of the ChartFormat object returns a FillFormat object. The ForeColor property of the FillFormat object returns a ColorFormat object. The RGB property of the ColorFormat object is set to red.
Cross-Reference
Refer to Chapter 18 for more information about using VBA to work with charts.
Another way of writing the preceding statement, using object variables to identify the individual objects (and, perhaps, clarify the objects’ relationships), is
Sub ChangeSeries1Color
    Dim MyChartObject As ChartObject
    Dim MyChart As Chart
    Dim MySeries As Series
    Dim MyChartFormat As ChartFormat
    Dim MyFillFormat As FillFormat
    Dim MyColorFormat As ColorFormat

'   Create the objects
    Set MyChartObject = ActiveSheet.ChartObjects("Chart 1")
    Set MyChart = MyChartObject.Chart
    Set MySeries = MyChart.SeriesCollection(1)
    Set MyChartFormat = MySeries.Format
    Set MyFillFormat = MyChartFormat.Fill
    Set MyColorFormat = MyFillFormat.ForeColor

'   Change the color
    MyColorFormat.RGB = vbRed
End Sub
The RGB property accepts a decimal color value, which I specified using a built-in VBA constant. Other color-related properties of the ColorFormat object are
ObjectThemeColor:A number between 0 and 16 that represents the theme color. VBA provides constants for these values. For example,msoThemeColorAccent3contains the value 7.TintAndShade:A number between −1 and +1 that represents the tint or shade of the theme color.
CD-ROM
The examples in this section are available on the companion CD-ROM. The filename is chart colors.xlsm.
You can also specify color gradients. Here’s an example that applies a preset gradient to the second data series in a chart. Notice that the gradient is set using the FillFormat object:
Sub AddPresetGradient()
    Dim MyChart As Chart
    Set MyChart = ActiveSheet.ChartObjects("Chart 1").Chart
    With MyChart.SeriesCollection(1).Format.Fill
        .PresetGradient _
            Style:=msoGradientHorizontal, _
            Variant:=1, _
            PresetGradientType:=msoGradientFire
    End With
End Sub
Working with other chart elements is similar. The procedure that follows changes the colors of the chart’s chart area and plot area, using colors from the current document theme:
Sub RecolorChartAndPlotArea()
    Dim MyChart As Chart
    Set MyChart = ActiveSheet.ChartObjects("Chart 1").Chart
    With MyChart
        .ChartArea.Format.Fill.ForeColor.ObjectThemeColor = _
             msoThemeColorAccent6
        .ChartArea.Format.Fill.ForeColor.TintAndShade = 0.9
        .PlotArea.Format.Fill.ForeColor.ObjectThemeColor = _
             msoThemeColorAccent6
        .PlotArea.Format.Fill.ForeColor.TintAndShade = 0.5
    End With
End Sub
The final example in this section applies a random color to each chart element. Using this macro virtually guarantees an ugly chart. However, this code demonstrates how to change the color for other chart elements. The UseRandomColors procedure uses a simple function, RandomColor, to determine the color used.
Sub UseRandomColors()
    Dim MyChart As Chart
    Set MyChart = ActiveSheet.ChartObjects("Chart 4").Chart
    With MyChart
        .ChartArea.Format.Fill.ForeColor.RGB = RandomColor
        .PlotArea.Format.Fill.ForeColor.RGB = RandomColor
        .SeriesCollection(1).Format.Fill.ForeColor.RGB = RandomColor
        .SeriesCollection(2).Format.Fill.ForeColor.RGB = RandomColor
        .Legend.Font.Color = RandomColor
        .ChartTitle.Font.Color = RandomColor
        .Axes(xlValue).MajorGridlines.Border.Color = RandomColor
        .Axes(xlValue).TickLabels.Font.Color = RandomColor
        .Axes(xlValue).Border.Color = RandomColor
        .Axes(xlCategory).TickLabels.Font.Color = RandomColor
        .Axes(xlCategory).Border.Color = RandomColor
    End With
End Sub

Function RandomColor()
    RandomColor = Application.RandBetween(0, RGB(255, 255, 255))
End Function