
8
Strain Gauges
8.1 INTRODUCTION
A gauge used to measure strain is termed as a strain gauge. This gauge can be mechanical, optical, or electrical. An ordinary scale can be used to measure the strains. But the least count of an ordinary scale is 0.5 mm, if the gauge length of specimen is 100 mm, then least count of strain measurement is (0.5/100) = 0.005 = 5000 microstrain. But for accurate determination of strains at a point the least count of strain measuring instrument should be ±1 μ strain. A mechanical extensometer known as Huggenberger extensometer, with magnification of change in length of the order of 1200. The least count on measurement scale is 0.5 mm. Then least count of change in length on gauge length is 0.5/1200 = 4.166 × 10⁻⁴. For a gauge length of 25 mm, strain will be (4.166 × 10⁻⁴)/25 = 1.666 × 10⁻⁵ or 16.66 microstrain. The use of this extensometer is too cumbersome and mechanical elements in the extensometer possess heavy inertia forces and dynamic strains cannot be recorded. There are optical extensometers, where the mechanical levers are replaced by optical levers such as Tuckerman’s optical gauge but the operation of this gauge necessitates the employment of a highly skilled mechanic.
In order to achieve the least count of ±1 microstrain and recording of dynamic strains, electrical gauges have been developed. The principle of operation of these gauges is that change in magnitude of electrical signal is directly proportional to the strain being measured. There are capacitance, inductance, and resistance strain gauge, but the inertia effect of capacitance and inductance strain gauges is large which render these useless for dynamic strain measurement. To overcome the defect of large inertia and friction in mechanical systems, electrical resistance strain gauges have been developed which are known as inertialess strain gauges. An electrical resistance strain gauge should have following characteristics.
- Strain can be measured with least count of ±1 microstrain.
- Strain is measured at a point, therefore the size of the gauge (i.e. its length and breadth) should be as small as possible.
- Response of gauge should be sufficient to record dynamic strains.
- There is a relationship between change in resistances of the gauge and strain applied defined by a calibration constant. The gauge should have a stable calibration constant.
- Operation of system using electrical resistance strain gauge should be simple.
- Output of strain gauge should be linear.
- Strain gauge elements can be suitably used in transducer applications.
- Output from the gauge during read out period should be independent of changes in temperatures and environmental parameters.
8.2 ELECTRICAL RESISTANCE STRAIN GAUGE
For most part, strain gauge applications are confined to free surfaces of a body.
We have learnt that there are three strains εxx, εyy, and γxy in a two-dimensional case. An ordinary extensometer, however sophisticated it may be, determines only the change in length over a fixed gauge length. To determine the state of stress at a point, it is essential that three strain components εxx, εyy, and γxy must be determined by recording strains in any three directions at a point.
Strain is always defined over a small domain at a point; therefore a strain gauge employed for the measurement of strain must be very small in size. This has been made possible by making use of a thin electrical conductor in the form of a wire. If a wire is adhered onto the surface of a specimen such that specimen strains are transmitted to the wire, as shown in Figure 8.l, then for a tensile strain, length of the wire will increase and its area of cross-section will decrease. Consequently, the resistance of the wire will increase. This change in resistance is proportional to the tensile strain. In other words, if the change in resistance is measured, then the surface strain on the specimen can be determined. This is the basic principle of an electrical resistance strain gauge.
In order to have a considerable initial resistance of the wire and a small gauge length, a very thin wire (20–25 micron in diameter) is used in the form of a grid as shown in Figure 8.2.
For general purpose strain gauges, the resistance of the gauge is 120 Ω. If a strain gauge is fabricated from a wire 0.025 mm in diameter having a resistance of 10 ohm/cm, then for a 120 Ω, strain gauge would require a single length of 12 cm long wire. This gauge length is often undesirable. This is normally shortened by making a grid but at the expense of gauge width and induced cross-sensitivity.
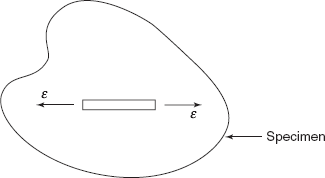
Figure 8.1 Strain sensing wire on specimen
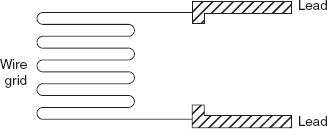
Figure 8.2 Wire grid strain gauge
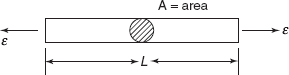
Figure 8.3 Strain sensing wire
Now say R is the resistance of the wire of an alloy used for strain gauge as shown in Figure 8.3.
where |
ρ = specific resistance of the wire of the conductor, |
|
L = length of the wire, and |
|
A = area of cross section of the wire. |
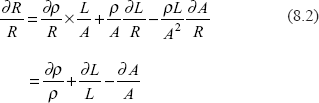
Differentiating Eq. (8.1) and dividing both sides by R, we get
Say the initial wire diameter = d0.
Final wire diameter = df.
Then
where v is the Poisson’s ratio of the material of the wire.
change in area, ![]()
and ![]()
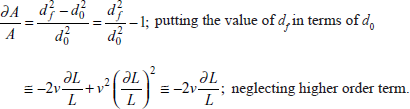
Substituting this value in Eq. (8.2)
Strain sensitivity of the metallic alloy used in conductor is
For most commonly used alloys in the manufacture of strain gauges, SA is given in the following table.
| Material | Composition | SA |
|---|---|---|
Advance or Constantan |
45 Ni, 55 Cu |
2.0–2.1 |
Nichrome |
80 Ni, 20 Cr |
2.1 |
Isoelastic |
36 Ni, 8 Cr, 0.5 Mo, 55.5 Fe |
3.6 |
Karma |
74 Ni, 20 Cr, 3 Al, 3 Fe |
2.0 |
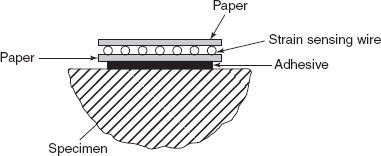
Figure 8.4 Gauge mounted on a specimen
For general static strain measurement, strain gauges of advance alloy are used while for dynamic strain measurements, strain gauges made of isoelastic alloy are used.
The strain sensing wire in the form of a grid is carried between two thin carriers with the help of an adhesive. The backing materials which carry the wire grid are fabricated from paper, phenolic, epoxy, polyester, plastic, or ceramics. The gauge is bonded directly to the surface being analysed with the help of a thin layer of adhesive as shown in Figure 8.4. The adhesive serves to transmit strains from the specimen to the gauge wire and also to insulate the gauge from the specimen. The flat grid configuration is employed for gauge lengths greater than 6 mm.
8.3 GAUGE SENSITIVITIES AND GAUGE FACTOR
Strain sensitivity of a straight conductor of an alloy is
where ε is the uniform strain along the conductor. When the wire is wound in the form of a grid, the strain sensitivity is changed due to end loops. If the gauge is in a biaxial strain field, the loops will register a resistance change proportional to the lateral (cross) strain εyy as shown in Figure 8.5.
The gauge factor of strain gauge is defined as
where lateral strain, εyy = −v0εxx.
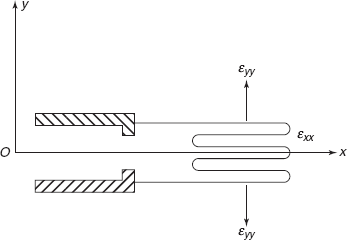
Figure 8.5 Wire grid gauge
The strain gauge is calibrated on a mild steel specimen and in the above expression, vo = 0.29, Poisson’s ratio of mild steel. If this gauge factor is used to convert resistance change to strain in any strain field other than the one in which gauge was calibrated, an error will result. This error can be corrected by taking into account the cross-sensitivity factor of the gauge.
The cross-sensitivity factor for a flat wire grid gauge is
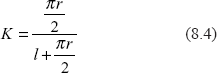
where l = length of straight segment, and
r = radius of end loop as shown in Figure 8.6.
The derivation of Eq. (8.4) is beyond the scope of this book. The reader can note that to reduce the effect of cross-sensitivity K, radius of loop should be as small as possible. But reduction in loop radius r introduces high bending stresses in wire and cold working in wire.
The readings taken from strain gauges placed in a biaxial strain field can be corrected by using the following relationships:
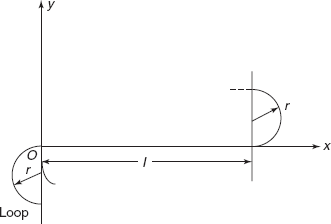
Figure 8.6 Straight segment with end loops
true strains,
where ε′xx and ε′yy are the recorded strain readings in a biaxial strain filed.
In some cases, the error introduced by the cross-sensitivity effects may be quite small; however in some other cases, this error may be large particularly when one strain level is very high and other is very low.
8.3.1 Metal Foil Gauges
In order to reduce the effect of cross-sensitivity and to increase the flexibility and fatigue life of strain gauges, thin metal foil gauges are used.
The grid element in thin foil gauges is many times wider than it is thick and therefore provides a larger ratio of bonding area to cross-sectional area than that in a wire grid gauge. Because of larger area, the foil gauges have better heat dissipation property. Cross-sensitivity effects in thin foil gauge are much smaller than those in wire grid gauges because cross-section at the ends is much greater than the cross-section along the straight segment as shown in Figure 8.7.
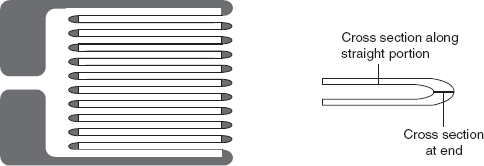
Figure 8.7 Metal foil gauge
The metal film gauge or foil gauge are usually mounted on a thin epoxy carrier which is approximately 0.02 mm thick and extremely flexible. These gauges are available in gauge lengths ranging from 0.4 to 25 mm with resistances ranging from 60 to 1000 Ω.
8.4 TEMPERATURE COMPENSATION
Sometimes the testing period is long or the readout period of the gauge is very long, then stability or freedom from zero drift of the gauge installation becomes a prime consideration. Changes in temperature over the period of read out influences the stability of gauge installation. Say the temperature of the gauge installation increases by ∆T, then
- the gauge will elongate

- The base material upon which the gauge is mounted will also elongate

- The resistivity of the gauge material, ρ, changes because of the influence of temperature coefficient of resistivity of the gauge material

Combined effect of these three factors will be
where |
α = thermal co-efficient of expansion of gauge material, |
|
β = thermal coefficient of expansion of base material, |
|
γ = temperature coefficient of resistivity of the gauge material, and |
|
Sg = strain sensitivity of the gauge, gauge factor. |
If α ≠ β, gauge is subjected to a mechanical strain. ε = (β – α) ΔT, which does not occur in the specimen due to load and ∂R occurs due to apparent strain ε.
If α = β, then there is no mechanical strain ε, but still the gauge will register a change of resistance with temperature if the thermal coefficient of resistivity γ is not zero.
There are two approaches to achieve temperature compensation in a gauge system, i.e. (i) compensation in the gauge so that net effect of three factors is cancelled out and (ii) compensation in the electrical system for the effects of the temperature change.
In producing temperature compensated gauges, it is possible to obtain compensation by perfectly matching the coefficients of expansion of base material and the gauge alloy, while holding the temperature coefficient of resistivity at zero. Compensation can also be obtained with a mismatch in the coefficients of expansion (α ≠ β), if the effect of a finite temperature coefficient of resistivity cancels out the effect of the mismatch in temperature coefficients of expansion.
Two alloys A and B are carefully selected so that they both respond to temperature changes but exactly in the opposite sense. By properly selecting the lengths of the wires of the two materials, as shown in Figure 8.8, the temperature effects can be cancelled out and a gauge with a low temperature response over a limited range in temperature can be successfully produced.
The second approach will be discussed while dealing with the electrical circuits used for strain measurement.
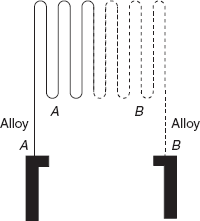
Figure 8.8 Dual element temperature compensated strain gauge
8.5 PARAMETERS INFLUENCING THE BEHAVIOUR OF STRAIN Gauge
Electrical resistance strain gauges are manufactured with a gauge factor accurate to ± 0.5% and a resistance accurate to about ± 0.2%. But during experimental analysis, several parameters can influence the behaviour of the gauge and affect its accuracy. The successful application of electrical resistance strain gauges demands a thorough knowledge of all these parameters such as adhesive, strain cycles, heat dissipation, time, humidity, moisture, hydrostatic pressure, etc.
8.5.1 Sample Preparation
The wire or a foil type strain gauge is mounted on a specimen with an adhesive which serves the vital function of transmitting the strain from the specimen to the gauge sensing element without distortion. While employing the adhesive, it is essential that the surface of the specimen be properly prepared and absolutely clean. Any paint or oxide film on the surface of the specimen is removed by sanding. The surface is then thoroughly degreased by scrubbing it with acetone. At the same time, the bottom side of the gauge is cleaned with acetone just prior to its placement. After the gauge is installed, the adhesive must be exposed to proper combination of pressure and temperature for a suitable length of time to ensure complete cure.
The curing process is quite complicated since adhesive expands because of heat, experiences a reduction in volume due to polymerization, exhibits a contraction upon cooling, and many a times indicates a posture shrinkage. Since the adhesive is sufficiently strong to control the deformation of the strain sensitive element in the gauge, any residual stress set up in the adhesive will influence the output from the strain gauge.
8.5.2 Adhesives
The adhesives generally used for strain gauge installation are (i) Duco cement (cellulose nitrate), (ii) Bakelite (Phonelic) cement, (iii) Epoxy, (iv) Eastman 910 (Cynoacrylate), and (v) Ceramic cement.
Cellulose nitrate consists of 85 per cent solvent and 15 per cent solids; therefore an appreciable amount of solvent is to be removed by evaporation. By placing a strain gauged component in an air circulating oven at 130°F, the time required for curing is appreciably shortened and complete cure can be affected in a day or two.
Once the gauge is completely dried, it must be immediately water proofed otherwise the cellulose nitrate cement will begin to absorb moisture from the atmosphere and it will expand. This expansion can materially influence the gauge reading if the readout period is long.
Phonelic cement is cured by a combination of pressure and heat over a given interval of time. Phonelic, a combination of phenol and formaldehyde during curing, release water as a by-product and it is necessary that this water be removed and any porosity produced as a result of the formation of water vapours must be avoided. Curing at 180°F for 12 hours at 7 to 14 kg/cm2 pressure will accomplish this task.
If the gauge is to be employed at temperature in excess of 350°F, thin gauge installation with phenolic cement should be subjected to a minimum of two temperature cycles to this higher temperature before measurements are made.
Epoxy consists of a monomer and a hardening agent which induces polymerization. It is a thermosetting plastic and exhibits higher bond strength.
The amount of hardener added to the monomer is extremely important because the heat distortion temperatures and residual stresses produced during polymerization can be materially influenced by a slight variation from the specified value. A filler material such as aluminium oxide 5% to 10% by weight is often beneficial since it improves the bond strength and reduces temperature coefficient of expansion of the epoxy.
Cynoacrylate cement is quite unusual in that it requires neither heat nor catalyst to induce polymerization. The minute traces of water or other weak bases on the surface of the component are sufficient to trigger the process of polymerization.
In strain gauge application, a thin film of this adhesive is placed between the gauge and the specimen and gentle pressure is applied for about a minute or two to induce polymerization. The shelf life of this adhesive is very short, i.e. 2 to 3 months only. It must be stored at low temperature at 35–45°F.
Ceramic cement is used for very high temperature applications. Strain sensing wire is carried between two strippable carriers. The carrier is removed during application of the gauge and a ceramic adhesive serves to maintain the grid configuration and to insulate the gauge.
Ceramic cement consists of a blend of finely ground ceramic powder such as alumina and silica combined with phosphoric acid. This blend is mixed with a solvent such as isopropyl alcohol and an organic binder to form a liquid mixture. A precoat of ceramic cement is applied on specimen and fired so as to form a thin layer of insulation between gauge grid and specimen. A second layer of ceramic cement is then applied to bond the gauge element.
8.5.3 Strain Cycles
When a strain gauge is subjected to strain cycles, then for the first few cycles, the gauge sensing element is often cold worked and hysteresis and zero shift effects are evident. The cold working induces resistivity changes in the gauge alloy and due to hysteresis, the gauge output deviates from a linear relationship with the applied strain.
The hysteresis and zero shifts reduce to very nominal values if the gauge is cycled five to six times before it is used to record the strain. This strain cycling stabilizes the gauge and improves the accuracy of the strain measuring system to a considerable extent.
After many thousands or millions of cycles, the gauge begins to fail in fatigue and incorrect readings are obtained. In general, foil gauge is more satisfactory than wire type gauges for fatigue applications because foil gauges withstand a large number of cycles before failure. For wire gauges, the point of failure usually is located at the joint between the heavy lead wire and the fine strain sensitive wire. To avoid this failure, gauges with dual leads are employed as shown in Figure 8.9. Failure in the case of a foil gauge is not abrupt. Instead, a crack usually initiates in the foil near the soldered terminal on the tab and slowly propagates across the width of the conductor until the circuit opens.
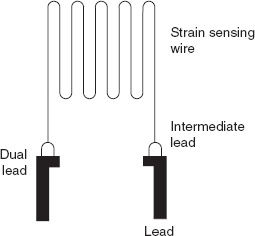
Figure 8.9 Gauge with dual leads
8.5.4 Heat Dissipation
The temperature variation can significantly influence the output of strain gauges, particularly of those which are not temperature compensated. The temperature of the gauge is of course influenced by the ambient temperature variations and by the power dissipated in the gauge in the form of heat when it is connected into a Wheatstone bridge or a Potentiometer circuit. The dissipated heat depends upon voltage applied to the gauge and the gauge resistance.
where |
P = power in Watts, W, |
|
I = gauge current, Amperes, A, |
|
R = gauge resistance, ohms, Ω, and |
|
V = voltage across the gauge in volts. |
There are a number of factors such as gauge size, gauge configuration, material of specimen, type of adhesive, etc. which govern the heat dissipation.
Power densities which can be tolerated by a gauge are strongly related to the specimen which serves as the heat sink. For thin steel sections, power densities 0.0015 to 0.003 W/mm2 are allowable. In other words for a strain gauge of 120 Ω resistance, 10 mm gauge length, the current should be limited to 20–30 mA.
8.5.5 Moisture and Humidity
Moisture is absorbed by both the adhesive and the carrier and the gauge performance is affected in many ways. The moisture decreases the gauge to ground resistance, degrades the strength and rigidity of the bond, and thus reduces the effectiveness of the adhesive. Moreover, the presence of water in the adhesive causes electrolysis when current passes through the gauge and the gauge filament gets eroded. All these factors introduce errors in the measurement of strain. Therefore, it is necessary that strain gauge installation should be moisture proofed. For the general laboratory work, where the readout period is short, a thin layer of microcrystalline wax is sufficient to protect the gauge installation from moisture in air.
For more severe applications, such as exposure of strain gauge to sea water, it is essential to build up a seal of soft wax, synthetic rubber, a thin metal shim, and final coat of rubber as shown in Figure 8.l0.
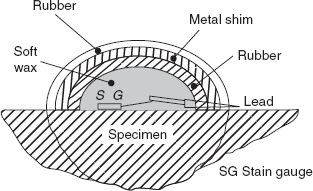
Figure 8.10 Water proofing of strain gauge
8.5.6 Hydrostatic Pressure
In applications like pressure vessels, the normal pressure will produce a small change in resistance of the gauge due to change in resistivity coefficient due to pressure. Gauge geometry can also be influenced; therefore it is preferable that foil type gauges should be employed on the even surface of the pressure vessel. The bubbles in the adhesive cannot be tolerated because the hydrostatic pressure will force the sensing element into any void beneath the gauge and erroneous resistance changes will be recorded.
Dummy gauge required for temperature compensation should not be placed in the pressure vessel but it should be mounted on a small block of the material from which the pressure vessel is fabricated.
By employing non-conducting hydraulic oil as the pressurizing medium, it is possible to avoid the requirement of absolute water proofing of the gauge.
8.5.7 Magnetic Fields
If a strain gauge is installed on or near an electrical equipment producing relatively high magnetic fields then output from the gauge is affected in many ways. When the gauge is in motion it may cut flux lines and current will be generated affecting the gauge output. For example, a strain gauge installed on a structural model, which is being excited in vibration by an electromagnetic field.
Isoelastic alloy is magnetostrictive, i.e. the dimensions of the alloy change in relation to the strength of the magnetic field. If a gauge fabricated from this alloy is employed in proximity to magnetic field, significant errors can result.
8.5.8 Time
Sometimes the readout period of output from a strain gauge is very long, i.e. several months or even years, and the specimens cannot be unloaded to determine the error due to zero drift. During this long readout period, all the factors which can influence the behaviour of the strain gauge get an opportunity to do so and the error developed due to each of the factors can be considerable.
If readout period of the strain gauge is long, following precautions must be taken at the time of gauge installations:
- The advance foil temperature compensated gauges should be used which are most stable gauge.
- The gauge length should be kept as long as possible for better heat dissipation.
- The carrier material can be either Bakelite or epoxy and should not be paper because of its tendency to creep.
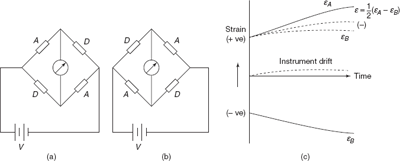
Figure 8.11 (a), (b) Strain gauge in bridge circuit (c) Instrument drift vs time graph
- The strength, rigidity, and creep resistance of the adhesive can be improved by employing about 20 per cent finely chopped fibre-glass in the resin.
- The gauge should be cured by following normal procedure and then subjected to a postcure treatment at 175°F for at least a week.
- The water proofing must be done which will protect the adhesive from any detrimental influence due to water or change in humidity.
To account for the zero drift during the long readout period, the position of the active and dummy gauges should be reversed and reading should be taken in both normal position (A) and reversed position (B) as shown in Figure 8.1l(a) and (b). If the active and dummy gauges are reversed in the electrical circuit and two readings are taken, the instrument drift will add to one and will subtract from the other. The true strain will be given by the mean of the two readings.
During the long readout period, readings should be taken after the thermal equilibrium is established, i.e. to give the gauge current sufficient time to heat both the dummy and active gauges to obtain thermal equilibrium.
8.6 ROSETTE ANALYSES
Electrical resistance strain gauges are employed on the surface of a specimen to establish the state of stress at a particular point. Figure 8.l2 shows the surface of a specimen subjected to strain field εyy, εyy, and γxy/2 and a strain gauge is mounted on the surface at an angle θ with respect to x-axis. The longitudinal strain recorded by the strain gauge will be
The principal strains at the point will be
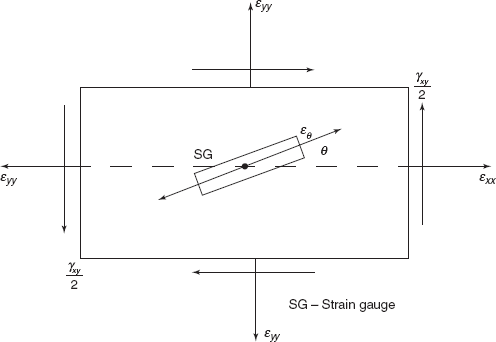
Figure 8.12 Strain field on a single strain gauge
The principal stresses will be
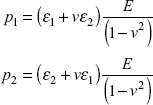
where E = Young’s modulus and v = Poisson’s ratio of the material.
To determine the principal stresses at any point, it is essential that three unknowns εxx, εyy, and gxy should be determined. Therefore if the strains are measured in any three directions, then state of strain will be completely defined at the point.
Following combinations of strain gauges or strain gauge rosettes are used.
- A single strain gauge can be used if the direction of one principal stress is known and the other principal stress is zero as shown in Figure 8.l3.
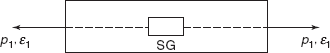
Figure 8.13 Principal stress and strain acting as a strain gauge
- A two-element rectangular rosette as shown in Figure 8.l4(a) is used where directions of both the principal stresses are known and p1 ≠ 0 and p ≠ 0.
Figure 8.14(b) shows a two-element rectangular rosette made from thin foil gauges with theiraxes at right angle.
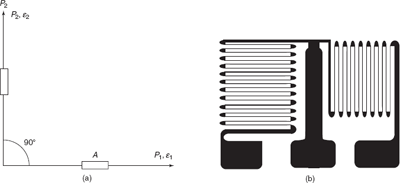
Figure 8.14 (a) Two element rectangular, (b) Two element rectangular rosette
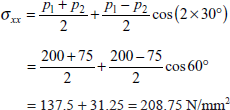
- A three-element rectangular rosette as shown in Figure 8.l5 is employed to completely determine the unknown strain field. The recorded strains in three directions are εA, εB, and εC. Then strains
εxx = εA, εyy = εC, and γxy = 2εB − εA − εC
- A four-element rectangular rosette is employed to verify the accuracy of the rosette analysis. Four-strain gauges are employed at an angular interval of 45° as shown in Figure 8.l6. If the strain readings are εA + εC = εB + εD, then the analysis is accurate.
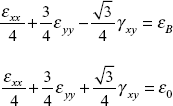
- A three-element delta rosette is shown in Figure 8.l7. Strain readings in directions A, B, and C are
εxx = εA
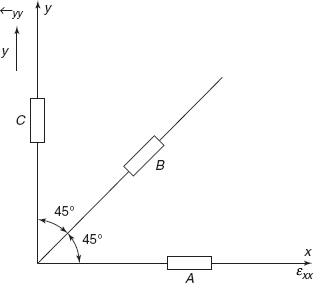
Figure 8.15 Three element rectangular rosette
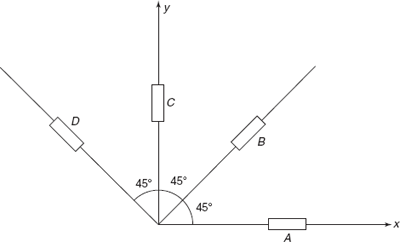
Figure 8.16 Four element rectangular rosette
- A four-element Tee-Delta rosette is used again to check the accuracy of strain measurements. Though three strain gauges are sufficient to completely determine the state of strain at a point, the fourth strain gauge element, as shown in Figure 18., is provided to check the validity of the analysis. Strain readings will give
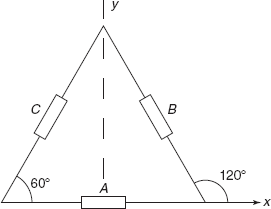
Figure 8.17 Three element delta rosette
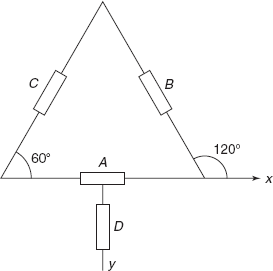
Figure 8.18 Four element delta rosette
Problem 8.1 A two-element rectangular rosette was used to determine the two principal stresses at a point as shown in Figure 8.l9. If the stresses are p1 = 200 N/mm2 and p2 = 75 N/mm2, find the stresses σxx, σyy, and τxy when α = 30°.
Solution: Principal stresses p1 and p2 have been obtained through strain readings along principal directions 1 an 2, stress σxx along x directions which is inclined at α = 30° from direction 1 will be
Stress,
|
σyy |
= |
p1 + p2 − σxx |
|
|
= |
200 + 75 − 280.75 = +66.25 N/mm2 |
Shear stress,
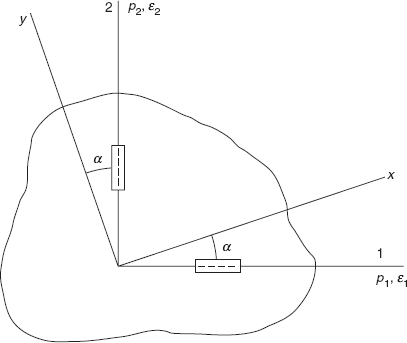
Figure 8.19 Two element rectangular rosette on a specimen
Problem 8.2 The following apparent strains were obtained with two-element rectangular rosette
Determine the true strains εxx and εyy if cross-sensitivity factor K = 0.01. Determine the error which would have occurred if the cross-sensitivity of the gauge had been neglected.
Solution: The expression for true strain in x direction is
where v0 is the Poisson’s ratio of the material on which the gauge is calibrated. In the problem value of v0 is not given, therefore
then
Similarly true strain in y direction, εyy = ε″yy − Kε′xx
True strains,
% Error in the measurement of, εxx
% Error in the measurement of, εyy
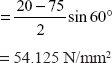
Problem 8.3 The following observations are made with a rectangular rosette mounted on a steel specimen
εA = 800 μm/m
εB = –100 μm/m
εC = –900 μm/m as shown in Figure 8.20.
Determine the principal strains, principal stresses, and principal angles ϕ1 and ϕ2 with respect to x-axis.
For steel E = 200 kN/mm2; v = 0.3
Solution: Strains,
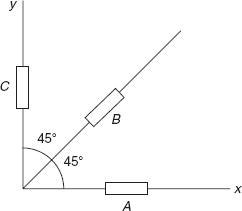
Figure 8.20 Problem 8.3
εxx = εA = 800 μm/m
εyy = εC = –900 μm/m
Principal strains,
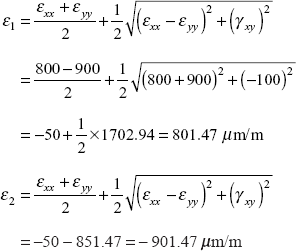
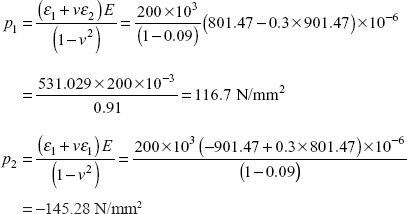
Principal stresses,
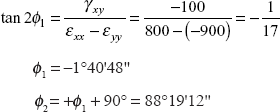
Principal angles,
Problem 8.4 The following observations were made with a delta rosette mounted on an aluminium specimen (see Figure 8.21).
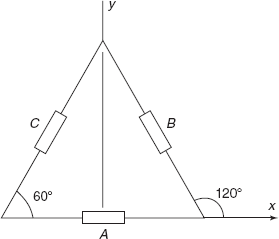
Figure 8.21 Problem 8.4
Determine principal strains, principal stresses, and principal angles if for aluminium E = 680 × 102 N/mm2, v = 0.33.
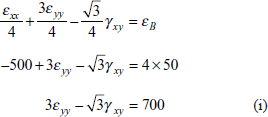
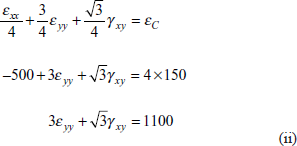
Solution: Strains,
or 200 + 0.75 εyy − 0.433 γxy = 40
or 0.75εyy − 0.433γxy = 200 μm/m
Moreover
or 200 + 0.75εyy + 0.433γxy = 0
0.75εyy + 0.433γxy = −200 μm/m
Adding Eqs (8.1) and (8.2), we get
Thus,
|
0.433 γxy |
= |
−200 |
|
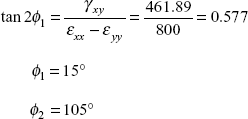
γxy |
= |
461.89 μ m/m |
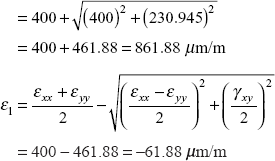
Principal strains

Principal stresses
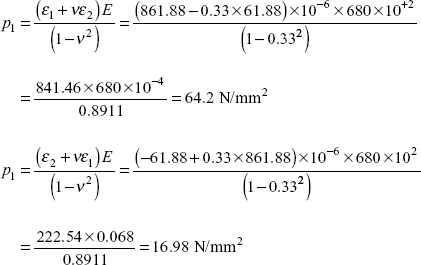
Principal angles
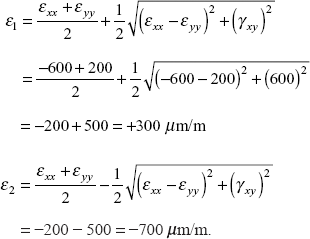
Problem 8.5 Following readings were recorded through a four-element rectangular rosette mounted on an aluminium specimen. If the measurements are accurate, determine principal strains.
(as shown in Figure 8.22).
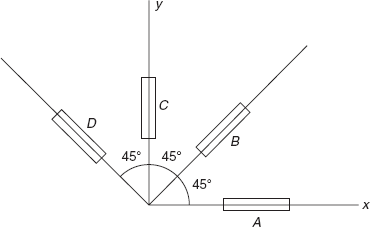
Figure 8.22 Problem 8.5
Solution: In this set of readings, strains
Since εA+εC = εB+εD, the strain measurements are accurate.
Strain components
|
εxx |
= |
εA = −600 μ m/m |
|
εyy |
= |
εC = +200 μ m/m |
|
γxy |
= |
2εB − εA − εC = 2 × 10 − (−600) − 200 = 600 μ m/m |
Principal strains
Problem 8.6 For a Tee-delta rosette, the following data are recorded from the four gauge element. Comment on the validity of the data. (as shown in Figure 8.23).
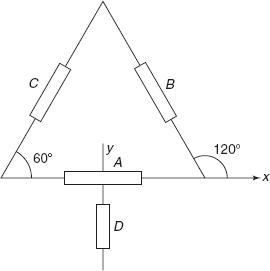
Figure 8.23 Problem 8.6
Solution: εxx = εA = −500 μm/m
The data are valid because strain gauge element at D in the y direction has correctly recorded the strain εyy, i.e. 300 μm/m.
EXERCISES
8.1 A two-element rectangular rosette was used to determine the two principal stresses at a point. If principal stresses are p1 = 120 N/mm2 and p2 = –60 N/mm2, find stresses σxx, σyy, and τxy if α = 20° in Figure 8.24.
Ans. [99 MPa, –39 MPa, –58 MPa].
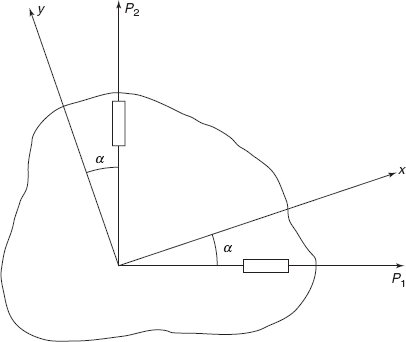
Figure 8.24 Exercise 8.1
8.2 The following apparent strain data were obtained with two-element rectangular rosette
Determine true strains εxx and εyy if K = 0.015. Determine also the error which would have occurred if cross-sensitivity of the gauges had been neglected.
Ans. [1194 μ strain, 382 μ strain, –0.5%, – 4.7%].
8.3 The following observations were made with a rectangular rosette mounted on an aluminium specimen.
Determine the principal strains, the principal stresses.
For aluminium, ε = 68 kN/mm2, v = 0.33.
Ans. [119.7 m strain, –219.7 m strain, 3.6 N/mm2, –137.5 N/mm2].
8.4 The following observations were made with a delta rosette mounted on a steel specimen.
Determine principal strains, principal stresses, and principal angles. For steel E = 210 kN/mm2, v = 0.3.
Ans. [419.433 μ strain, −266.1 μ strain, 266.1 μ strain, 76.97 MPa, −36.45 MPa, 40° 53′33″, 130° 53′33″].
8.5 A four-element rectangular rosette is mounted on an aluminium specimen. The following observations are made
Determine principal strains and principal stresses. For aluminium ε = 68 kN/mm2, v = 0.33.
Ans. [741.55 μ strain, 158.45μ strain, 60.58, 30.76 MPa].
8.6 For a Tee-Delta rosette the following data are recorded from the four gauge elements. Comment on the validity of the data present.
Ans. [Data is valid].
8.7 ELECTRICAL CIRCUITS
The change in resistance ∂R of a strain gauge is proportional to the applied strain ε. In order to determine the strain, the change in resistance ∂R is measured accurately in terms of voltage output ∂ε of an electrical circuit in which gauge is connected. The two most commonly used electrical circuits are (i) Potentiometer circuit and (ii) Wheatstone bridge circuit.
8.7.1 Potentiometer circuit
Figure 8.24 shows the potentiometer circuit in which gauge with resistance Rg is connected in a series with the ballast resistor Rb. A current Ig passes through the gauge as the voltage applied between terminals a and c is V.
Now let us say that resistances Rb and Rg change to Rb + ∂Rb and Rg + ∂Rg, respectively.
Voltage across terminals of the gauge,
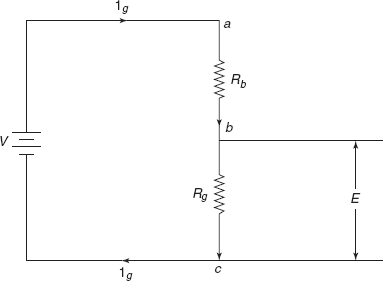
Figure 8.25 Potentiometer circuit
Change in voltage,

neglecting the higher order terms,
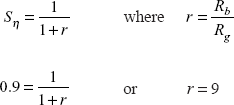
where ![]()
If we take r = 1, i.e. Rb = Rg, then temperature compensation is achieved.
Let us assume that ∂Rg is due to the applied strain ε and ∂Rb = 0, then
Now ![]()
where St = guage fctor
and
So,
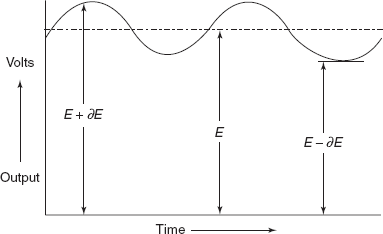
Figure 8.26 Output vs time curve
where ![]()
To achieve maximum circuit efficiency, r should be greater than 1, i.e. Rb ≠ Rg. Then temperature compensation will not be achieved.
Ratio of Rb and Rg is commonly taken as 9, circuit sensitivity is strongly influenced by the factor Sg Ig Rg, which is determined entirely by the selection of the strain gauge.
The output of a strain gauge mounted on a specimen subjected to sinusoidally varying strain field. Normally E is in volts and ∂E in micro volts as shown in Figure 8.26. Unfortunately, voltage measuring instruments are not available with sufficient range and sensitivity to measure ∂E when it is superimposed on E. Therefore to measure ∂E independently it is necessary that E should be blocked from the output. In these applications it is possible to block D.C. voltage E by the use of a special filter. The filter serves to reduce the required range of the measuring instrument. A typical filter used with a potentiometer circuit is shown in Figure 8.27. If the resistance of the measuring instrument Rm is large in comparison to RbRg/(Rb + Rg) then voltage across Rm will be
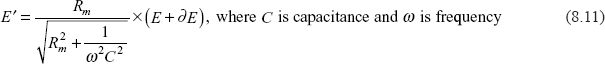
Since the E component of the potentiometer output E + ∂E is constant with time (i.e. w = 0) thus D.C. component of the signal is entirely blocked by the capacitance filter. This circuit is generally used for the measurement of dynamic strain signal.
8.7.2 Wheatstone Bridge Circuit
This circuit is used for the measurement of static as well as dynamic strain signals. Figure 8.28 shows the Wheatstone bridge circuit with four arms with resistances R1, R2, R3, and R4, subjected to input voltage V. Voltage between A and C points
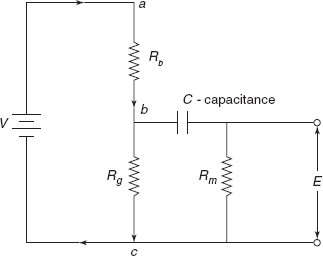
Figure 8.27 Filter in Potentiometer circuit
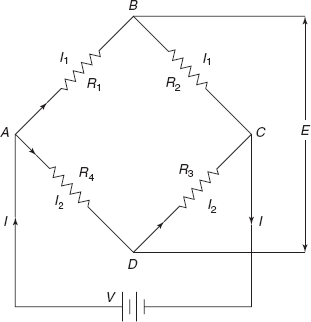
Figure 8.28 Wheatstone bridge circuit
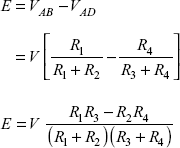
If R1 R3 = R2R4 these output voltage, E = 0, a null balance is achieved. It is this feature of null balance which permits the Wheatstone bridge circuit to be employed for static and dynamic strain measurements both.
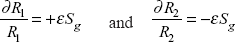
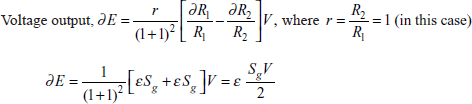
Now let us assume that all resistances change to R1 + ∂R1, R2 + ∂R2, R3 + ∂ R3, and R4 + ∂ R4, respectively, and taking R1 R3 = R2R4, the voltage output will be
Neglecting second order terms
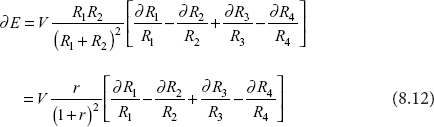
where ratio ![]()
Let us consider
and
then
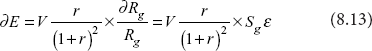
This expression shows that voltage output ∂E is proportional to strain. The voltage output can be calibrated in terms of strain. This type of circuit is known as direct readout circuit.
In static strain measurement it is possible to employ a null-balance bridge, where the resistance of one or more arms in the bridge is changed to match the effect of change in resistance of the strain gauge and the voltage output ∂E becomes zero. Null balance system is more accurate than the direct readout bridge and requires less expensive equipment for its operation.
Figure 8.29 shows a null balance bridge, in which a slide wire resistance or helical potentiometer is placed across the bridge from the point B and D. The centre tap of potentiometer is connected to point C. Strain gauges may be placed in any or all arms of the bridge.
Let us consider a single strain gauge. A voltage measuring instrument with a high sensitivity near the null point is placed between the points B and D. Initial null balance is established, i.e. R1R3 = R2R4 and R5 = R6, and the Galvanometer G reads zero.
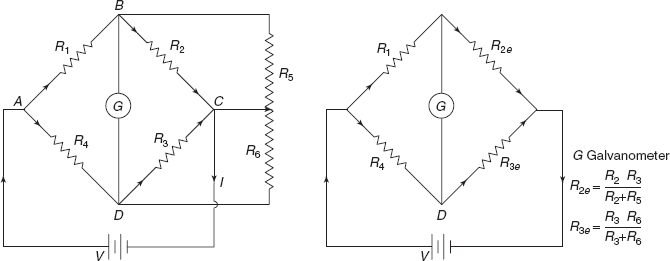
Figure 8.29 Null balance and Initial null balance in bridge circuit
Now the gauge is subjected to strain ε, and R1 changes to R1 + ∂R1. The slide wire or potentiometer is adjusted making R5 ≠ R6 until the bridge is balanced again.
∂R5 = −∂R6 and this potentiometer adjustment is calibrated in terms of the strain to which the strain gauge R1 is subjected. The mechanical movement of the potentiometer serves as the means of readout. For this bridge, expression (6) can be written as
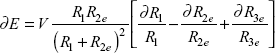
Since
but for null balance bridge,
So,
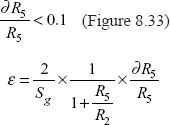
This expression can be simplified if second order terms are neglected
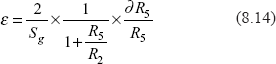
This equation can be used to determine strain directly if (∂R5/R5). < 0.1.
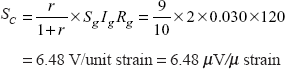
Problem 8.7 For a strain gauge with the following characteristics, calculate Se, V and Rb in a potentiometer circuit.
Solution: Circuit efficiency,
Ballast resistor, Rb = rRg = 9 × 120 = 1080 Ω
Input voltage, V = Ig (Rb + Rg)
where Ig = gauge current = 0.030 amp.
Problem 8.8 A cantilever beam fabricated from a circular rod is employed as a load cell to measure the load P as shown in Figure 8.30. Show that two active strain gauges can be employed in a potentiometer circuit to measure the load P while cancelling out the signal due to twisting moment T.
Solution: If the two gauges R1 and R2 are mounted on the top and bottom of the rod, at a distance of l from the load point P, then
- bending moment M = Pl acts on the gauges in addition to the twisting moment T.
- due to M, gauge R1 will be subjected to tensile strain + ε and gauge R2 will be subjected to compressive strain, –ε. Then
- Due to twisting moment T, there will be shear stress at surface of the rod. Strain gauges do not respond to shear stress.
or
Strain is directly proportional to voltage output ∂E.
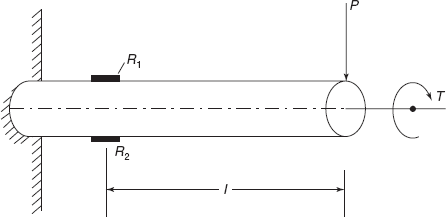
Figure 8.30 Problem 8.8
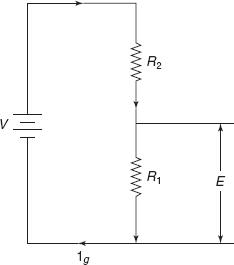
Figure 8.31 Problem 8.8
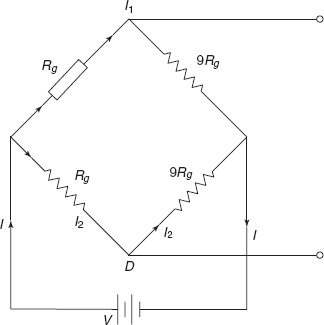
Figure 8.32 Problem 8.9
Problem 8.9 Determine the circuit sensitivity of the bridge shown in Figure 8.32.
|
Rg |
= |
120 Ω |
|
Pg |
= |
0.05 W |
|
Sg |
= |
2.00 |
Solution: In this problem, resistances R1 = R4 and R2 = R3.
Power through the gauge,
Gauge current,
Voltage,
|
V |
= |
I1 (Rg + 9Rg) |
|
|
= |
0.020 × (120 + 9 × 120) = 24 V |
Now,
Circuit sensitivity
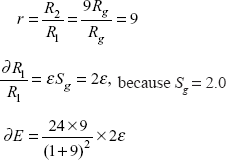
Problem 8.10 Design a parallel balance Wheatstone bridge with the capability of measuring strain in increments of 1 μm/m with a 120 Ω gauge having Sg = 2.0. Determine the range of this instrument.
Solution: For the null balance bridge, strain can be directly measured in terms of ∂R5 if
Say the range of the instrument is ± 2000 μm/m, which is usually the range for a commercial strain indicator.
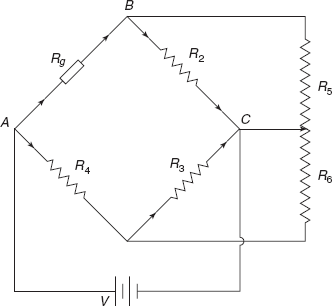
Figure 8.33 Problem 8.10
Then
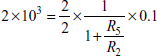
or

Say

To increase circuit sensitivity let us take
∂R5 for 1 μm/m strain
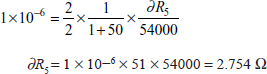
For a step of 1 microstrain, potentiometer is adjusted by 2.754 Ω.
EXERCISE
8.7 For a strain with the following characteristics, compute SC, V, and Rb in a potentiometer circuit.
Circuit efficiency = 80%
Ans. [33.6 μV/μ strain, 105 V, 1400 Ω].
8.8 A cantilever beam fabricated from a circular rod is employed as a torque cell to measure the torque T as shown in Figure 8.34. Show that two active strain gauges can be employed in a potentiometer circuit to measure T while cancelling out the signal due to load P.
Ans. [Two strain gauges at ± 45°; to the neutral axis]
8.9 Determine the circuit sensitivity for the bridge arrangement as shown in Figure 8.35.
Ans. [Ig Sg Rg if R1 and R4 subjected to equal and opposite strains].
8.10 Design a parallel balance Wheatstone bridge circuit with the capability of measuring strains over a range of ± 0.10 per cent with a 120 Ω gauge having Sg = 2.0. Determine the sensitivity of this instrument.
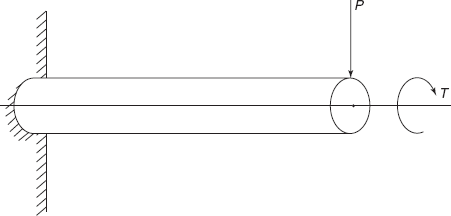
Figure 8.34 Exercise 8.8
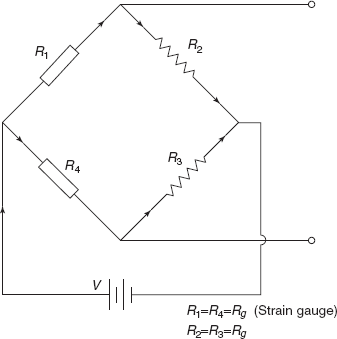
Figure 8.35 Exercise 8.9
8.8 SEMICONDUCTOR STRAIN GAUGES
Electrical resistance strain gauge suffer from several limitations as follows:
- Gauge Factor Is Very Small 2–2.1.
- Initial Resistance Of Gauge Is Very Low 120–1000 Ω.
- Output Signal From The Gauge Is Very Small.
- Error Introduced In The Measurement Of Strain Due To End Loops In Wire Grid Configuration.
Therefore there was necessity of a strain gauge with one single straight element, high initial resistance, and high gauge factor. Semiconductor strain gauge made from Silicon or Germanium elements doped with impurities to provide positive or negative type gauge factor have been developed, in which gauge factor varies from 50 to 175 depending upon the concentration of impurity atoms which varies from 1016 to 1020 atoms/cm3 of crystal. Single crystal of germanium or silicon is grown in the laboratory and a thin filament is cut in a particular crystallographic direction. These elements are piezoresistive and their behaviour is dependent on the direction of the filament used as sensing element in the gauge.
The resistivity ρ of a single crystal semiconductor with impurity concentrations is given by
where |
ρ = resistivity, |
e = electron charge depending upon the type of impurity, |
|
N = number of charge carriers, depending on concentration of impurity atoms, and |
|
μ = mobility of charge carrier, depending on strain and relative direction of strain with respect to crystal axis. |
Strain sensitivity of an alloy is
For metallic conductor, the contribution of ![]() is very small, but for semiconductors the effects of term
is very small, but for semiconductors the effects of term ![]() varies from –125 to +175, depending upon the type and concentration of impurity. So, the gauge factor of semiconductor strain gauge is about 100 times the gauge factor of metallic-alloy strain gauge.
varies from –125 to +175, depending upon the type and concentration of impurity. So, the gauge factor of semiconductor strain gauge is about 100 times the gauge factor of metallic-alloy strain gauge.
Boron is used as a trace impurity in producing P (positive) gauge factor type gauge and Arsenic used to produce N (negative gauge factor) type strain gauge.
Resistivity of P-type silicon gauge is of the order of 500 μΩ.m while resistivity of constantan alloy is only 0.49 μΩ.m. Figure 8.36 shows filament (thin wafer) cut from single crystal of silicon, axis of the filament is in the direction of [111] crystallographic axis.
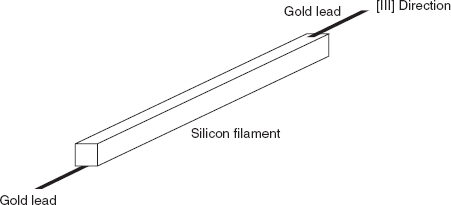
Figure 8.36 Thin water of silicon
The effect of temperature on sensitivity SA and temperature coefficient of resistance are greatly diminished as the concentration impurity atoms increase from 1016 atoms/cm3 to 1020 atoms/cm3. Gold leads are attached at ends to eliminate any corrosion due to environmental attack.
Temperative compensation of a single element P-type semiconductor strain gauge is not possible. Therefore for temperature compensation during read out period another N-type semiconductor strain gauge is used.
Semiconductor strain gauge are usually employed in low-magnitude strain fields because of the advantage of high gauge factor.
There are dual-element gauge, with one P-type and another N-type element available commercially so that they can form one half of a Wheatstone bridge circuit.
8.9 STRESS GAUGE
Configuration of a strain gauge is designed in such a manner that output from the gauge is directly proportional to the stress along the axis in which the gauge is mounted on the specimen. There are two types of stress gauge, i.e. (i) direct stress gauge and (ii) shear stress gauge.
A stress gauge is made with a V-type configuration as shown in Figure 8.37. Gauge is placed along x-axis, at an unknown angle θ from the axis of principal stress p1. There are two parts of the grid, i.e. top and bottom grid..
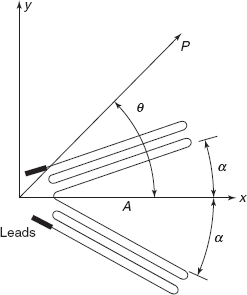
Figure 8.37 Stress gauge
Strain along top grid
strain along the lower grid
Adding the two expressions
From the Mohr’s strain circle
|
εxx + εyy |
= |
ε1 + ε2 |
|
εyy − εyy |
= |
+ (ε1 − ε2) cos 2 θ |
Putting these values
εθ − α + εθ − α |
= |
εxx + εyy + (εxx − εyy) cos 2α |
|
= |
εxx + εyy + (εyy − εyy) (cos2 α − sin2 α) |
|
= |
2(εxx cos2 1 + εyy sin2 α) |
|
= |
2cos2 α [εxx + εyy tan2 α] |
If the gauge is made with
where v is Poisson’s ratio.
Then
But
when E is Young’s modulus.
Putting the value of εxx + vεyy, we get
or
So, the gauge reading gives ![]() and multiplied by
and multiplied by![]() gives the value of direct stress σxx.
gives the value of direct stress σxx.
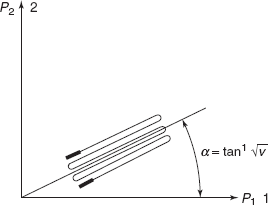
Figure 8.38 Single element stress gauge
If the principal directions are known then a single gauge mounted at angle ![]() with respect to axis of, p1, gives the reading which is proportional to principal stress p1 as shown in Figure 8.38.
with respect to axis of, p1, gives the reading which is proportional to principal stress p1 as shown in Figure 8.38.
Plane Shear Gauge
Consider two strain gauge A and B, mounted at ± 45°; to axis x, shown in Figure 8.39.
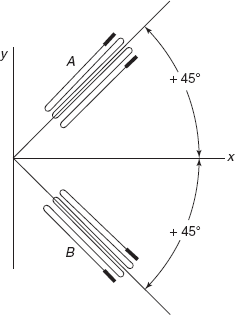
Figure 8.39 Plane shear gauge
strains,
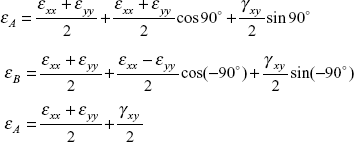
or
Shear strain is proportional to the difference of strain readings, i.e. εA − εB. This shows that shear strain can be measured by the differences of readings from two-element rectangular rosette shear stress τxy = γxy⋅G. (shear modulus)
MULTIPLE CHOICE QUESTIONS
- What is the diameter of strain sensing wire in a wire grid gauge?
- 0.025 mm
- 0.08 mm
- 0.15 mm
- None of these
- Which one of the following metallic alloy possesses maximum strain sensitivity
- Constantan
- Isoelastic
- Karma
- All have equal strain sensitivity
- Which of the following adhesive takes minimum time for setting
- Cellulose nitrate
- Phenolic
- Epoxy
- Cynocrylate
- If ε1, ε2 are principal strains, E and v are elastic constants, what is the value of principal stress p1?


- None of these
- Recorded apparent strains are εxx = –200μ strains, εyy = +700 μ strain, if K = 0.01, cross- sensitivity factor, what is the value of true strain ε′xx?
- –207 μ strain
- –193 μ strain
- –202 μ strain
- None of these
- Observation made in three directions from a three-element rectangular rosette are εA = +800 μ cm/cm εB = –400 μ cm/cm, and εC= –860 μ cm/cm. Direction A is along x-axis. What is the strain εyy?
- 800 μ cm/cm
- –400 μ cm/cm
- –860 μ cm/cm
- None of these
- In a potentiometer circuit, ratio of ballast resistor and strain gauge resistance is 9, what is circuit efficiency?
- 90%
- 80%
- 75%
- None of these
- Power through the gauge is 0.05 W, its gauge resistance is 120 Ω, what is the gauge current?
- 0.024 amp
- 0.020 amp
- 0.0004 amp
- None of these
- Poisson’s ratio of a specimen is 0.3. What is the direction of orientation of top and bottom grid along axis of gauge?
- 17°
- 130°
- 29°
- None of these
- What is the angle of mounting two strain gauge elements about x-axis, if plane shear gauge is to be Obtained?
- ±22.5°
- ±30°
- ±45°
- None of these
Answers
1. (a) |
2. (b) |
3. (d) |
4. (b) |
5. (a) |
6. (c) |
7. (a) |
8. (b) |
9. (c) |
10. (c). |
PRACTICE PROBLEMS
8.1 Enumerate the optimum characteristics of a strain gauge.
8.2 What is the effect of end loop on the sensitivity of a strain gauge.
8.3 Compare the merits and demerits of Advance alloy and isoelastic alloy as strain sensing element.
8.4 What is a thin foil gauge? What are its advantages over wire grid gauge? How cross-sensitivity factor is reduced in thin foil gauge.
8.5 What is a dual element temperature compensated strain gauge?
8.6 What are the adhesives used to install strain gauge on a sample? Which is the most appropriate adhesive?
8.7 Discuss the effect of following parameters on the behaviour of electrical resistance strain gauge
- Strain cycles
- Moisture and humidity
- Hydrostatic pressure
- Magnetic field
8.8 What is zero drift? How it is accounted for?
8.9 Why readings in three directions at a point are necessary to determine the strain field completely?
8.10 What are four element rectangular rosette and four element T-delta rosette? What is the advantage of extra strain gauge element?
8.11 What is cross-sensitivity factor? How it is accounted for in strain readings?
8.12 Compare the merits and demerits of Wheatstone bridge circuit over potentiometer circuit.
8.13 Derive expression for circuit sensitivity of potentiometer circuit.
8.14 What is a semiconductor strain gauge? What are its merits over electrical resistance wire grid gauge?
8.15 What is a stress gauge? How single gauge can be used a stress gauge? By what arrangement we get a plane shear stress gauge?