
CHAPTER 10
![]()
Numeric Programming and Charting
In Chapters 8 and 9, you learned constructs and techniques for programming with three important kinds of data in F#: textual data, sequences of data, and structured data. In this chapter, we return to constructs and techniques for one of the most important kinds of data in all programming systems: numeric data.
Programming with numbers is a huge topic, ultimately overlapping with many fields of mathematics, statistics, and computer science, and highly related to applied science, engineering, economics, and finance. In this chapter, you learn about:
- Programming with additional basic numeric types and literals beyond simple “integers” and “floating point” numbers already covered in Chapter 3
- Using library and hand-coded routines for summing, aggregating, maximizing, and minimizing sequences
- Some simple algorithmic programming with F#, implementing the KMeans clustering algorithm and applying it to some input data
- Some charting with F#, using the FSharpChart library
- Using the Math.NET library for statistics, distributions, and linear algebra
- Using the unique F# feature units of measure for giving strong types to numeric data
This chapter makes extensive reference to the Math.NET open-source math library. You can find out more about Math.NET at http://www.mathdotnet.com/.
Basic Charting with FSharpChart
Your primary focus in this chapter is on numeric programming itself. A very common activity associated with working with numbers is charting. You will now explore some basic charting using the FSharpChart charting library, available by searching for “FSharpChart” on the Web.
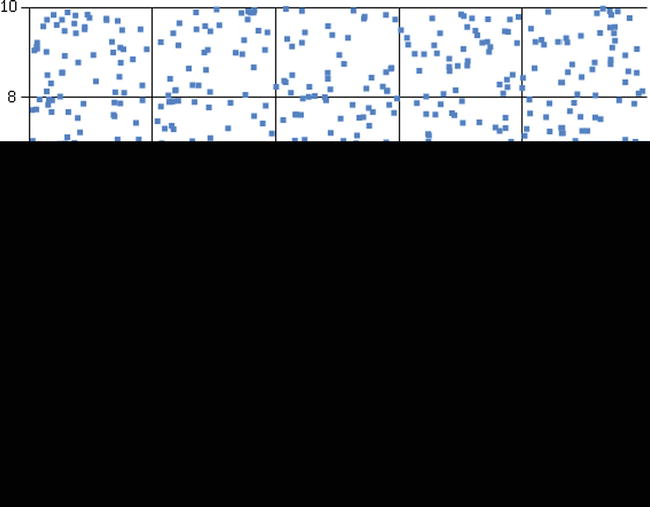
FSharpChart is very easy to get going with. For example, consider creating 1,000 random points and plotting them:
#load "FSharpChart.fsx"

open MSDN.FSharp.Charting


let rnd = System.Random()

let rand() = rnd.NextDouble()


let randomPoints = [for i in 0 .. 1000 -> 10.0 * rand(), 10.0 * rand()]


randomPoints |> FSharpChart.Point
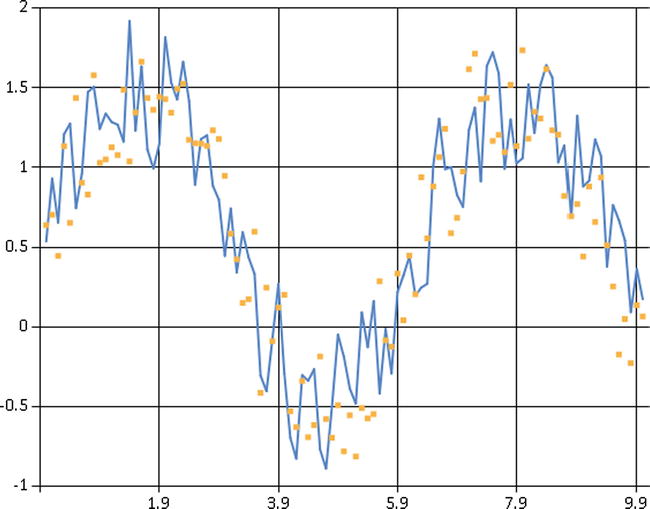
Likewise, consider two sinusoidal data sets with some random noise added.
let randomTrend1 = [for i in 0.0 .. 0.1 .. 10.0 -> i, sin i + rand()]

let randomTrend2 = [for i in 0.0 .. 0.1 .. 10.0 -> i, sin i + rand()]
You can combine two charts – the first data set as a line, and the second as a set of points – as follows:
type Chart = FSharpChart

Chart.Combine [Chart.Line randomTrend1; Chart.Point randomTrend2]
Giving:
Many other chart types and options are available for use with FSharpChart. For example, you can add a title to your chart:
Chart.Line (randomPoints,Title="Expected Trend")
Charting is often used with pipelining, so attributes like this are often specified using “|> fun c -> “ as follows:
randomPoints

    |> fun c -> Chart.Line (c,Title="Expected Trend")
Basic Numeric Types and Literals
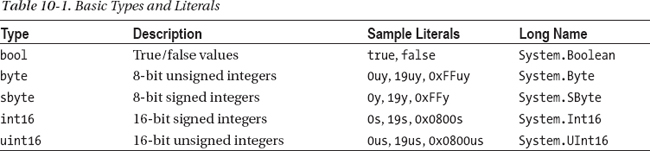
We first cover the most common base types of data manipulated in F# code, beginning with the basics of F# arithmetic. Table 10-1 lists the basic numeric types used in F# code and their corresponding literal forms. The table also lists the non-numeric types bool and unit.
Arithmetic Operators
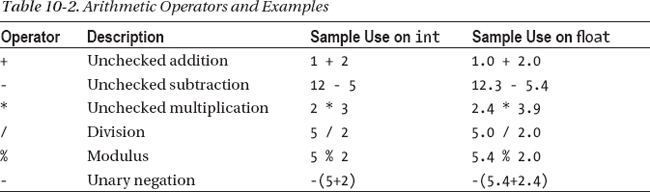
Table 10-2 lists the most commonly used arithmetic operators. These are overloaded to work with all the numeric types listed in Table 10-1.
Checked Arithmetic
The behavior of these and other operators can be extended for user-defined types, a topic covered in Chapter 6. In F#, addition, subtraction, and multiplication over integers are unchecked; that is, if overflow or underflow occur beyond the representable range, wraparound occurs. For example, 2147483647 is the largest representable 32-bit integer of the int type:
> 2147483647 + 1;;


val it : int = -2147483648
You can access checked versions of arithmetic operators that raise System.OverflowException exceptions by opening the Microsoft.FSharp.Core.Operators.Checked module. If avoiding overflow is a priority, using the decimal, bigint, and bignum types is recommended. Division by zero raises a System.DivideByZeroException exception, except in the case of floating-point numbers, in which it returns one of the special floating-point numbers Infinity, -Infinity and NaN. Operator overloading interacts with type inference—if a use of an overloaded operator isn’t otherwise constrained to work on a particular type, F# assumes it works on 32-bit integers.
Arithmetic Conversions
Numeric types aren’t implicitly converted—conversions among different numeric types must be made explicitly. You do this by using overloaded conversion operators. These work the same way as overloaded infix operators such as + and *. Table 10-3 shows the primary conversion operators.
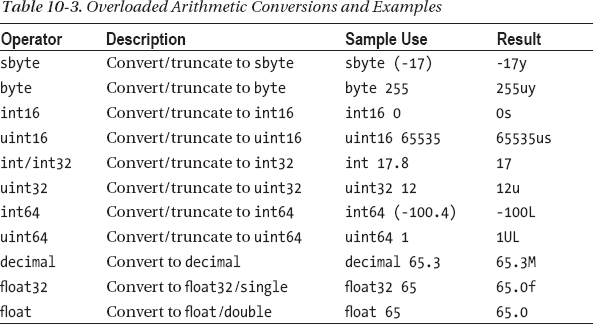
These conversions are all unchecked in the sense that they won’t raise exceptions. Again, the Microsoft.FSharp.Core.Operators.Checked module has corresponding definitions of these operators. An alternative is to use the library static methods contained in the type System.Convert, such as System.Convert.ToDouble( ). These do perform checking, which means they raise an exception if the source number can’t be represented within the numeric range of the target type. As with many object-oriented library constructs, uses of System.Convert methods may require type annotations to resolve overloading, which is discussed in Chapters 5 and 6.
Arithmetic Comparisons
When used with numeric values, the binary comparison operators =, <>, <, <=, >, >=, min, and max perform comparisons according to the natural ordering for each particular numeric type. You can also use these operators on other data types, such as to compare lists of integers, and you can customize their behavior for new types you define. Chapter 5 discusses generic comparison in detail, and Chapter 8 discusses customizing generic comparison.
When used with floating-point values, these operators implement the IEEE semantics for NaN (Not a Number) values. For example, (NaN = NaN) is false, as are (NaN <= NaN) and (NaN < NaN).
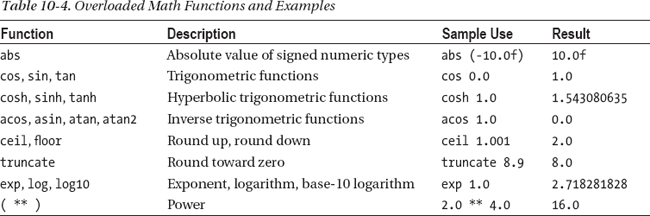
Overloaded Math Functions
The module Microsoft.FSharp.Core.Operators includes the definition of a number of useful overloaded math operators. These are shown in Table 10-4 and are overloaded either on a suitable range of integer types or on the basic floating-point types.
Bitwise Operations
All the integer types listed in Table 10-1 support bitwise manipulations on their underlying representations. Table 10-5 shows the bitwise manipulation operators.

The following sample shows how to use these operators to encode 32-bit integers into 1, 2, or 5 bytes, represented by returning a list of integers. Integers in the range 0 to 127 return a list of length 1:
let encode (n : int32) =

    if (n >= 0 && n <= 0x7F) then [n]

    elif (n >= 0x80 && n <= 0x3FFF) then

        [(0x80 ||| (n >>> 8)) &&& 0xFF;

         (n &&& 0xFF)]

    else  [0xC0;

           ((n >>> 24) &&& 0xFF);

           ((n >>> 16) &&& 0xFF);

           ((n >>> 8) &&& 0xFF);

           (n &&& 0xFF)]
Here’s an example of the function in action:
> encode 32;;


val it : int32 list = [32]


> encode 320;;


val it : int32 list = [129; 64]


> encode 32000;;


val it : int32 list = [192; 0; 0; 125; 0]
Sequences, Statistics and Numeric Code
Some of the most common and simplest numerical programming techniques with F# involves taking aggregate statistics over sequences of objects. In this section, you learn how to use the built-in aggregation operators, such as Seq.sum and Seq.averageBy. Further, you look at how to define additional functions with similar characteristics. In later sections, you learn how to use functionality from the Math.NET library to perform more advanced statistical analysis of sequences of numbers.
Summing, Averaging, Maximizing and Minimizing Sequences
The table below shows how to compute the average, sum, maximum, and minimums over input sequences using operations from the Seq module to process the data.
  data |> Seq.average

  data |> Seq.sum

  data |> Seq.max

  data |> Seq.min

  data |> Seq.averageBy (fun x -> proj)

  data |> Seq.sumBy (fun x -> proj)

  data |> Seq.maxBy (fun x -> proj)

  data |> Seq.minBy (fun x -> proj)
For example, consider taking the average, sum, maximum, and minimum of a set of 1,000 numbers between 0 and 1, each generating by multiplying two random numbers drawn from a random-number generator.
let rnd = new System.Random()

let rand() = rnd.NextDouble()

let data = [for i in 1 .. 1000 -> rand() * rand()]


let averageOfData = data |> Seq.average

let sumOfData = data |> Seq.sum

let maxOfData = data |> Seq.max

let minOfData = data |> Seq.min
The results are:
// Random numbers, results may differ!

val averageOfData : float = 0.2365092084

val sumOfData : float = 236.5092084

val maxOfData : float = 0.9457838635

val minOfData : float = 6.153537535e-05
As expected, the average of the sequence lies near 0.25.
Normally, however, statistics are generated by projecting information from particular objects using operators such as Seq.sumBy. For example, consider taking the average X, Y, and Z positions of a random set of 1,000 points drawn in three dimensions:
type RandomPoint = {X : float; Y : float; Z : float}


let random3Dpoints =

    [for i in 1 .. 1000 -> {X = rand(); Y = rand(); Z = rand()}]


let averageX = random3Dpoints |> Seq.averageBy (fun p -> p.X)

let averageY = random3Dpoints |> Seq.averageBy (fun p -> p.Y)

let averageZ = random3Dpoints |> Seq.averageBy (fun p -> p.Z)
As expected, the results center around 0.5:
// Random numbers, results may differ!

val averageX : float = 0.4910144491

val averageY : float = 0.5001688922

val averageZ : float = 0.5170302648
Likewise, you can use Seq.maxBy to determine the element where a maximum occurs for a particular measure:
let maxY = random3Dpoints |> Seq.maxBy (fun p -> p.Y)
This operator returns the object that corresponds to the maximum:
// Random numbers, results may differ!

val maxY : RandomPoint = {X = 0.9829979292;

                          Y = 0.9997189497;

                          Z = 0.4552816481;}
Likewise, you can use minimize and maximize by other measures. For example, consider finding the point that minimizes the distance from the origin to the point:
let norm (p : RandomPoint) = sqrt (p.X * p.X + p.Y * p.Y + p.Z * p.Z)

let closest = random3Dpoints |> Seq.minBy (fun p -> norm p)
As expected, the point has relatively low values for all of X, Y, and Z:
// Random numbers, results may differ!

val norm : p:RandomPoint -> float

val closest : RandomPoint = {X = 0.05287901873;

                             Y = 0.0570056001;

                             Z = 0.1018355787;}
Note that Seq.maxBy and Seq.minBy return the input object that maximizes/minimizes the function respectively—that is, they return the input object and not the maximum/minimum value. Some other similar operations in the F# libraries and .NET framework return the value itself—the type signature of the operation allows you to tell the difference.
![]() Note Sums, averages, maximums, and minimums can also be computed by using F# 3.0 query expressions, discussed in Chapter 13. For example, you can compute an average by using an expression such as
Note Sums, averages, maximums, and minimums can also be computed by using F# 3.0 query expressions, discussed in Chapter 13. For example, you can compute an average by using an expression such as query { for x in data do averageBy p.X }. The advantage of this approach is that, for some external data sources such as databases, the queries and aggregation can be executed on the remote server. As we shall see in Chapter 13, this depends on how data has been defined. While queries can be used over sequences and other in-memory data, for most in-memory processing, you should just use operations such as Seq.averageBy to process the data.
Counting and Categorizing
A common statistical operation is categorizing elements according to some key (grouping, as discussed in Chapter 9) and counting the number of elements in each group. This corresponds to building a histogram for the data based on a selection function.
The simplest way to generate a histogram for in-memory data is to use Seq.countBy, which returns a sequence of key/count pairs. For example, consider the random3Dpoints you generated in the previous section. These can be categorized into 10 quantiles depending on how far they are from the origin. The maximum distance a point can be away from the origin is √3, so we multiply by 10, divide by √3, and round down to the nearest integer to compute the bucket a point belongs to:
let histogram =

    random3Dpoints

    |> Seq.countBy (fun p -> int (norm p * 10.0 / sqrt 3.0) )

    |> Seq.sortBy fst

    |> Seq.toList
The results reveal a concentration of points at distance 0.6 * √3 = 1.03.
// Random numbers, results may differ!

val closest : (int * int) list =

  [(0, 1); (1, 15); (2, 52); (3, 97); (4, 173); (5, 233); (6, 256); (7, 116);

   (8, 52); (9, 5)]
Note that you usually have to sort the counted results by the key and convert the overall results to a concrete data structure, such as a list, array, map, or dictionary.
![]() Note The Math.NET library includes the type
Note The Math.NET library includes the type Statistics.Histogram for incrementally computing histograms from numerical input sets. You use this type later in this chapter.
Writing Fresh Numeric Code
If you are writing a lot of numeric code, you will almost certainly want to use one of the standard math and statistical packages that can be used with F# programming, such as Math.NET, described later in this chapter. It is often necessary, however, to define new statistical computations in F# to extend the basic set of operations that are available for routine use.
As an example of this, consider defining the variance and standard deviation of a sequence of numbers. These are simple computations based on taking the average of a sequence and then the average of the sum-of-squares of variations from the average.
First, the simplest form of the operation simply computes the variance over an input array of floating-point numbers:
/// Compute the variance of an array of inputs
let variance (values : float[]) =

    let sqr x = x * x

    let avg = values |> Array.average

    let sigma2 = values |> Array.averageBy (fun x -> sqr (x - avg))

    sigma2


let standardDeviation values =

    sqrt (variance values)
These operations have types:
val variance : values:float [] -> float

val standardDeviation : values:float [] -> float
You can apply the functions to sequences of data. For example:
let sampleTimes = [|for x in 0 .. 1000 -> 50.0 + 10.0 * rand()|]


let exampleDeviation = standardDeviation  sampleTimes

let exampleVariance = variance sampleTimes
Giving results:
val exampleDeviation : float = 2.865331753

val exampleVariance : float = 8.210126054
In some circumstances, it may make sense to define projection “By” versions of these operations, and further, it may make sense to place the operations in a utility module called “Seq”, “Array” or “List”, depending on the kind of input data accepted by the routine:
module Seq =

    /// Compute the variance of the given statistic from from the input data

    let varianceBy (f : 'T -> float) values =

        let sqr x = x * x

        let xs = values |> Seq.map f |> Seq.toArray

        let avg = xs |> Array.average

        let res = xs |> Array.averageBy (fun x -> sqr (x - avg))

        res

    /// Compute the standard deviation of the given statistic drawn from the input data

    let standardDeviationBy f values =

        sqrt (varianceBy f values)
![]() Note The Math.NET library includes the functions
Note The Math.NET library includes the functions Statistics.StandardDeviation, Statistics.Variance, Statistics.Mean, Statistics.Maximum, Statistics.Minimum, and Statistics.DescriptiveStatistics for computing basic statistics from sequences of floating-point numbers.
Making Numeric Code Generic
It is often sufficient to define statistical functions over base types, such as floating-point numbers. If necessary, this code can be made either unitized or generic. You have already seen generic numeric algorithms in Chapter 5. You can make the code for variance and standardDeviation generic, because the underlying operations Array.average and Array.averageBy are themselves generic. For example:
let inline variance values =

    let sqr x = x * x

    let avg = values |> Array.average

    let sigma2 = values |> Array.averageBy (fun x -> sqr (x - avg))

    sigma2


let inline standardDeviation values =

    sqrt (variance values)
This code can now be used with any numeric types. The downside is that a complex relationship is asserted between the input and output types:
val inline variance :

  values: ^a [] ->  ^c

    when  ^a : (static member ( + ) :  ^a *  ^a ->  ^a) and

          ^a : (static member DivideByInt :  ^a * int ->  ^a) and

          ^a : (static member get_Zero : ->  ^a) and

          ^a : (static member ( - ) :  ^a *  ^a ->  ^b) and

          ^b : (static member ( * ) :  ^b *  ^b ->  ^c) and

          ^c : (static member ( + ) :  ^c *  ^c ->  ^c) and

          ^c : (static member DivideByInt :  ^c * int ->  ^c) and

          ^c : (static member get_Zero : ->  ^c)

val inline standardDeviation :

  values: ^a [] ->  ^d

    when  ^a : (static member ( + ) :  ^a *  ^a ->  ^a) and

          ^a : (static member DivideByInt :  ^a * int ->  ^a) and

          ^a : (static member get_Zero : ->  ^a) and

          ^a : (static member ( - ) :  ^a *  ^a ->  ^b) and

          ^b : (static member ( * ) :  ^b *  ^b ->  ^c) and

          ^c : (static member ( + ) :  ^c *  ^c ->  ^c) and

          ^c : (static member DivideByInt :  ^c * int ->  ^c) and

          ^c : (static member get_Zero : ->  ^c) and

          ^c : (static member Sqrt :  ^c ->  ^d)
This cost can sometimes be worth it, as the operation is very general—it can be used on decimals, floating-point numbers, and unitized versions of these. Further, the code produced is also usually as efficient as can be without writing a highly case-specific optimized routine.
Example: KMeans
As an example, in Listing 10-1, we use one simple machine-learning algorithm, called KMeans Clustering. This algorithm accepts a set of inputs, each with a vector of numbers representing features. For example, each input may represent an observed object, such as a flower or animal in a biology field experiment, and the features may represent a set of observed measurements of that object.
The algorithm proceeds by clustering the data around a fixed number of centroids in the feature space. Each object is assigned to the “nearest” centroid according to a distance function. Once the groups are determined, new centers are then computed, and the process is repeated.
In this implementation of the algorithm, we keep a reference to the original data, of some type T, and assume a function is given that extracts the actual feature vectors from the parameters.
Listing 10-1. KMeans Clustering Algorithm
type Input<'T> = {Data : 'T; Features : float[]}

type Centroid = float[]


module Array =

    /// Like Seq.groupBy, but returns arrays

    let classifyBy f (xs : _[]) =

         xs |> Seq.groupBy f |> Seq.map (fun (k, v) -> (k, Seq.toArray v)) |> Seq.toArray


module Seq =

    /// Return x, f(x), f(f(x)), f(f(f(x))), ...

    let iterate f x = x |> Seq.unfold (fun x -> Some (x, f x))


/// Compute the norm distance between an input and a centroid

let distance (xs : Input<_>) (ys : Centroid) =

    (xs.Features,ys)

        ||> Array.map2 (fun x y -> (x - y) * (x - y))

        |> Array.sum


/// Find the average of set of inputs. First compute xs1 + ... + xsN, pointwise,

/// then divide each element of the sum by the number of inputs.

let computeCentroidOfGroup (_, group : Input<_>[]) =

    let e0 = group.[0].Features

    [|for i in 0 .. e0.Length - 1 -> group |> Array.averageBy (fun e -> e.Features.[i])|]


/// Group all the inputs by the nearest centroid

let classifyIntoGroups inputs centroids =

    inputs |> Array.classifyBy (fun v -> centroids |> Array.minBy (distance v))


/// Repeatedly classify the inputs, starting with the initial centroids

let rec computeCentroids inputs centroids = seq {

    let classification = classifyIntoGroups inputs centroids

    yield classification
    let newCentroids = Array.map computeCentroidOfGroup classification

    yield! computeCentroids inputs newCentroids}


/// Extract the features and repeatedly classify the inputs, starting with the

/// initial centroids

let kmeans inputs featureExtractor initialCentroids =

    let inputs =

        inputs

        |> Seq.map (fun i -> {Data = i; Features = featureExtractor i})

        |> Seq.toArray

    let initialCentroids = initialCentroids |> Seq.toArray

    computeCentroids inputs initialCentroids
We now generate a synthetic input data set that features four clusters of data:
open Microsoft.FSharp.Data.UnitSystems.SI.UnitSymbols


type Observation = {Time : float<s>; Location : float<m>}


let rnd = System.Random()

let rand() = rnd.NextDouble()

let randZ() = rnd.NextDouble() - 0.5


/// Create a point near the given point

let near p = {Time= p.Time + randZ() * 20.0<s>;

              Location = p.Location + randZ() * 5.0<m>}


let data =

    [for i in 1 .. 1000 -> near {Time= 100.0<s>; Location = 60.0<m>}

     for i in 1 .. 1000 -> near {Time= 120.0<s>; Location = 80.0<m>}

     for i in 1 .. 1000 -> near {Time= 180.0<s>; Location = 30.0<m>}

     for i in 1 .. 1000 -> near {Time= 70.0<s>; Location = 40.0<m>}]
The algorithm is run by extracting two features from the data into a normalized (0,1) range and choosing 10 initial centroids at random in this two-dimensional feature space.
We discard the classifications of the points to the centroids and simply report the centroids that have been found, renormalized into the original input space:
let maxTime = data |> Seq.maxBy (fun p -> p.Time) |> fun p -> p.Time

let maxLoc = data |> Seq.maxBy (fun p -> p.Location) |> fun p -> p.Location


let initialCentroids = [for i in 0 .. 9 -> [|rand(); rand()|]]

let featureExtractor (p : Observation) = [|p.Time / maxTime; p.Location / maxLoc|]


kmeans data featureExtractor initialCentroids
This gives an infinite sequence of centroid/classification groups representing repeated iterations of the algorithm. We discard the classifications and simply report the centroids that have been found, taking only the 100th iteration of the algorithm, and renormalize the centroids into the original input space:
kmeans data featureExtractor initialCentroids
   |> Seq.map (Array.map (fun (c, _) -> c.[0] * maxTime, c.[1] * maxLoc))

   |> Seq.nth 100
This gives the resulting centroids. For example, on one sample execution, the discovered centroids for the 100th iteration are:
> val it : (float<s> * float<m>) [] =

  [|(95.21297664, 59.92134092); (105.128182, 60.03017317);

    (120.0522592, 79.99954457); (179.7447501, 29.96446713);

    (65.97080136, 38.75120135); (75.63604991, 40.05351476);

    (64.8228706, 41.26265782)|]
The algorithm has determined seven centroids—those that no classify no points are discarded—and each of these correspond to one of the four original centroids—(100,60), (120,80), (180,30), (70,40)—used in the random generation of the data. (Several discovered centroids correspond to one original centroid; thus, the data are “over-fitted.” The over-fitting of the centroid model to the data is characteristic of naïve clustering algorithms. The use of more advanced statistical methods can avoid this.)
Statistics, Linear Algebra and Distributions with Math.NET
In this chapter so far, you have seen how to use F# language and library constructs to implement a variety of numerical programming tasks “from scratch.” This is commonly done when using F# for writing simulators or doing basic data scripting, charting, and reporting.
For even moderately advanced math and numeric programming, however, you will want to make use of an existing F# or .NET math library. Several high-quality .NET libraries are available, and more are appearing all the time. Also, math and statistics libraries tend to have different characteristics:
- Some libraries use C/C++ code “under the hood.” For example, many managed .NET libraries use the Intel MKL library or an equivalent.
- Some libraries also have an “all managed” mode, meaning that most or all of the functionality in the library is authored in C# and F#. This means, for example, that math libraries can be highly portable and used across a number of situations in which .NET code is accepted.
- Some libraries implement optimizations such as “GPU” execution, allowing some or all of the routines to execute on a graphics processor.
- The libraries differ by license and availability. Some are open source, and some are commercial.
- Some libraries are designed for use from C# or F# but also have an F#-specific wrapper.
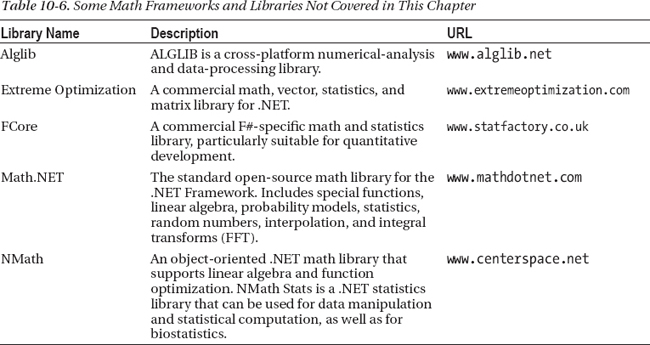
A detailed overview of math library choices for F# can also be found on the Microsoft MSDN pages at http://msdn.microsoft.com/en-us/library/hh304368.aspx. People often ask us which libraries we recommend. Table 10-6 shows some of the frameworks and libraries available at the time of writing that may interest you.
Basic Statistical Functions in Math.NET Numerics
In the rest of this book, we use the open-source library Math.NET Numerics. The preferred open-source math library for use with F# is called Math.NET Numerics, which is part of a larger project called Math.NET, an umbrella project for open-source math libraries on the .NET and Mono Frameworks. Math.NET Numerics includes:
- Types representing dense as well sparse vectors and matrices
- A library containing a full set of standard linear-algebra routines
- A range of random-number generators with different strengths
- Additional features that include support for certain numerical integration and statistical functions.
Math.NET Numerics is available for use as a pure-managed library, but it also includes wrappers for highly optimized native math libraries, such as Intel MKL and AMD ACML. This library is available under a broad open-source license, and it is available as a NuGET package. To install the library, either add it as a NuGET package to an existing project or install it directly from www.mathdotnet.com.
From an F# script in the root folder of a project with version 2.1.2 of MathNet.Numerics.FSharp installed as a NuGET package, the references can be added with relative paths.
#r @".packagesMathNet.Numerics.2.1.2libNet40MathNet.Numerics.dll"
#r @".packagesMathNet.Numerics.FSharp.2.1.2libNet40MathNet.Numerics.FSharp.dll"

#r @".packageszlib.net.1.0.4.0libzlib.net.dll"
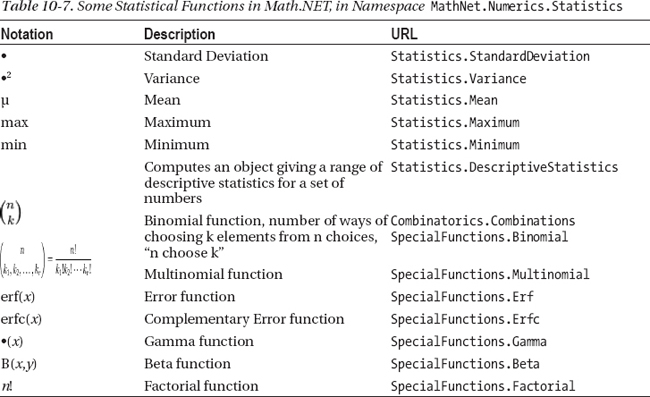
Some basic statistical functions in Math.NET are shown in Table 10-7. We can use the functions in the expected way:
open MathNet.Numerics.Statistics


let data = [for i in 0.0 .. 0.01 .. 10.0 -> sin i]


let exampleVariance = data |> Statistics.Variance

let exampleMean = data |> Statistics.Mean

let exampleMin = data |> Statistics.Minimum

let exampleMax = data |> Statistics.Maximum
Giving:
val exampleVariance : float = 0.443637494

val exampleMean : float = 0.1834501596

val exampleMin : float = -0.9999971464

val exampleMax : float = 0.9999996829
Using Histograms and Distributions from Math.NET Numerics
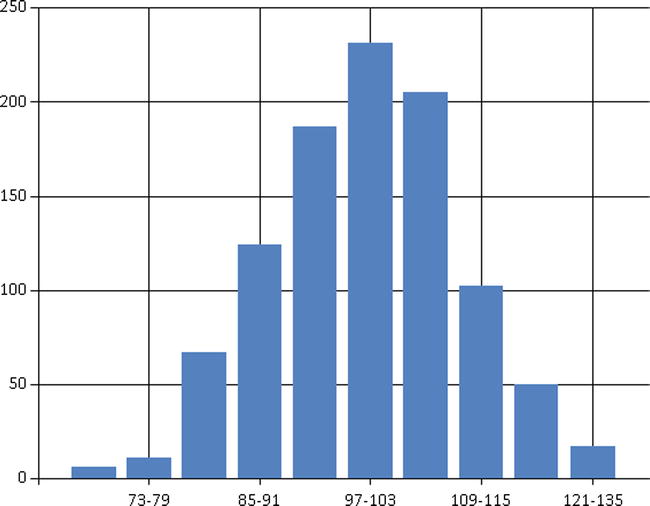
The Math.NET Numerics library includes implementations of all the most important statistical distributions in the namespace MathNet.Numerics.Distributions. For example, consider a normal (bell-curve) distribution centered on 100.0 with standard deviation 10.0.
open MathNet.Numerics.Distributions
open System.Collections.Generic


let exampleBellCurve = Normal(100.0, 10.0)
You can now draw random samples from this distribution as:
> exampleBellCurve.Samples();;


val it : IEnumerable<float> =

  seq [102.4361311; 88.10527203; 100.1478871; 88.2344663; ...]
Math.NET Numerics also includes a type MathNet.Numerics.Distributions.Histogram for categorizing numeric data into a histogram. For example, we can define a function that categorizes data into a given number of buckets and generates a label for each bucket as:
let histogram n data =

    let h = Histogram(data, n)

    [|for i in 0 .. h.BucketCount - 1 ->

          (sprintf "%.0f-%.0f" h.[i].LowerBound h.[i].UpperBound, h.[i].Count)|]
Using this function, we can now chart the sample data drawn from the normal distribution as:
exampleBellCurve.Samples()

    |> Seq.truncate 1000

    |> histogram 10

    |> Chart.Column
Giving:
The Math.NET library supports many more-sophisticated distribution types, including multivariate Gaussian distributions (MatrixNormal), coin flips (Bernoulli), decaying-exponential distributions (Exponential), and distributions that can be used to simulate the time dealys between occurrences of events (Poisson).
Using Matrices and Vectors from Math.NET
The Math.NET Numerics library includes extensive support for matrices, vectors, and linear algebra. For example, you can create and add two vectors:
open MathNet.Numerics.FSharp
open MathNet.Numerics.LinearAlgebra.Generic


let vector1 = vector [1.0; 2.4; 3.0]

let vector2 = vector [7.0; 2.1; 5.4]


vector1 + vector2
giving:
val it : Vector<float> = seq [8.0; 4.5; 8.4]
Likewise, you can define and multiply two matrices:
let matrix1 = matrix [[1.0; 2.0]; [1.0; 3.0]];;
let matrix2 = matrix [[1.0; -2.0]; [0.5; 3.0]];;

let matrix12 = matrix1 * matrix2;;
Giving:
val matrix1 : Matrix<float> = 1,2

1,3

val matrix2 : Matrix<float> = 1,-2

0.5,3

val matrix12 : Matrix<float> = 2,4

2.5,7
The default formatting for vectors and matrices is not particularly good. Better formatting can be achieved by adding a print-transformer to first convert to one- or two-dimensional arrays, which offers better formatting in F# Interactive:
open MathNet.Numerics.LinearAlgebra.Double


fsi.AddPrintTransformer (fun (x : DenseVector) ->

     box [|for i in 0 .. x.Count - 1 -> x.[i]|])


fsi.AddPrintTransformer (fun (x : DenseMatrix) ->

     box (array2D [for i in 0 .. x.RowCount - 1 ->

                       [for j in 0 .. x.ColumnCount - 1 -> x.[i, j]]]))
The results above then become:
val vector1 : Vector<float> = [|1.0; 2.4; 3.0|]

val vector2 : Vector<float> = [|7.0; 2.1; 5.4|]

val it : Vector<float> = seq [8.0; 4.5; 8.4]
and:
val matrix1 : Matrix<float> = [[1.0; 2.0]

                               [1.0; 3.0]]

val matrix2 : Matrix<float> = [[1.0; -2.0]

                               [0.5; 3.0]]

val matrix12 : Matrix<float> = [[2.0; 4.0]

                                [2.5; 7.0]]
Matrix Inverses, Decompositions and Eigenvalues
The linear-algebra support in the Math.NET Numerics library is extensive and can be configured to use highly optimized native linear-algebra packages under-the-hood. The defaults are to use fully managed linear algebra. For example, to compute the inverse of a matrix, simply call the .Inverse() method on the matrix.
First, define a large 100x100 matrix with random numbers and compute its inverse:
let largeMatrix = matrix [for i in 1 .. 100 -> [for j in 1 .. 100 -> rand()]]


let inverse = largeMatrix.Inverse()
Next, multiply the two to check that the inverse is correct:
let check = largeMatrix * largeMatrix.Inverse()
Giving:
val check : Matrix<float> =

  [[1.0; 2.775557562e-16; 4.371503159e-15; 1.887379142e-15; 1.887379142e-15;

    -1.054711873e-15; -2.664535259e-15; 6.689093723e-15; 4.440892099e-16;

    -5.551115123e-16; -2.664535259e-15; -5.551115123e-16; 2.664535259e-15;

    -2.220446049e-15; 1.110223025e-16; -1.776356839e-15; -2.886579864e-15;

    ...
As expected, this is numerically very close to the identity matrix. Likewise, common decompositions of matrices can be computed using the Svd(), Evd(), LU(), and QR() methods on the matrix itself. For example, to compute the eigenvalues and eigenvectors of a matrix:
// Open this namespace so we can use the Evd extension method.

open MathNet.Numerics.LinearAlgebra.Double

open MathNet.Numerics.LinearAlgebra.Generic


let evd = largeMatrix.Evd()

let eigenValues = evd.EigenValues()
Giving:
val evd : Factorization.Evd

val eigenValues : Vector<Numerics.Complex>


> eigenValues;;


val it : Vector<Numerics.Complex> =

  seq

    [(49.9915503772098, 0);

     (-0.406120558380603, 2.92962073514449);

    ...
Adding a printer for complex numbers:
fsi.AddPrinter (fun (c : System.Numerics.Complex) -> sprintf "%fr + %fi" c.Real c.Imaginary)
Gives:
val eigenValues : Vector<Numerics.Complex> =

  seq

    [49.991550r + 0.000000i; -0.406121r + 2.929621i; -0.406121r + -2.929621i;

     3.095556r + 0.000000i; ...]

    ...
Units of Measure
F# includes a beautiful feature in its type system called units of measure. This feature lets you annotate numeric types with annotations such as kg, m, and sec that indicate the kind of number the quantity represents—that is, its unit of measure. You can also use the feature to annotate other, user-defined types that are ultimately based on numeric quantities. This feature is best explained using code for physical simulations and is rooted in scalable quantities. It also has a wide range of surprising applications outside physical simulation, including annotating code with units for integer quantities such as pixels, currencies, or click-counts.
The F# 3.0 library comes with predefined unit definitions matching the Système International (SI) standard in the namespaces Microsoft.FSharp.Data.UnitSystems.SI.UnitNames (for base unit names such as kilogram and derived units such as hertz) and namespaces Microsoft.FSharp.Data.UnitSystems.SI.UnitSymbols (for standard abbreviations of these names, such as kg and hz, respectively). To define a new kind of measure annotation, use a type definition with a Measure attribute:
[<Measure>]

type click


[<Measure>]

type pixel


[<Measure>]

type money
Once a set of measures is defined or chosen from the library, the basic numeric types and literals can include these qualifications. For example, consider the computation “we are receiving 200 clicks every second, and the Web site has been running 3.5 seconds.” This computation can be performed as:
open Microsoft.FSharp.Data.UnitSystems.SI.UnitNames
open Microsoft.FSharp.Data.UnitSystems.SI.UnitSymbols


let rateOfClicks = 200.0<click/s>

let durationOfExecution = 3.5<s>
A calculation involving these quantities is:
let numberOfClicks = rateOfClicks * durationOfExecution
The inferred type of numberOfClicks is float<click>.
val numberOfClicks: float<click> = 700.0
If a mismatched unit type is used in such a calculation, a type error is reported.
Adding Units to a Numeric Algorithms
Code that uses units of measure may also be generic over the units involved. This is particularly important for generic algorithms. To demonstrate this, consider three simple algorithms for integrating a function, as learned in elementary calculus. We will take the first three numerical-integration techniques for integrating a function f(x) of one variable over the range from a to b, taken from http://en.wikipedia.org/wiki/Numerical_integration. These are
- integrating by evaluating f at a midpoint
- integrating by evaluating f at the endpoints
- integrating by evaluating f at a mesh of n sub-intervals evenly spaced between a


Translating these into code, the nonunitized implementations are:
let integrateByMidpointRule f (a, b) = (b - a) * f ((a + b) / 2.0)


let integrateByTrapezoidalRule f (a, b) = (b - a) * ((f a + f b) / 2.0)


let integrateByIterativeRule f (a, b) n =

    (b - a) / float n *

    ((f a + f b) / 2.0 +

      List.sum [for k in 1 .. n - 1 -> f (a + float k * (b - a) / float n)])
Here are the unitized implementations. Note that you author the unitized numbers by introducing type annotations:
let integrateByMidpointRule (f : float<'u> -> float<'v>) (a : float<'u>, b : float<'u>) =

    (b - a) * f ( (a+b) / 2.0)


let integrateByTrapezoidalRule (f : float<'u> -> float<'v>) (a : float<'u>, b : float<'u>) =

    (b - a) * ((f a + f b) / 2.0)

let integrateByIterativeRule (f : float<'u> -> float<'v>) (a : float<'u>, b : float<'u>) n =

    (b - a) / float n *

    ((f a + f b) / 2.0 +

      List.sum [for k in 1 .. n - 1 -> f (a + float k * (b - a) / float n)])
In all three cases, the inferred, generic unitized type for the functions gives a return type of float<'u 'v>:
val integrateByMidpointRule :

  f:(float<'u> -> float<'v>) -> a:float<'u> * b:float<'u> -> float<'u 'v>

val integrateByTrapezoidalRule :

  f:(float<'u> -> float<'v>) -> a:float<'u> * b:float<'u> -> float<'u 'v>

val integrateByIterativeRule :

  f:(float<'u> -> float<'v>) ->

    a:float<'u> * b:float<'u> -> n:int -> float<'u 'v>
For example, if the x dimension is “time”,—for example, float<s>—and the y dimension is “velocity”—for example, float<m/s>—the result type is float<s m / s>, which simplifies to float<m>—for example, a distance. This is as expected: integrating a velocity over a period of time gives the distance travelled.
When we run these implementations of integration using a linear function as input, they all give the same answer. For example, consider a velocity function for a ball thrown upward at an initial velocity of 100.0<m/s> and falling back to earth at 9.81<m/s>. Using the numeric-integration techniques, we can evaluate the distance the ball is above the earth at time 10 seconds as:
let velocityFunction (t : float<s>) = 100.0<m/s> + t * -9.81<m/s^2>


let distance1 = integrateByMidpointRule velocityFunction (0.0<s>, 10.0<s>)

let distance2 = integrateByTrapezoidalRule velocityFunction (0.0<s>, 10.0<s>)

let distance3 = integrateByIterativeRule velocityFunction (0.0<s>, 10.0<s>) 10
As expected, the results of these approximate integration techniques are precise for a linear function, and in all three cases, the distance computed is 509.5 meters:
val distance1 : float<m> = 509.5

val distance2 : float<m> = 509.5

val distance3 : float<m> = 509.5
As our second example, consider adding units to the variance function you defined earlier in this chapter. In this case, we also change the input to be a sequence, to make the operation more general still:
let variance (values : seq<float<_>>) =

    let sqr x = x * x

    let xs = values |> Seq.toArray

    let avg = xs |> Array.average

    let variance = xs |> Array.averageBy (fun x -> sqr (x - avg))

    variance


let standardDeviation values =

    sqrt (variance values)
The types of the operations are now unitized:
val variance : values:seq<float<'u>> -> float<'u ^ 2>

val standardDeviation : values:seq<float<'u>> -> float<'u>
You can now apply the functions to unitized sequences of data. For example:
let sampleTimes = [for x in 0 .. 1000 -> 50.0<s> + 10.0<s> * rand()]


let exampleDeviation = standardDeviation sampleTimes

let exampleVariance = variance sampleTimes
Giving:
val exampleDeviation : float<s> = 2.865331753

val exampleVariance : float<s ^ 2> = 8.210126054
Adding Units to a Type Definition
When you define a new type, you may include measure parameters as part of the definition of the type. These parameters must be marked with the Measure attribute. For example:
type Vector2D<[<Measure>] 'u> = {DX : float<'u>; DY : float<'u>}
You can use units of measure in conjunction with object-oriented programming, discussed in Chapter 6. For example, here is a vector-type generic over units of measure:
/// Two-dimensional vectors

type Vector2D<[<Measure>] 'u>(dx : float<'u>, dy : float<'u>) =


    /// Get the X component of the vector

    member v.DX = dx


    /// Get the Y component of the vector

    member v.DY = dy


    /// Get the length of the vector

    member v.Length = sqrt(dx * dx + dy * dy)


    /// Get a vector scaled by the given factor

    member v.Scale k = Vector2D(k * dx, k * dy)


    /// Return a vector shifted by the given delta in the X coordinate

    member v.ShiftX x = Vector2D(dx + x, dy)


    /// Return a vector shifted by the given delta in the Y coordinate

    member v.ShiftY y = Vector2D(dx, dy + y)


    /// Get the zero vector

    static member Zero = Vector2D<'u>(0.0<_>, 0.0<_>)


    /// Return a constant vector along the X axis

    static member ConstX dx = Vector2D<'u>(dx, 0.0<_>)


    /// Return a constant vector along the Y axis

    static member ConstY dy = Vector2D<'u>(0.0<_>, dy)


    /// Return the sum of two vectors

    static member (+) (v1 : Vector2D<'u>, v2 : Vector2D<'u>) =

        Vector2D(v1.DX + v2.DX, v1.DY + v2.DY)


    /// Return the difference of two vectors

    static member (-) (v1 : Vector2D<'u>, v2 : Vector2D<'u>) =

        Vector2D(v1.DX - v2.DX, v1.DY - v2.DY)


    /// Return the pointwise-product of two vectors

    static member (.*) (v1 : Vector2D<'u>, v2 : Vector2D<'u>) =

        Vector2D(v1.DX * v2.DX, v1.DY * v2.DY)
Note that some measure annotations are needed on zero values in this sample. In addition, a vector type such as this should normally implement the IComparable interface and the Equals and GetHashCode methods, as described in Chapter 8.
Applying and Removing Units
When you have a unitized value, you can remove the units by simply applying the float function. When you have a nonunitized value, you can apply units to it by using LanguagePrimitives.FloatWithMeasure. For example:
let three = float 3.0<kg>
let sixKg = LanguagePrimitives.FloatWithMeasure<kg> (three + three)
Giving:
val three : float = 3.0

val sixKg : float<kg> = 6.0
Some Limitations of Units of Measure
Units of measure can help tame the sea of floating-point numbers that tends to characterize modern numerical programming. It is important, however, to be aware of limitations of this feature, to avoid its over-zealous application to the detriment of productivity, code-stability, and readability. In particular:
- Units of measure work best for algorithms that deal with summing, multiplying, dividing, and taking integral roots of inputs, such as square roots. Units of measure do not work well for algorithms or computations that deal with other functions, such as exponentials. Algorithms that use these functions can still often be “coarsely” unitized, first by removing units from the inputs and then by reapplying them to the outputs.
- Units of measure must be applied to a particular type, such as
float<_>,decimal<_>,or a user-defined type, such asVector2D<_>above. In particular, you can’t easily be generic over both this type and the unit of measure, except by writing an inlined generic algorithm, as explained in Chapter 5.- Units of measure are an F#-only feature, and they are “erased” at runtime. This means that the unit information isn’t available to “reflective” metaprogramming. Unit information can be provided by F# type providers, something we will look at in Chapter 17.
![]() Note F# units of measure are covered only briefly in this book. For more information, see the MSDN documentation or Andrew Kennedy’s four-part introduction to the topic: search for “Andrew Kennedy Units of Measure Part One” or visit
Note F# units of measure are covered only briefly in this book. For more information, see the MSDN documentation or Andrew Kennedy’s four-part introduction to the topic: search for “Andrew Kennedy Units of Measure Part One” or visit http://blogs.msdn.com/andrewkennedy.
EXERCISE: UNITIZING KMEANS
Summary
In this chapter, you’ve seen how to use F# to perform a range of numeric programming tasks, including the use of the powerful open-source Math.NET library. In the next chapter, we turn to an increasingly important part of programming— building parallel, reactive, and event-driven systems.